


1. Introduction
Scientific discoveries are often dictated by our experimental tools. Cancer research has made dramatic progress since the discovery that cancer cells carry chromosomal imbalance (Boveri, Reference Boveri1902), that chromosomes carry our heritable material (Morgan, Reference Morgan1911), that DNA is the molecule of heredity (Avery et al., Reference Avery, MacLeod and McCarty1944), that somatic DNA changes occur in and modulate the behaviour of cancer cells (Knudson, Reference Knudson1971; Varmus et al., Reference Varmus, Quintrellm, Medeiros, Bishop, Nowinski and Sarkar1973) and ultimately through to our ability to target cancers effectively and predictably (Druker et al., Reference Druker, Tamura, Buchdunger, Ohno, Segal, Fanning, Zimmermann and Lydon1996; Pegram et al., Reference Pegram, Lipton, Hayes, Weber, Baselga, Tripathy, Baly, Baughman, Twaddell and Glaspy1998). Beyond these cell autonomous aspects of cancer, there are promising aspects to treatment that rely on the support that cancer cells demand from their neighbours (Karin et al., Reference Karin, Yamamoto and Wang2004; Fidler et al., Reference Fidler, Kim and Langley2006; Brown et al., Reference Brown, Charles, Hoare, Rye, Jodrell, Aird, Vora, Prabhakar, Nakada and Corringham2008), such as inflammation (Balkwill & Mantovani, Reference Balkwill and Mantovani2001), angiogenesis (Folkman, Reference Folkman1971) and selective metastatic destinies (Fidler, Reference Fidler2003). A focused targeting of these aspects depends on model systems that allow affordable, high-throughput, reliable and physiologically relevant measurements of the tumour microenvironment.
Xenograft transplantation of human cancer cells into immunocompromised mice is a common in vivo model of human cancer. However, a genome-wide study of genes involved in tumour/host interactions in xenografts using a hybridization-based microarray platform is hindered by the undefined extent of cross-hybridization, which precludes the assessment of the origin of the transcript. Ideally, xenograft samples could be hybridized to a human array to provide estimates of the gene expression of the transcripts originating from the (human) tumour sample and then hybridized against a mouse array for expression estimates corresponding to transcripts originating from the (mouse) host. However, clearly the similarity of the genomes of the two species will mean that transcripts originating from the host mouse may hybridize to the probes of the human array and vice versa, inflating the estimate of gene expression. We solve this problem by identifying and removing cross-hybridizing probes on the mouse and human versions of the Affymetrix® All Exon arrays and creating a novel set of probes specifically designed for xenograft studies. Given the difficulty in accurately predicting cross-hybridization based only on knowledge of the probe sequence (Pariset et al., Reference Pariset, Chillemi, Bongiorni, Romano Spica and Valentini2009), we based our selection of cross-hybridizing probes on a control set of non-xenograft samples (i.e. pure human or mouse mRNA) profiled on both the mouse and human arrays. We demonstrate the effectiveness of these selected probes on both the control set and an additional set of xenograft samples profiled on both the human and mouse Exon arrays. Moreover, we identify a specific case for induction of epithelial mesenchymal transition (EMT) in the tumoral component, against a backdrop of mouse stomal expression of mesenchymal genes. This is achieved by comparison of the deconvoluted human signature with those achieved in vitro.
2. Results
(i) Description of the filtering process
Using the set of control samples, we classified each probe on each of the microarray platforms as either cross-hybridizing or species-specific (see Fig. 1a). The determination was based on whether those probes showed significant signal when the incorrect species was hybridized to the array, with the assignments being made based on unsupervised clustering of the intensities of the probes (see section 4(iv) for details).
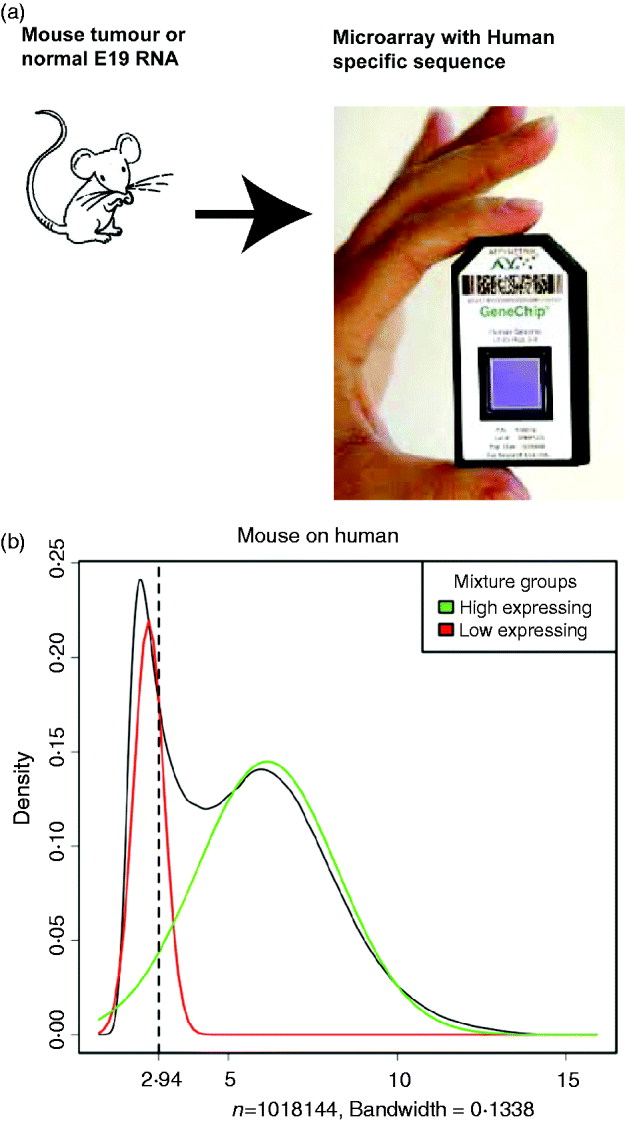
Fig. 1. Illustration of the filtering procedure for finding cross-hybridizing probes, using mouse samples assayed on the human Exon array. The density of the second largest probe across the six mouse samples (for all probes) is shown in black in both human and mouse panels. A two-group mixture model was fit to this distribution, and each probe classified as high or low expressing based on their posterior probability of being in the low-expressing group. For the cross-hybridizing filter, only probes classified as low expressing for samples assayed on the opposite species array were kept. The same approach was used for filtering non-responsive probes, only in that case samples assayed on the correct array were used, and probes in the high-expressing group were retained. Left: Overlayed on the overall density (black), are the predicted normal densities of the two underlying groups found by fitting the mixture model; these densities form the basis of determining the posterior probability of being in the low-expressing group of probes. The green density is interpreted as the estimated density of the high-expressing group of probes and the red density as that of the low-expressing group. Right: The shaded areas overlaid on the density show the values for which probes were classified into the low-expressing group, based on increasingly lenient values of the posterior probability: 0·80, 0·50 and 0·20. Ultimately the most stringent criteria (0·80) was used for classification of the probes.
Probes classified as cross-hybridizing generally demonstrated high signal in the human sample as well (Fig. 2). Empirical measurement of cross-hybridization allowed the illustration of the mixture model filtering procedure for finding cross-hybridizing probes and non-response probes, showing all of the sets of samples (Supp. Fig. S1), as well as the illustration of different choices of posterior probability for making the cutoff into low-expressing (Supp. Fig. S2). If we compare the gene expression estimates of those samples hybridized with the correct array, we see that removal of cross-hybridizing probes result in a noticeable drop in our estimate of gene expression in the human sample (Supp. Fig. 3). One reason for the decrease in gene expression levels is that the removal of cross-hybridizing probes increases the percentage of probes that are ineffective in hybridizing to the mRNA that is present (‘non-responding’). As a result, removal of only cross-hybridizing probes – that has, by definition, been shown to generally hybridize well – results in a higher proportion of non-responding probes per gene. An increase of 10–15% in non-response probes is common, even for genes with originally low levels of non-response probes (see Supp. Fig. S4). A sizable number of expressed genes also contain non-responding probes (see Supp. Fig. S5).
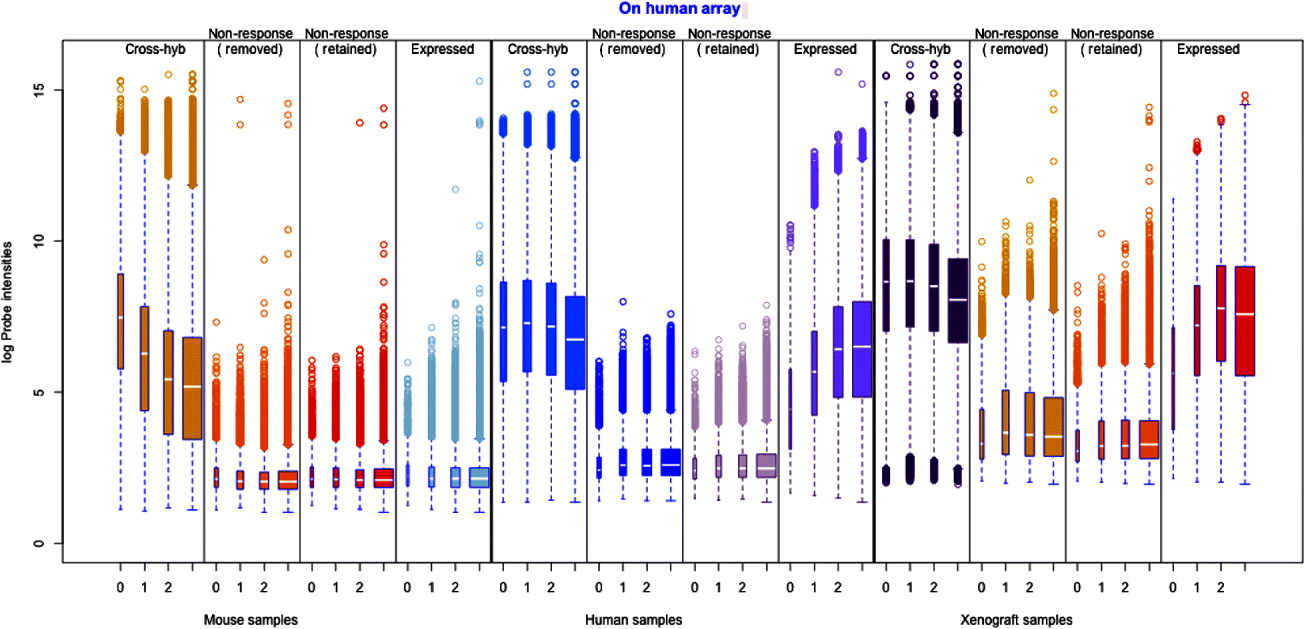
Fig. 2. Distribution of individual probes across all of the samples, grouped by their classification on the filtering and the number of mismatches to the opposite species.
To guard against non-responding probes diluting the estimates of gene expression, we further remove non-responding probes. We again classify individual probes, using the same classification procedure used in identifying the cross-hybridization probes, but this time based on the intensity levels when the correct species is hybridized to the array; in this way we identify individual probes that are expressed lowly. Many probes so identified will come from genes that are simply not expressed in our control samples, and therefore we only remove non-response probes from genes that would be otherwise classified as expressed (see section 4(iv) for details).
Because our method of filtering probes will only detect cross-hybridization if the gene is expressed in our control samples, we also aligned the probes of each array to the genome of the opposite species as a simple comparison of how many probes we might be missing. The probes removed based on our cross-hybridization filter include approximately 96% of probes that exactly matched the genome of the opposite species (i.e. with zero mismatches) and 87% of probes that matched with one mismatch; see Supp. Table S1. To make sure that we were not missing any cross-hybridizing probes, we further removed these probes from further consideration (approximately additional 8000–10 000 probes).
Removal of (1) cross-hybridizing probes, (2) non-responding probes in expressed genes and (3) probes aligning to the opposite genome with no more than one mismatch resulted in a set of probes that we will refer to as ‘xenograft-specific’. The entire filtering procedure removed approximately 83% of the human probes and 79% of the mouse probes (of those probes meeting our original annotation standards); see Table 1.
Table 1. Number of probes and genes at different stages of filtering
(ii) Assessing the xenograft-specific probes
As noted above, an alignment of the array probes to the genome of the opposite species shows that our set of filters, based on empiric measurement of cross-hybridization, remove approximately 98% of probes that identically map to the genome of the opposite species, with almost all of these probes being removed based on our cross-hybridization filters (as opposed to the non-response filter). However, the data derived filters detect much more than this simple sequence similarity, with perfect matches to the genome of the opposite species constituting a small proportion of the probes removed due to cross-hybridization. Indeed, the majority of probes removed due to the cross-hybridization filter did not match to the opposite species genome with less than two mismatches. Examining the probe intensity of the probes removed due to cross-hybridization (Fig. 2), it is clear that the overall distribution of probe intensity on the opposite species declines with decreasing sequence similarity. However, our probes detected by our cross-hybridization that do not have high-sequence similarity with the opposite species’ genome still show very high levels of expression. Similarly, the proportion of probes removed from a gene is generally only slightly higher for genes identified by Ensembl as having a homologue as compared with those that do not (Supp. Fig. S6). As a model of cross-hybridization, pure sequence similarity is simplistic and clearly overlooks other possible factors, but it highlights the advantage of using cross-hybridization observed on actual mouse and human samples to obtain accurate xenograft-specific estimates.
One reason that our cross-hybridization filter detected many probes with low sequence similarity to the opposite species is that some probes detected may be generally non-specific and easily hybridize to other targets than those for which they were designed. For example, of the probes that had high guanine and cytosine (GC) content – a feature that can result in greater propensity to cross-hybridize – all but one of the probes on the two arrays combined were classified as cross-hybridizing, even though high GC probes showed no greater propensity to align to the contrary genome than other probes (see Supp. Table S2). Removal of cross-hybridization probes is therefore also removing probes that show poor performance even for the correct species. Similarly, we note that the probes identified as non-response are slightly enriched in probes with high adenosine and thymidine (AT) content (ignoring probes identified as cross-hybridizing).
Evaluation of the gene expression values from the control set of arrays shows that the gene estimates for samples hybridized to the incorrect array, which previously spanned a large range of values, generally dropped to background levels once only the xenograft-specific probes were used (Fig. 2). Furthermore, restricting attention to those genes that contain at least five probes in the xenograft-specific set shows that even those few instances of high expression came from genes with less than five probes remaining after the filtering (again see Fig. 2). For this reason we maintained a minimum of five probes per gene in all of our further analysis. We note that the design of the Exon array had a goal of four probes per probeset (Exon) when feasible: http://www.affymetrix.com/support/downloads/library_files/HuEx-1_0-st-v2.r2.dt1.hg18.ps.zip); thus this is a similar cutoff.
In addition to the complete lack of expression in the cross-species samples, our xenograft-specific probes found no genes with significant differences between the tumour and the normal mouse samples profiled on the human array, nor between the tumour and the normal human samples hybridized to the mouse array. In contrast, before filtering, 919 and 197 genes were found to be differentially expressed for the mouse and human samples, respectively (based on adjusted p-values <0·05 for genes with at least five probes in the set of xenograft-specific probes, Supp. Table S2).
However, there is loss of sensitivity in detecting differential expression for samples arrayed onto their species-appropriate array. As compared with the original moderated t-statistics, the t-statistics using only the xenograft-specific probes are much smaller in magnitude than the original, although still highly correlated (Supp. Fig. S7). This is undoubtedly due to the dampened gene expression signal after filtering, described above (section 4(iv)) (Fig. 3). As a result, many genes that were originally found differentially expressed before filtering were no longer so identified after filtering: approximately 39% of genes on the human array and 28% of genes on the mouse array that were originally found significant were no longer detected as significant with the xenograft-specific probes (Supp. Table S2).
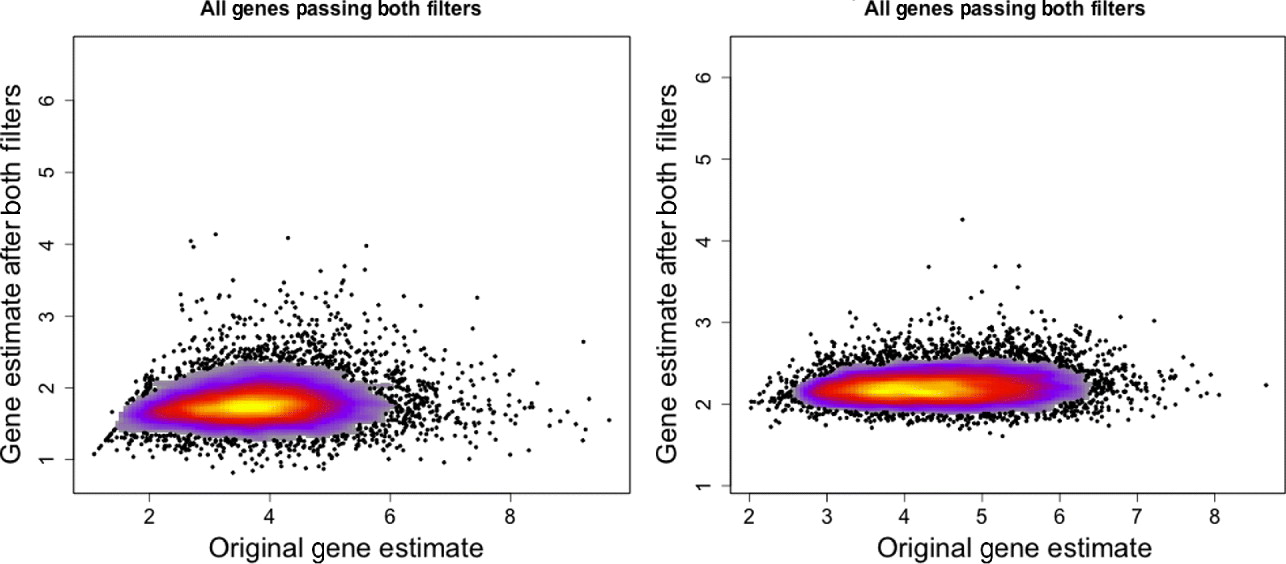
Fig. 3. Gene expression estimates for single mouse sample (MO2-3 E17) profiled on the human Exon array. Gene expression values using only the xenograft specific probes (y-axis) are plotted against the gene expression estimates using all probes on the array (x-axis). Left: All genes that have a probe in the xenograft-specific set are plotted. Right: Only genes that have at least five probes in the xenograft-specific set are plotted.
A large number of genes are completely lost by the filtering process (about 32–40% of genes, once the requirement of five probes per gene was taken into account). For descriptive purposes, we evaluated the genes that are lost based on their gene ontology categorization. Some GO categories are completely unrepresented after removal of these genes, but all of these were categories that contained less than six genes to begin with, with over 75% having only 1–2 genes. This indicates that, at a minimum, most important GO categories are represented, though perhaps by small numbers of genes. More precise testing of which GO categories are over represented in lost genes compared with that expected by chance, result in only a handful of categories (see Supp. Tables S3 and S4). Categories that suffer higher-than-expected loss of genes in both mouse and human are related to sensory perception, G-protein-coupled receptor protein signalling pathway and cellular macromolecular complex assembly (see Supp. Fig. S6).
(iii) Interrogating xenograft samples
Thus far, we have considered only the pure human and pure mouse samples profiled on each array in order to evaluate how well our xenograft-specific probes removed the signal from the incorrect species and conserved the signal from the correct species. We now turn the impact of using our xenograft-specific probes in analysis of actual xenograft samples, which are a mixture of mRNA originating from the mouse and human cells. Xenograft samples were each hybridized to the two types of array (MoEx-1_0-st-v1 and HuEx-1_0-st-v2), with the goal of deconvoluting the RNA levels into a contribution due to the mouse (stromal) cells and the contribution of the human (tumour) cells. The xenograft-specific probes on the mouse array give an estimate of the expression of mouse mRNA levels and those of the human array give estimates of human mRNA levels.
We compared estimates of gene expression using the xenograft-specific probes (the ‘species-specific’ estimate) to that obtained using all probes with no filtering (the ‘contaminated’ estimate). We again limited ourselves to genes with a minimum of five probes in the xenograft-specific set of probes because of the improved species specificity seen above. This resulted in 10 056 human genes and 11 035 mouse genes that contained more than five probes after both filters.
We first note that using only the xenograft-specific probes has a definite impact on the gene expression estimates as compared with using the full set of probes. Classification of the xenograft-specific mouse gene estimates as expressed or non-expressed (see section 4(vii)) shows approximately 15–25% of genes per sample are considered expressed in the mouse, as compared with approximately 60% if the contaminated estimates are classified; for the human array, approximately 60% of xenograft-specific gene estimates are classified as expressed, as compared with 90% of contaminated estimates (see Supp. Table S6). About 25% of human genes and 40–50% of mouse genes that were originally classified as expressed, based on contaminated estimates, change to being classified as non-expressed.
In Supp. Fig. S15, we compare the distribution of the xenograft-specific and contaminated gene estimates. For both the mouse and human array, there are not clear distinctions in expression levels of the contaminated estimates, with both showing a general spread across the expression space and a few lower-expressed estimates. The xenograft-specific gene estimates, in contrast, have a very different distribution on the two arrays and also a very different from the contaminated estimates: the human estimates show large clusters of both expressed and non-expressed genes, whereas the mouse estimates are predominately low-expressed, although there is large tail from the expressed genes.
We can also see the effect of the filtering by plotting the contaminated expression estimates against the corresponding average gene signal seen for the contaminating species in the control set (Supp. Figs S8 and S10). In both human and mouse expression estimates, we see a distinct set of genes for which there is strong correlation between the contaminated gene estimate and the average signal of the contaminating species (although it is important to note there is some correlation even for the pure (non-xenograft) samples from the control set, Supp. Fig. S9). The species-specific estimates given by using the xenograft-specific probes give these correlated genes low species-specific estimates with little correlation with the average signal of the contaminating species, demonstrating the effect of removal of the contamination.
Examining those genes that only had cross-hybridizing probes removed in the filtering process (and no non-responding probes) shows that the drop in gene expression is greater for the xenograft samples than the pure samples, again indicating that the xenograft-specific probes are removing a larger portion of the signal due to removing the effect of the contaminating mRNA (Supp. Fig. S11). Furthermore, the drop in gene expression increases for genes with increasing percentage of cross-hybridizing probes removed from the gene. For pure samples in the control set, in contrast, there is a drop with increasing percentage of cross-hybridization probes in the gene, but the drop in xenograft expression is consistently larger, again demonstrating that the xenograft-specific probes are removing contaminating signal and not merely replicating the behaviour seen for pure samples.
Moreover, the effect on the signal by creating species-specific gene estimates for the xenograft samples is clearly much larger for the mouse estimates than the human estimates. Across all genes, the decrease in mouse gene estimates in the xenograft samples is much larger than we see in the corresponding human-specific estimates or in the pure mouse estimates from the control set. Moreover, the decrease in expression is dramatically larger, as compared with the human-specific estimates on the same samples, for genes with that were originally estimated to have high expression using the unfiltered probes (Supp. Fig. S10) and for genes with a large percentage of probes removed due to cross-hybridization (Supp. Fig. S11); again this is contrary to what is observed for the pure mouse samples. This all supports the proposition that the xenograft-specific probes are providing novel estimates of gene expression beyond a shift in the level of signal. For estimates of mouse expression, the effect is particularly striking, which is expected given the expected preponderance of human (tumour) cells in a xenograft sample, and thus greater levels of contamination from human cells when trying to estimate levels of expression of mouse mRNA.
(iv) Examination of homologous genes
To supplement in situ hybridization or laser capture microdissected RNA profiling, we present an analysis tool for xenografts, which could inform human cancer gene expression profiling by indicating which cell types a particular gene is expressed from in the mixture of cells that form tumour mass. To achieve that, we developed a statistical estimate that exploits the sequence discrimination between human and mouse RNA in the xenograft, to identify whether a transcript is produced by cancer cell or stroma. Of the genes that have unique homologues in the human and mouse and also pass the filtering requirements (8682 genes), approximately 20% were expressed in both mouse and human, 20% were non-expressed in either, 34% expressed in human and not in mouse and only 2% in mouse and not human (see Supp. Table S6). By contrast, before the filtering these same set of genes indicated 70% were expressed in both, 1% were non-expressed in both, 6% in human and not mouse and 0·1% only in mouse and not human.
As a specific example, we look at a set of six genes reported in the literature to be important for stromal reaction to tumours. MMP13 (Lafleur et al., Reference Lafleur, Drew, de Sousa, Blick, Bills, Walker, Williams, Waltham and Thompson2005), CDH9 (Thedieck et al., Reference Thedieck, Kalbacher, Kuczyk, Muller, Muller and Klein2007), FAPα (Scanlan et al., Reference Scanlan, Raj, Calvo, Garin-Chesa, Sanz-Moncasi, Healey, Old and Rettig1994) and PTGS2 (Hu et al., Reference Hu, Peluffo, Chen, Gelman, Schnitt and Polyak2009) have been shown to exhibit elevated expression in stroma, in response to carcinoma. We also used genes that appear in mesenchymal-type cancers, in order to utilize this platform system to assess if these genes in mesenchymal-type cancer are expressed by the cancer cells as well. These include PTX3, CDH11 (Schneider et al., Reference Schneider, Wu, Le, Cho, Brenner, Blackburn and Agarwal2012) and COL1A2, and are central to stromal signatures in our previous publications on expression profiling of human gastric (Boussioutas et al., Reference Boussioutas, Li, Liu, Waring, Lade, Holloway, Taupin, Gorringe, Haviv, Desmond and Bowtell2003), GBM (TCGA, 2008) and ovarian (Tothill et al., Reference Tothill, Tinker, George, Brown, Fox, Lade, Johnson, Trivett, Etemadmoghadam and Locandro2008) cancers. These genes have homologues in both the human and the mouse, and thus it is expected that they have a great deal of sequence similarity and cross-hybridizing probes. Indeed 60–90% of the probes for these genes are removed due to cross-hybridization, with a much smaller percentage due to non-response, particularly for the mouse array (Fig. 4). Such homologues are of great interest in xenograft studies, since differences in gene expression for the stromal and tumour could be extrapolated back to tumour–stromal interactions in human subjects.
Fig. 4. Barplots showing the percentage of probes lost due to cross-hybridizing (light grey), lost due to non-response (dark grey) and xenograft-specific (black) for the six genes discussed in section 2(iv). Right: probes for the human array; Left: probes for the mouse array.
In Fig. 5, we show the human and mouse gene expression estimates for these genes on the xenograft samples with different phases of filtering. The mouse gene estimates mainly show an overall reduction in signal, except for FAP that retains the same level of expression before and after filtering. Indeed, compared with the large drop seen in the mouse gene estimates from the xenograft samples more generally (discussed above), the relatively small change in expression of some of the genes is notable; however, this is not unduly surprising since these genes were selected as examples of genes showing a stromal reaction, and thus likely to be well expressed in the xenograft sample. The human gene estimates, however, illustrate how the filtering process can change the interpretation of gene expression. For example, half of the genes have no average drop in signal in the final xenograft-specific estimate, whereas the other half decrease to various degrees. After filtering at least three of the genes show greater range of expression than before and CDH11, shows slightly greater differential expression between Matrigel and Collagen samples, the two conditions of interest. These genes also illustrate the effect of removing the non-responding probes to maintain the level of gene expression, particularly for genes such as CDH9 and MMP13, which have a large percentage of non-responding probes.
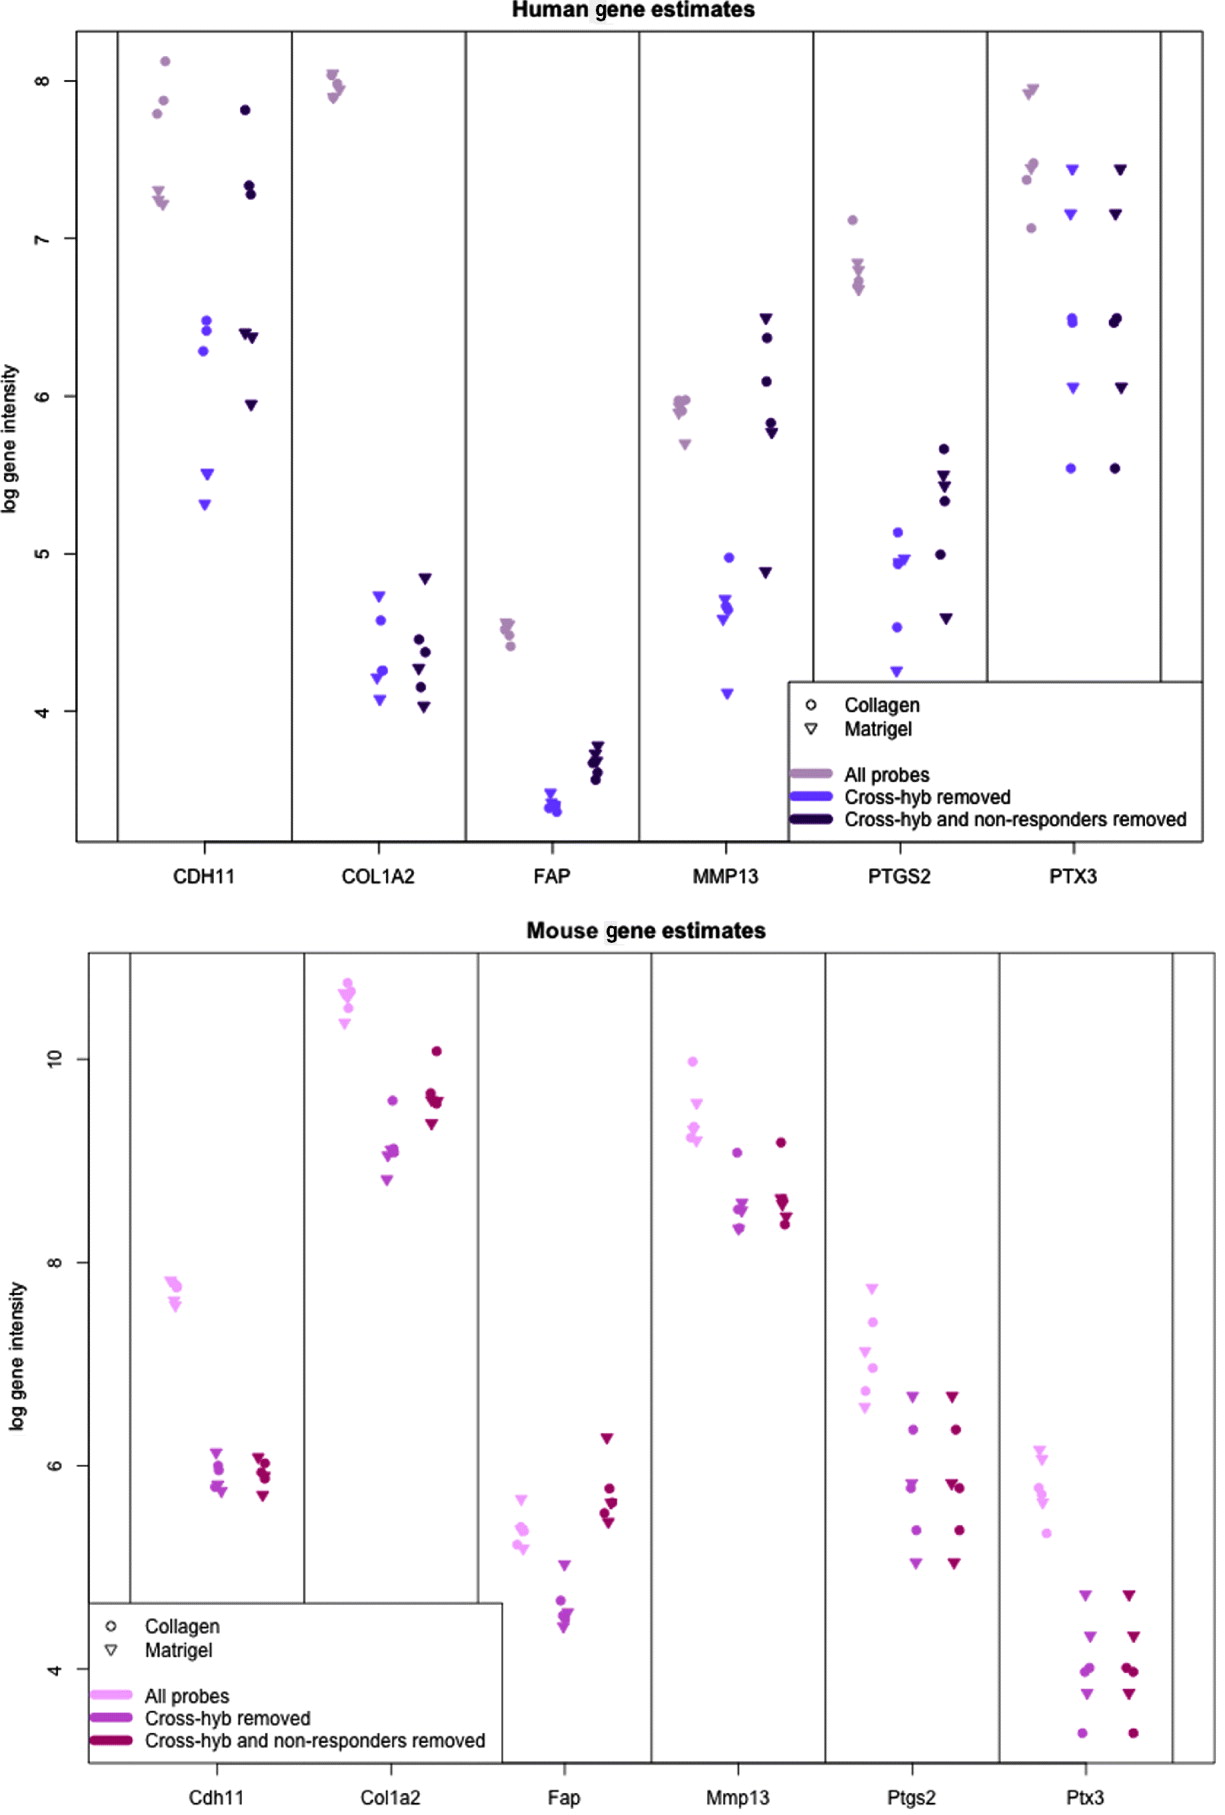
Fig. 5. Values of gene expression for specific candidate genes when no probes are removed (grey), only cross-hybridizing probes (light colour) and both cross-hybridizing and non-responding probes (dark colour). (Top): Human gene estimates based on the human array (Bottom) mouse gene estimates based on the mouse array. Collagen samples are shown with a dot and Matrigel samples are shown with a triangle.
We can characterize whether genes are expressed in solely the tumour or the stromal cells (human and mouse, respectively) by classifying either their species-specific estimates of gene expression of the individual probes that make up the gene expression estimate (section 4(vii)). For the homologous genes discussed above, FAP and COL1A2 appear to be expressed in only the stromal (mouse) tissues, whereas the other genes appear to be expressed in at least some samples for both stromal and tumour tissue, with the possible exception of PTX3 (Fig. 7). One such example is the gene CDH11, which has been characterized in the literature as part of a stromal response signature (in the midst of genes such as COL1A2, FAP, ACTA2, etc.). However in our results, it is expressed in the human cancer cell as well. As proof that CDH11 in human cancer cases is indeed expressed by the cancer cell, we performed immunohistochemistry on human gastric cancer sections, with antibodies against CDH11 protein (see Fig. 6). The results show that indeed, consistent with our xenograft model, the CDH11 protein is expressed by cancer cells. As aluded to above, CDH11 also shows significant difference in expression levels between the Matrigel and Collagen conditions (p-value<0·01). The comparison of Matrigel versus Collagen suggests that the reason this gene expression is correlated with stromal derived extracellular matrix genes is not because the cell of origin is stromal, but rather as part of the response of the human cancer cell to stromal-derived extracellular constitution. We were interested in the gene expression of the cancer cell and the stroma to altered extracellular matrix, but it is also possible that the gene expression reaction is directly driven by the extracellular matrix (ECM). To address this, we exposed murine tissues without human tumours, in two animals with Matrigel or Collagen, and used real-time PCR of mouse xenograft response genes, such as GzmD and GzmE, and found them to be responsive to the Matrigel directly. By contrast, expression profiling of cultured MCF7 to Matrigel and Collagen did not include the mesenchymal response genes (not shown).
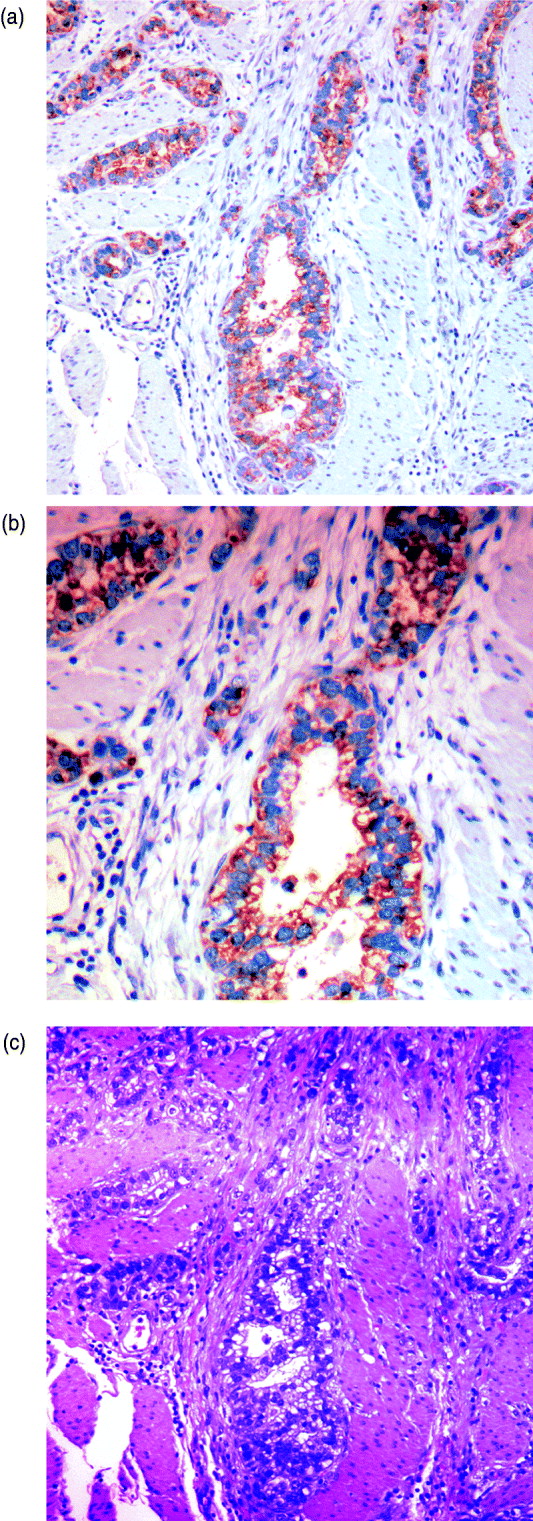
Fig. 6. Immunohistochemistry (IHC) results on human gastric cancer sections, with antibodies against CDH11 protein. (A) IHC of gastric cancer at ×20 magnification, (B) IHC of gastric cancer at ×10 magnification and (C) gastric cancer haematoxylin and eosin (H&E) staining.
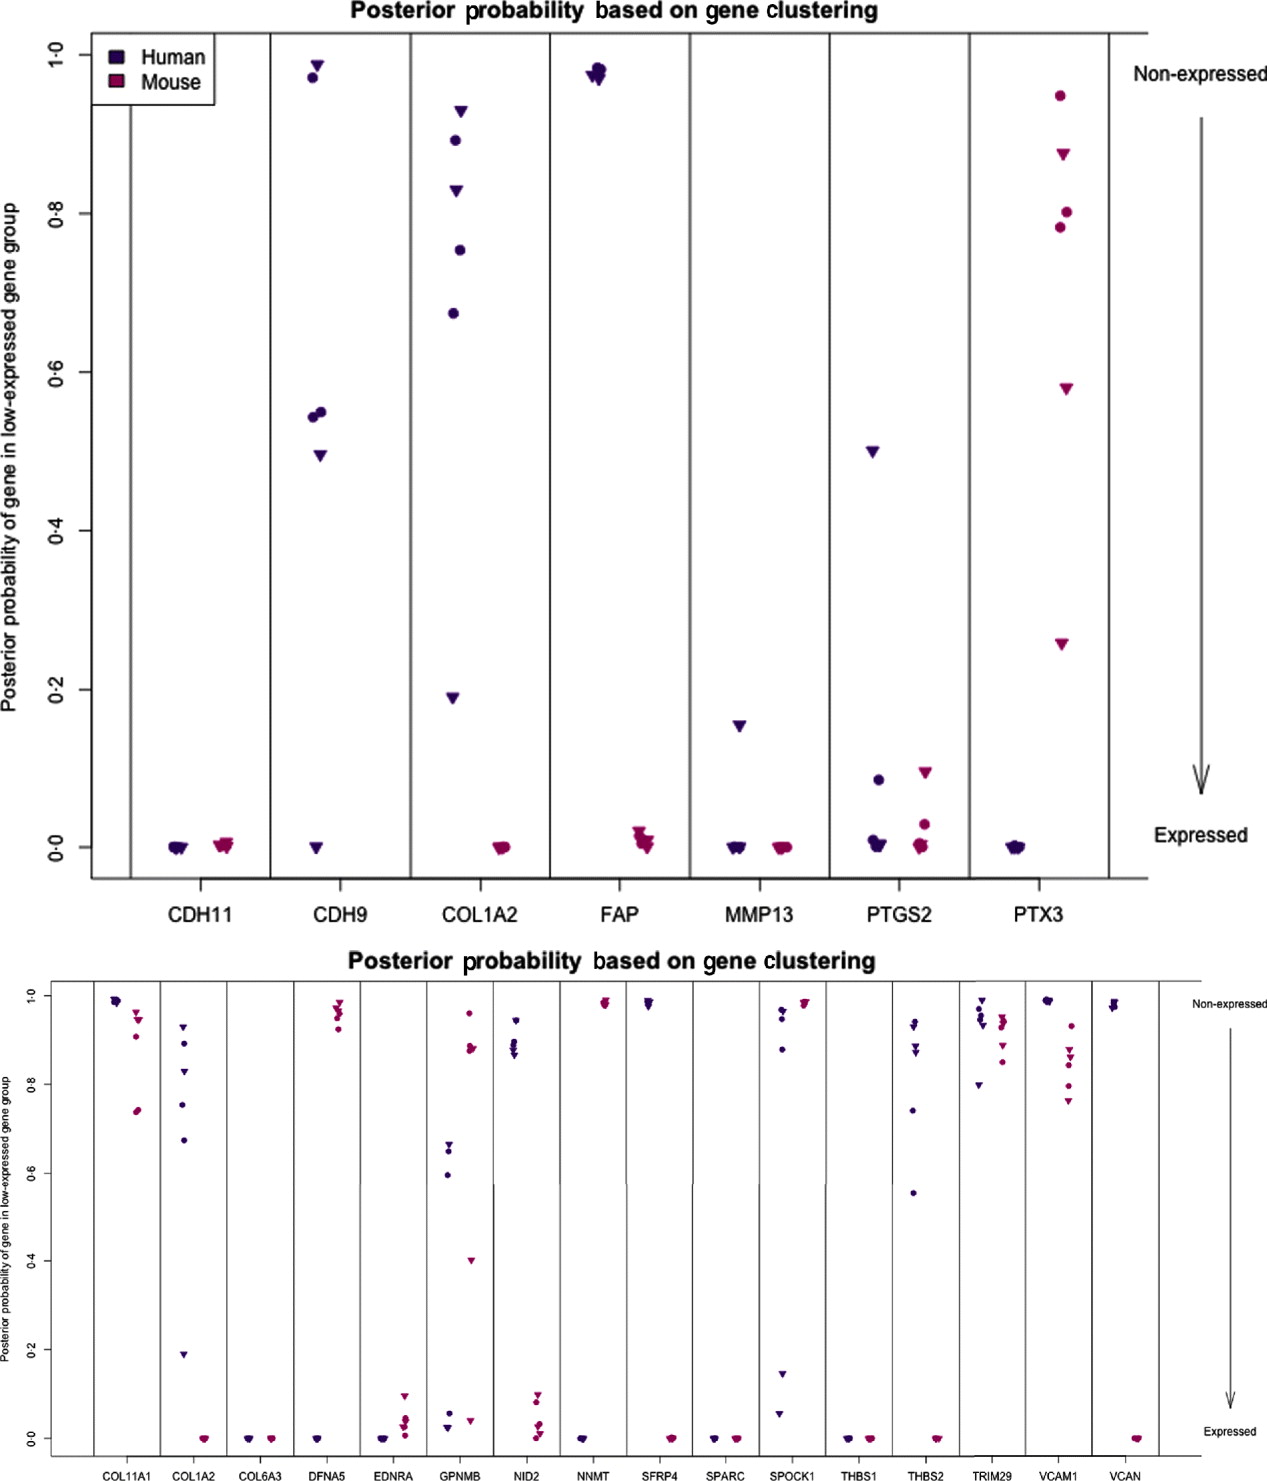
Fig. 7. Posterior probability (per sample) of gene being in the non-expressed gene group for set of candidate genes (top) and set of stromal signature genes (bottom). High values indicate that gene is not expressed.
The diminished number of genes after filtering and the small number of animals compromised the ability to calculate false discovery and significance t-statistics. However, we were specifically interested in this xenograft model to answer a biological question; which mesenchymal type gene is expressed by the epithelial cancer cells as well, and in response to altered environmental conditions, such as ECM density. We further extended our analysis to genes which we previously identified as predictive of ovarian cancer patient outcome, probably contributed by stromal cells (Tothill et al., Reference Tothill, Tinker, George, Brown, Fox, Lade, Johnson, Trivett, Etemadmoghadam and Locandro2008), and which had been interrogated for allelic association with ovarian cancer predisposition (Johnatty et al., Reference Johnatty, Beesley, Chen, Macgregor, Duffy, Spurdle, deFazio, Gava, Webb and Rossing2010). Of these 31 genes, 29 have homologues in mouse and human, and we restrict our consideration to the 16 that had at least five probes remaining in the xenograft-specific probes on both the mouse and human platforms. Among the stromal signature set, five genes are classified as expressed only in the stromal tissue (COL1A2, NID2, SFRP4, THBS2 and VCAN) and two genes are only expressed in tumour tissues (DFNA5 and NNMT). Four are classified as expressed in both (list), three are not expressed in either (list), and two show variability among the samples (list) (Fig. 7; see Supp. Figs S13 and S14 for plots of the actual estimates of expression level from these stromal signature genes). The fact that most of the genes for which we can determine species of origin were expressed in the stroma is further support to our claim that xenograft arrays would properly reflect the situation in human cancer (as reflected by expression profiling of laser capture microdissected RNA). The only two exceptions, DFNA5 and NNMT, may reflect the intricate biological signalling that is engaged between cancer cells and their neighbours. Since these genes were tightly co-expressed in human cancer profiles, and our xenograft model show that they originate from different cell types in the tumour microenvironment, these results further demonstrate the power of the xenograft arrays to deconvolute cancer expression patterns that are contributed by both stroma and cancer cells, and unravel the existence of paracrine crosstalk that contributes to the tight co-expression exhibited by these genes.
Especially interesting are the genes that are expressed by the cancer cell, but are correlated with the expression of stromal genes that predict patient outcome. These are likely the results of the cancer cell response to the altered microenvironment, presented by the activated stroma (Thompson & Weigel, 1998; Tomida et al., 2008). CDH11 appears in human cancer expression data in the midst of stromal response genes (COL1A2, FAP, ACTA2, etc.) and yet, in our results, it is expressed in the human cancer cell as well. The comparison of Matrigel versus Collagen suggests, however, that the reason this gene expression is correlated with stromal derived extracellular matrix genes, is not because the cell of origin is stromal, but rather as part of the response of the human cancer cell to stromal-derived extracellular constitution. This represents the first example of paracrine response of the cancer cell to the stroma, demonstrated by the xenograft model. As proof that CDH11 in human cancer cases is indeed expressed by the cancer cell, we performed immunohistochemistry on human gastric cancer sections, with antibodies against CDH11 protein. The results show that indeed, consistent with our xenograft model, the CDH11 protein is expressed by cancer cells, ostensibly in response to altered tumour extracellular matrix, laminin or other Matrigel-only component.
We were perturbed by the absence of significant changes in the canonical EMT regulators, TWIST1, SNAI1/2, ZEB1/2. Therefore, we assumed that some of the difficulty of identifying those was a consequence of the lower number of analysed, species-specific probes. To further substantiate that the cancer cell response in the xenograft is related to EMT, we performed gene set enrichment analysis (GSEA Mootha et al., Reference Mootha, Lindgren, Eriksson, Subramanian, Sihag, Lehar, Puigserver, Carlsson, Ridderstrale and Laurila2003; Subramanian et al., Reference Subramanian, Tamayo, Mootha, Mukherjee, Ebert, Gillette, Paulovich, Pomeroy, Golub and Lander2005). We performed GSEA on the human-specific gene expression data, and found the mesenchymal signature of ovarian (Tothill et al., Reference Tothill, Tinker, George, Brown, Fox, Lade, Johnson, Trivett, Etemadmoghadam and Locandro2008) and breast cancer (triple negative (Abraham et al., Reference Abraham, Kowalczyk, Loi, Haviv and Zobel2010)) gene sets to be most positively correlated with the human response to the change in extracellular matrix from Matrigel to Collagen. Most of the other significantly associated gene sets represent oestrogen response, which is likely contributed by the oestrogen capsules that are necessary for MCF7 xenografts. Among the mesenchymal response associated with the Matrigel-driven cancer cell signature were key EMT driver genes, such as TGFβ3, Zeb1, Snai2, FN1 and VIM.
3. Discussion
Xenografts and gene expression arrays are both popular tools in the research of cancer aetiology and ideal for investigation of cancer–host interactions. However, hybridization-based profiling of mixtures of nucleic acids from different species is confounded by an unknown degree of cross-hybridization. It has been claimed that the degree of cross-hybridization can simply be postulated from the sequence conservation (Davey et al., Reference Davey, Graham, Vanholme, Swennen, May and Keulemans2009; Toleno et al., Reference Toleno, Renaud, Wolfsberg, Islam, Wildman, Siegmund and Hacia2009; Samuels et al., Reference Samuels, Peeva, Papa, Firth, Francis, Beesley, Lock and Kees2010). It is noteworthy that more conserved genes are likely of key regulatory importance to the cell, and thus, excluding the homologous genes introduces an ascertainment bias of immeasurable impact. However, the focus of this paper is primarily providing the empirical data to support analysis of xenografts and assess the degree such homologous genes are hindered from xenograft analysis. We show here that these sequence-based filters fall short of properly deconvoluting the mRNA species of origin. We describe here a method to empirically identify the Affymetrix chip probesets that are reliably interrogating the signal from one species and not the other, allowing species-specific profiling of both the host and the cancer cell within the mixture derived from the xenograft. Moreover, because the filtering is done at the probe level, we retain gene estimates of even highly homologous genes, which allows for analysis of the stromal–tumour interaction, unlike recent filtering efforts which removed entire homologous genes (Samuels et al., Reference Samuels, Peeva, Papa, Firth, Francis, Beesley, Lock and Kees2010).
The main motivation of this work was to avoid drawing researchers’ attention to the potential artefacts, caused by cross-hybridization. On the other hand, the tool we describe carries an acute weakness, where genes that respond to tumour–stroma interactions do cross-hybridize. All of these genes are actually excluded from the analysis, although they may be affected by the tumour–stroma interactions; therefore one will not be able to address their roles in tumour–stroma interactions in further studies. It is noteworthy that even with massively parallel sequencing a large fraction of the genes are not interpretable in terms of determining human or mouse origin (Conway et al., Reference Conway, Wazny, Bromage, Tymms, Sooraj, Williams and Beresford-Smith2012).
The control of EMT by the cancer microenvironment has recently received a boost of recognition and insights (Haviv & Thompson, Reference Haviv and Thompson2012). Mesenchymal signature represents poor patient outcome in a few types of carcinoma (Sotiriou et al., Reference Sotiriou, Wirapati, Loi, Harris, Fox, Smeds, Nordgren, Farmer, Praz and Haibe-Kains2006; TCGA, 2008, 2011; Tothill et al., Reference Tothill, Tinker, George, Brown, Fox, Lade, Johnson, Trivett, Etemadmoghadam and Locandro2008). Most of the mesenchymal gene expression stems from stromal cells, but, since the EMT process in the epithelial cell is so remarkably changing the phenotype of the cancer cell, it is not clear that all the clinical features of a whole tumour mass that expresses elevated levels of mesenchymal genes, are driven exclusively by the stromal cells. Further confounding the clinical and aetiological interpretation of poor prognosis of mesenchymal gene expression is the extensive variation of the gene expression caused by EMT. The model we used here, with a cell line, MCF7, which represents luminal A, ER+, epithelial breast cancer. A unique advantage of this model, and the ability to discern the expressing cells, is the demonstration that some of the response to elevated ECM in mesenchymal type cancers (modelled by the difference between Matrigel and Collagen) is borne in the epithelial cell, in terms of CDH11, TGFβ3, Zeb1, Snai2, FN1 and VIM. This observation suggests that the debate, whether EMT exists in vivo, is partially driven by the difficulty to detect mesenchymal gene expression in the epithelial cell under an overwhelming signal of the same genes by the stromal cells, while phenotypically, it is possible that the more important gene expression is in the cancer cell.
4. Methods
(i) Preparation of samples
To determine the degree to which human and mouse transcripts cross-hybridize to the other array, normal and malignant tissues of both mouse and human origin, hereafter referred to as the ‘control set’, were profiled on both human and mouse Affymetrix® All Exon arrays. Four pools of equimolar mixes of total RNA were produced for each species: two pools of normal cells and two of tumour cells or tissues.
Human tumour pool: fresh frozen tissues from two breast, two colon and two ovarian cancers from our previously published publication (Tothill et al., Reference Tothill, Kowalczyk, Rischin, Bousioutas, Haviv, van Laar, Waring, Zalcberg, Ward and Biankin2005) were pooled to generate the hC6 human tumour pool. An ideal tumour sample would represent a pool of all tumours in the carcinoma of unknown primary (CUP) collection (Tothill et al., Reference Tothill, Kowalczyk, Rischin, Bousioutas, Haviv, van Laar, Waring, Zalcberg, Ward and Biankin2005), and carefully selected to represent the different molecular subtypes for this cancer type (Perou et al., Reference Perou, Sorlie, Eisen, van_de_Rijn, Jeffrey, Rees, Pollack, Ross, Johnsen and Akslen2000). This is an issue since tumour-to-tumour variation would affect the representation of any given gene, and thus the process of filtration would suffer from compromised extendibility. We wanted the tool to be relevant to particular types of cancers, which are the focus of research in our laboratory. We tested the number of publications per year for each cancer type, and admit that prostate, lung and liver cancers exceed the use of ovarian and colon cancer xenograft models. Nonetheless, we believe that our results are more extendable by the fact that the tumour references represented different tumour types; so the effect of tissue-specific expression of genes on the filtering is minimized.
Human reference pool: the 11 cell line pool used by Perou et al. (Reference Perou, Sorlie, Eisen, van_de_Rijn, Jeffrey, Rees, Pollack, Ross, Johnsen and Akslen2000) was generated to form the human hCL11 cancer cell lines reference pool. The focus of this study was to characterize the contribution of stromal cells to carcinoma-specific gene expression. Thus, improving the reference RNA proximity as representative of normal human tissue would have been a potential improvement to the study design. However, ‘normal’ cell lines do not represent absolutely normal cells, but rather non-transformed cells that have gained the capacity to grow in culture. We therefore resorted to the common reference for microarrays analysis of human solid tumours (Perou et al., Reference Perou, Sorlie, Eisen, van_de_Rijn, Jeffrey, Rees, Pollack, Ross, Johnsen and Akslen2000).
Mouse references: three mouse tumours from each of the mammary (4T1·2), colon (MC-26) and ovarian (RAS mutation conditional knock-in and PTEN knock out) tumour models were obtained to generate the mC9 tumour pool. Three E17 embryos were used to generate the mE17 reference normal pool. For each of the four pools (six tumours or reference sources), total RNA were pooled and arrayed on three independent chips of each species.
The set of xenograft-specific probes were evaluated on xenograft samples created from implanting the MDA-MB-231 breast cancer cell line into mouse mammary glands. All cells were embedded in a two-layer ECM gel. The top layer of 15% Matrigel in 85% Collagen I was placed over a layer of 100% rat-tail Collagen I. The comparison in this study was between gels containing identical numbers of MDA-MB-231 cells, embedded either in the top layer (hereafter referred to as Matrigel) or the bottom layer (hereafter referred to as Collagen). After 72 h of culture at 37 °C in Dulbecco's Modified Eagle medium (DMEM) 10% fetal calf serum (FCS) medium, 1·5 mm3 pieces of these artificial tissues were implanted into the fourth mammary gland of severe combined immunodeficiency (SCID) BALB/c mice. The cell density in the ECM was calculated to allow for 1×10⁶ MDA-MB-231 cells to be introduced into each animal. Tumour growth was monitored using electronic callipers and the mice were culled when the tumours reached 500 mm3. Tumour mass, collected from three independent animals per group, was excised from euthanized animals, and used for total RNA preparation. Total RNA was prepared using Trizol (Invitrogen®) followed by RNeasy mini kits (Qiagen®) as previously described (Boussioutas et al., Reference Boussioutas, Li, Liu, Waring, Lade, Holloway, Taupin, Gorringe, Haviv, Desmond and Bowtell2003). Each of the human and mouse All Exon arrays were hybridized with total RNA from each animal (Table 2).
Table 2. Summary of the samples that were hybridized onto mouse and human All Exon Arrays
a Represents the reference in many solid tumour profiling papers (Perou et al., Reference Perou, Sorlie, Eisen, van_de_Rijn, Jeffrey, Rees, Pollack, Ross, Johnsen and Akslen2000).
(ii) Annotation and processing of the arrays
For the human and mouse arrays, a custom annotation of the array was generated by mapping the probeset (Exon) boundaries provided by Affymetrix to the Ensembl 50 database of gene boundaries. Only probesets that were both annotated by Affymetrix as ‘core’ probesets and that were mapped to the coding region of a gene in Ensembl were retained. Furthermore, we excluded any genes that overlapped in their probesets, unless all of the probesets that mapped to the genes were shared. This resulted in 17 594 gene definitions for the human array (with 1 018 144 probes) and 17 052 gene definitions for the mouse array (with 818 131 probes). This information was converted into the standard chip definition file (cdf) type for processing of the arrays. The samples from the species-specific experiment were background corrected and normalized using quantile normalization with the package aroma.affymetrix in R (Holmquist & Ashley, Reference Holmquist and Ashley2006), separately for each array type (MoEx-1_0-st-v1 or HuEx-1_0-st-v2) and sample species type (mouse or human). For the xenograft samples, the arrays were similarly background corrected and quantile normalized separately for each array type using all of the probes from this custom annotation.
(iii) Alignment of probes
For each of the arrays, the FASTA file of probe sequences, made available by Affymetrix, were aligned to the opposite species genome using Bowtie 0.12.5 (Langmead et al., Reference Langmead, Trapnell, Pop and Salzberg2009). Alignments were allowed up to two mismatches and based on hg18 (human) and NCBIv37 (mouse). All aligned probes were considered aligned, regardless of if the alignment was unique.
(iv) Defining xenograft-specific probes
The process used to select the xenograft-specific probes was exactly the same for probes on both the mouse and human arrays, and so for simplicity we will describe only the human array.
After preprocessing of the arrays, we took a summary of each probes’ intensity value across the six mouse samples and then clustered the probes into high and low expressing probes based on this summary value (see Fig. 1 for an illustration of the filtering procedure). Our summary was the second largest value of the probe across the six mouse samples. This summary value was chosen so as to be sensitive to signal from sample type but still require at least some replications in behaviour across the samples. This gave us a single summary value per probe for the level of mouse signal on the human array. We fitted a two-group mixture model to a random sample of probes (n=100 000) using these summary values with the package mclust in R (Stefanova & Demin, Reference Stefanova and Demin2006). Using the mixture distributions, we calculated a posterior probability of coming from the ‘low’ expression cluster for every probe (see Fig. 1 for an illustration). Probes were considered to be cross-hybridizing if they had a posterior probability of 0·20 or greater of being in the ‘high’ expression cluster, indicating high levels of cross-hybridization.
We similarly identified and removed probes from the human array that were non-responding to human mRNA, if they came from expressed genes. We performed the same cluster analysis described above, only this time using the human samples profiled on the human array (for the mouse samples on the mouse array, the procedure was slightly altered to fit three groups, as the distribution of these probes, unlike the others, was more dispersed). With these samples, probes were classed as non-responders if they had a posterior probability of 0·20 or greater of being in the ‘low’ expression cluster, i.e. showed low expression. To identify whether the gene was considered expressed, we created gene expression estimates after removal of only the cross-hybridizing probes and after the joint removal of both the cross-hybridizing and non-response probes. Using the gene estimates from removal of only the cross-hybridizing probes, we again performed a mixture-model clustering based on the largest gene expression estimate across the human samples. This mixture model, based on removing the cross-hybridizing probes, formed our basis for classification of the genes as non-expressed (genes estimates based on jointly removing both the cross-hybridizing and non-response probes would create inflated cutoffs for classification of genes as non-response, since most non-expressed genes would not have estimates, after non-response probes were removed). We then classified both sets of gene estimates based on the mixture model. Most genes were predicted the same, regardless of whether the non-response probes were first removed. Of those genes whose classification changed from ‘non-expressed’ to ‘expressed’ after the removal of non-response probes, the majority dropped to less than five probes after removal of non-expressed probes, which is our minimal requirement for the number of probes needed for a usable gene estimate. For these genes, we considered the gene non-expressed and did not remove the non-response probes. For the few genes whose classification changed and still had five or more probes after removing non-response probes, we treated the gene as expressed and removed the non-responding probes.
To obtain the final set of xenograft specific probes, we further removed probes that aligned anywhere in the mouse genome with no more than one mismatch. The probes remaining after all three filtering steps make up our xenograft-specific probes. After identification of xenograft specific probes, we created another custom cdf file corresponding to those probes. Gene expression estimates were fitted based on both of our custom cdfs: the xenograft-specific cdf and the original Ensembl annotation cdf, described above. Custom cdfs using just this set of probes and Ensembl gene definitions are available as supplementary files.
(v) Gene expression analysis
The standard RMA model (Irizarry et al., Reference Irizarry, Bolstad, Collin, Cope, Hobbs and Speed2003) implemented in the package aroma.affymetrix was used to obtain gene expression estimates. Differential expression was evaluated using the limma package in R (Smyth, Reference Robinson, McCarthy and Smyth2005; Robinson, et al., Reference Smyth, Gentleman, Carey, Dudoit, Irizarry and Huber2010), which adjusts the estimates of standard deviation by moderating extreme values to be closer to the overall mean of the standard deviations across all genes. For the control set (used in filtering the probes), the moderated t-test was a comparison of the two types of tissue pools within a species, one representing malignant tumours and the other normal tissue, with each group containing three technical replicates (see section 4(i)). For the xenograft samples, the comparison was between Matrigel and Collagen.
(vi) GO annotation analysis
To summarize characteristics of the genes that were lost to possible analysis (due to removal of probes, as well as our requirement of at least five probes after filtering described below), we used the topGO package in R (TOPGO) to perform a GO analysis for detection of ontology groups that had a disproportionately large loss of genes. As our basis of comparison, we identified all genes from our original annotation that initially contained at least five probes and whose Ensembl ID identified with a GO term (13 278 and 12 189 genes for human and mouse, respectively). Of those genes, we then evaluated those genes lost to analysis due to our filtering (7103 and 5421 for human and mouse, respectively) and whether they were significantly over-represented in certain GO terms. We implemented Fisher's exact test per GO term, as well as weighted tests that correct for significance due to neighbouring nodes (Alexa et al., Reference Alexa, Rahnenfuhrer and Lengauer2006). For most purposes, we considered only the p-value obtained after correction due to neighbouring terms, which tends to assign a single category the significance level, rather than spreading the effect through entire branches of the DAG (see, for example, Supp. Fig. S10 for comparison). However, to compare the intersection of the mouse and the human terms, we relied on the uncorrected p-values so as to capture similarities better, since the weighted version at times assigned significance to related, but distinct terms.
(vii) Gene-level predictions of non-expression
An important biological question is whether homologous genes are expressed by the mouse or human cells. Specifically, once xenograft samples are hybridized to both mouse and human arrays, our set of xenograft-specific probes will give gene expression estimates corresponding to estimates of human and mouse mRNA levels, respectively, in the xenograft sample. We give a procedure for evaluating such gene estimates and classifying whether a gene was present in the mouse or human cells, or both.
We built on the mixture-model procedure described above to identify genes that are expressed at background. However, we developed a method that will appropriately classify genes regardless of whether the observed distribution of gene expression estimates contains members of both classes. Instead we only assumed that both expressed and unexpressed probes are well represented on the array, regardless if the probes are used in our gene expression estimates. This is particularly relevant in the case where our genes will be mostly unexpressed, such as the stromal signal in xenograft samples (see Supp. Fig. S15). Indeed, because expressed genes naturally take on a much wider distribution of values than unexpressed genes, naïve clustering of the xenograft-specific mouse estimates does not recover reasonable classifications, but rather identifies almost as many genes expressed as not, even though they have quite low expression values (see Supplementary Text (available at http://journals.cambridge.org/grh) for more details on the problems in clustering the gene expression estimates directly).
Our method first classifies all probe intensities in the original annotation as expressed/non-expressed using the same mixture model approach described in section 4(iv), the only difference being that we now use as input individual probe intensities and not a summary across samples (we use as input a random sample of 2 million probes). The distribution of probe intensities from the xenograft samples shows a clear distinction between expressed and non-expressed probes on both arrays (Supp. Fig. S15). However, the mixture-model from the probes is inappropriate for clustering gene expression estimates since it does not reflect the distribution of the gene expression values. Specifically, the mixture model creates an estimate of the prior probability of being in the expressed or non-expressed groups, as well as estimating the spread of the cluster around its mean. Both of these values would not be expected to be the same when considering gene expression estimates.
In order to use the probe-level information, we made the assumption that the mean value for the clusters found by the probe-level model is a good estimate of the mean of the expressed/non-expressed genes as well. We then fitted a gene-based mixture model, but constrained the mean estimates to be equal to those found in the probe-level mixture model. This means that we only estimated the standard deviations of the two clusters and the mixing proportion (see Supp. Fig. S16 for a comparison of the mixture models). For the human array, there is little difference in our approach and direct clustering of the gene estimates, but for the mouse array there is a big impact, with four times as many genes classified non-expressed as expressed (see the Supplementary Text for more comparisons of this method with direct clustering of gene expression estimates).
Using this mixture model, we can then find posterior probabilities for a gene to be from the expressed and non-expressed classes. We classify genes as expressed/non-expressed if their posterior probability is >0·80 of being in that class; otherwise we declare it uncertain.
(viii) Ingenuity pathway analysis
The differentially expressed genes under two-fold change and uncorrected significance of p=0·05 were submitted to Ingenuity Pathways Analysis®, and the first network was presented in Supp. Fig. S18.
We acknowledge Tarif Awad from Affymetrix® for providing the all Exon chips for this work, and critical advice on the study design. We thank David Bowtell and Richard Tothill for the human cancer samples, and Normand Pouliot, Kathryn Kinross and Belinda Parker for the mouse tumour samples. We acknowledge the Peter MacCallum microarray facility, for the performance of the microarrays. This work was funded by Congressionally Directed Medical Research Programme grants W81XWH-03-1-0630 and W81XWH-03-1-0318 (IH) and an NSF post-doctoral fellowship in biological informatics (EP).
5. Supplemental material
The online data can be found available at http://journals.cambridge.org/GRH


