


Introduction
For effective management of mammals within protected areas knowledge of which species are present, and their relative abundance and distribution, is essential (Sheng et al., Reference Sheng, Dajun, Xiaodong, William and McShea2010). Well-designed monitoring programmes can obtain such information and provide robust data to wildlife managers for long-term monitoring (Pereira & Cooper, Reference Pereira and Cooper2006; Marsh & Trenham, Reference Marsh and Trenham2008). Monitoring is usually of specific species, ignoring sympatric species that may also be of conservation concern. Information on such sympatric species is, however, important for effective management (Gibbs et al., Reference Gibbs, Snell and Causton1999). In the absence of species abundance information, conservation management decisions are often based on crude estimates, expert opinion or educated guesses, which may result in erroneous decisions that can be counterproductive for conservation (Blake & Hedges, Reference Blake and Hedges2004).
Large carnivores such as the tiger Panthera tigris, common leopard Panthera pardus and clouded leopard Neofelis nebulosa may be sympatric, serve as umbrella species across a wide range of habitats and are functionally vital components of the ecosystems in which they occur. Tigers prefer relatively undisturbed habitats, where they feed on large prey (Karanth & Sunquist, Reference Karanth and Sunquist1995). The common leopard, in contrast, occurs across a wider range of ecosystems and feeds opportunistically on a variety of prey species (Bailey, Reference Bailey1993), whereas clouded leopards inhabit densely-vegetated habitats and remote areas, and prefer small prey (Grassman et al., Reference Grassman, Tewes, Silvy and Kreetiyutanont2005).
Mark–recapture has long been used to estimate biological populations (Otis et al., Reference Otis, Burnham, White and Anderson1978). The method to estimate tiger populations using photographic capture–recapture analysis using camera traps was developed by Karanth (Reference Karanth1995) and Karanth & Nichols (Reference Karanth and Nichols1998) in Nagarhole, India, following which it has been widely used to estimate populations of the tiger (Karanth & Nichols, Reference Karanth and Nichols2000, Reference Karanth and Nichols2002; Karanth et al., Reference Karanth, Nichols, Kumar, Link and Hines2004; Jhala et al., Reference Jhala, Gopal and Qureshi2008, Reference Jhala, Qureshi, Gopal and Sinha2011; Harihar et al., Reference Harihar, Prasad, Ri, Pandav and Goyal2009b; Sharma et al., Reference Sharma, Jhala, Qureshi, Vattakaven, Gopal and Nayak2009) and common leopard (Chauhan et al., Reference Chauhan, Harihar, Goyal, Qureshi, Lal and Mathur2005; Edgaonkar, Reference Edgaonkar2008; Sankar et al., Reference Sankar, Qureshi, Mondal, Worah, Srivastava, Gupta and Basu2008; Harihar et al., Reference Harihar, Pandav and Goyal2009a) in the Indian subcontinent, and the tiger (O'Brien et al., Reference O'Brien, Kinnaird and Wibisono2003; Kawanishi & Sunquist, Reference Kawanishi and Sunquist2004; Linkie et al., Reference Linkie, Chapron, Martyr, Holden and Leader-Williams2006; Wang & Macdonald, Reference Wang and Macdonald2009; Wegge et al., Reference Wegge, Odd, Pokharel and Storaas2009) and common leopard in other countries (Balme et al., Reference Balme, Hunter and Slotow2007; Henschel, Reference Henschel2008; Khorozyan et al., Reference Khorozyan, Malkhasyan and Abramov2008; Gray & Prum, Reference Gray and Prum2012). Little is known, however, about the status and behaviour of the clouded leopard (Wilting et al., Reference Wilting, Fischer, Abu Bakar and Linsenmair2006). Grassman et al. (Reference Grassman, Tewes, Silvy and Kreetiyutanont2005) systematically surveyed a clouded leopard population but other available information on the ecology of the species is anecdotal (Banks, Reference Banks1931; Pocock, Reference Pocock1939), based on local information (Rabinowitz et al., Reference Rabinowitz, Andau and Chai1987; Rabinowitz, Reference Rabinowitz1988) and sighting reports (Davies, Reference Davies1990; Ghose, Reference Ghose2002). The clouded leopard has been reported in India from the north-eastern states of Assam, Meghalaya, Arunachal Pradesh, Tripura, Mizoram, Sikkim and northern parts of West Bengal (Katti et al., Reference Katti, Manrekar, Mukherjee and Sharma1990; Choudhury, Reference Choudhury1993; Ghose, Reference Ghose2002; Borah et al., Reference Borah, Sharma, Lyngdoh and Tapi2010). A study of the Sunda clouded leopard Neofelis diardi using capture–recapture models has been carried out in Sabah, Malaysia (Wilting et al., Reference Wilting, Fischer, Abu Bakar and Linsenmair2006) and densities have been estimated from the same area (Brodie & Giordano, Reference Brodie and Giordano2012; Wilting et al., Reference Wilting, Mohamed, Ambu, Mannan, Hofer and Sollmann2012).
A camera-trapping study to determine the relative abundance of tigers and their prey in Manas National Park (Jhala et al., Reference Jhala, Qureshi, Gopal and Sinha2011; J. Borah et al., unpubl. data) also provided data on the occurrence of other large felids. Here we use these data to estimate the abundance and density of the common and clouded leopards, and establish baseline data for long-term monitoring programmes and for conservation planning in the Park. The camera trapping was conducted as a part of the All India Tiger Estimation programme of the Government of India in collaboration with the National Tiger Conservation Authority, Wildlife Institute of India and Assam Forest Department, and involved WWF–India, the Ashoka Trust for Research in Ecology and Environment, and Aaranyak as collaborative partners.
Study area
The 500 km2 Manas National Park in the state of Assam, India, lies on the borders of the Indo–Gangetic and Indo–Malayan biogeographical realms. It lies on a gentle alluvial slope in the foothills of the Himalayas, where wooded hills give way to grasslands and tropical forest, and is home to a variety of important mammal species, including the tiger, pygmy hog Porcula salvania, hispid hare Caprolagus hispidus and Asian elephant Elephas maximus. The Park supports 22 of India's most threatened mammal species, as listed in Schedule-I of the Wildlife (Protection) Act of India (Deb Roy, Reference Deb Roy1991). Together with the Royal Manas National Park in Bhutan, the Park forms one of the largest areas for tiger conservation in South Asia, representing the full range of habitats from the subtropical plains to the alpine zone (Wang, Reference Wang2001).
Methods
Camera trapping
We put camera traps (Cuddleback, Non Typical Inc., Wisconsin, USA; Trailmaster, Goodson & Associates, Kansas, USA; Panthera Camera Trap V3, Panthera, USA; CEDT, Indian Institute of Science, Bangalore, India) in 75 locations covering c. 300 km2 across two ranges of the Manas National Park (Fig. 1) from November 2010 to February 2011. A pair of camera traps were placed in a 2 × 2 km cell; the distance between each camera location was 1.75–2.15 km. The camera traps were deployed in the best possible locations in each grid cell to ensure coverage of the entire sampling area and thus satisfy the assumption that no animal had a zero probability of being photographed. The survey was thus designed to cover the study area homogeneously, to maximize the chance of photographing all animals present in the area (Karanth & Nichols, Reference Karanth and Nichols1998). Most of the camera traps were positioned on paths or animal trails, based on a sign survey carried out prior to camera trapping, to maximize the chances of photographing carnivores. The time delay between photographs was set to minimize the possibility of missing any animals. All cameras were operational for 24 hours per day for 57 days, except in cases of malfunction, or damage caused by elephants. Each day was defined as a sampling occasion (Otis et al., Reference Otis, Burnham, White and Anderson1978). Fifty-seven days was adequate for assuming demographic closure (Otis et al., Reference Otis, Burnham, White and Anderson1978) of the study population as previous studies of large felids have indicated that trapping periods of 2–3 months ensure that no population change occurs during a study (Karanth, Reference Karanth1995; Karanth & Nichols, Reference Karanth and Nichols1998; Silver et al., Reference Silver, Ostro, Marsh, Maffei, Noss and Kelly2004). All camera units were mounted on trees, on poles or in steel cages, 3–4 m on either side of a path or trail, with the sensor 20–40 cm from the ground, and were checked daily. Although the same camera locations were generally maintained throughout the study, we moved the cameras by 100–200 m from the original location whenever signs of trap shyness were observed. We identified individual common leopards by the spot pattern of their pelage and clouded leopards by their distinctive cloud-like pelage pattern.

Fig. 1 Camera-trap locations in Manas National Park, indicating those at which tiger Panthera tigris, leopard Panthera pardus and clouded leopard Neofelis nebulosa were photo-captured. The shaded rectangle on the inset indicates the location of the main map in north-east India.
Abundance estimation
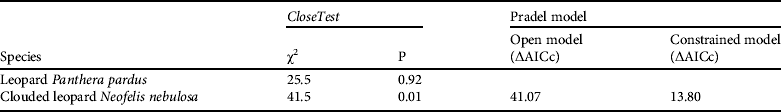
We developed individual capture histories for common and clouded leopards in a standard X matrix (Otis et al., Reference Otis, Burnham, White and Anderson1978; Nichols, Reference Nichols1992). These were analysed, using models developed for closed populations, in CAPTURE (Rexstad & Burnham, Reference Rexstad and Burnham1991) and MARK (White, Reference White2008). We assumed that the sampled population was demographically closed, as common and clouded leopards are long-lived animals (Otis et al., Reference Otis, Burnham, White and Anderson1978; Smith, Reference Smith1993; Karanth, Reference Karanth1995; Srivastav & Nigam, Reference Srivastav and Nigam2009) and our sampling period was relatively short. We formally tested for population closure using CloseTest (Stanley & Burnham, Reference Stanley and Burnham1999) and open Pradel models implemented in MARK. In the Pradel models we compared the Akaike information criteria corrected for small sample size (AICc) scores between a model in which recruitment and survival were constrained to 0 and 1, respectively (representing population closure), and an open model in which these parameters were estimated based on observed data. The parameters recruitment and survival correspond to immigration and fidelity, respectively, assuming a population is demographically closed (Boulanger & McLellan, Reference Boulanger and Mclellan2001; Harihar et al., Reference Harihar, Pandav and Goyal2009a).
The jackknife estimator (Otis et al., Reference Otis, Burnham, White and Anderson1978) has been used in photographic-capture studies (Karanth, Reference Karanth1995; Karanth & Nichols, Reference Karanth and Nichols1998; Karanth et al., Reference Karanth, Nichols, Kumar, Link and Hines2004; Maffei et al., Reference Maffei, Cuellar and Noss2004; Simcharoen et al., Reference Simcharoen, Pattanvibool, Karanth, Nichols and Sambar Kumar2007; Wang & Macdonald, Reference Wang and Macdonald2009) to estimate capture probabilities and population size. We generated parameter estimates under the M h model, which was the best-fit model for our data, in CAPTURE. We also used closed population Pledger models (Pledger, Reference Pledger2000) in MARK, where heterogeneity is handled using a finite number of mixtures. Compared to simpler models in CAPTURE, Pledger models are able to deal better with heterogeneity in capture probabilities (Boulanger et al., Reference Boulanger, White, Mclellan, Woods, Proctor and Himmer2002). We ran the null model with all capture and recapture probabilities equal (M o), the heterogeneity model with two mixtures of identical capture and recapture probabilities (M h), the behavioural model with different capture and recapture probabilities (M b) and the behaviour and heterogeneity model with two mixtures of capture and recapture probabilities and a behavioural response (M bh). We model-averaged abundance estimates (Burnham & Anderson, Reference Burnham and Anderson2002), using AICc, across the models.
Density estimation
We estimated common and clouded leopard densities by dividing the population size based on our abundance estimates with the effective sampled area. The effective sampled area was computed following the approach developed by Wilson & Anderson (Reference Wilson and Anderson1985), using half the mean of maximum distance moved (HMMDM) method, in which a buffer of HMMDM for all individuals captured at more than one camera-trap location is added to the trapping grid polygon (Karanth & Nichols, Reference Karanth and Nichols1998). We also obtained density estimates using full maximum likelihood spatially-explicit capture–recapture using DENSITY v. 4.4 (Efford, Reference Efford2009), which did not rely upon closed population estimates from CAPTURE or MARK. The buffer width around the trapping grid was set to 10 km and we assumed a half-normal spatial capture probability function and a Poisson distribution of home-range centres for estimating density.
Results
We photo captured 27 individually identified common leopards (11 males, 13 females and three unidentified) and 16 individually identified clouded leopards (four males, five females and seven unidentified) during the total of 4,275 camera-trap nights. Capture frequencies were 1–8 for common leopards and 1–7 for clouded leopards. CloseTest supported the assumption of population closure for the 57-day sampling period for common leopards but not for clouded leopards (Table 1). However, in MARK, the open Pradel model estimated survivorship (θ) to be 0.96 ± SE 0.01 and recruitment (f) to be 0.06 ± SE 0.01) for the clouded leopard population. The constrained Pradel model, in which θ was set at 1.0 and f at 0.0 (the closed model), was better supported than the open model (Table 1). The clouded leopard population was therefore considered closed and analysis was done using a closed capture–recapture framework.
Table 1 The results of tests of population closure using CloseTest and open Pradel models (see text for further details) for camera-trap data of the common leopard Panthera pardus and clouded leopard Neofelis nebulosa in Manas National Park, Assam, India (Fig. 1).
Abundance
For the common leopard, tests for heterogeneity in trapping probabilities (χ2 = 9.42, df = 1, P = 0.009) and the affect of a behavioural response (χ2 = 7.11, df = 1, P = 0.007) supported the suitability of these models in CAPTURE. The overall model selection test ranked M
h (incorporating individual heterogeneity in capture probabilities) as the best model (Criteria rated 1). The probability of detecting an individual on at least one sampling occasion (mean ![]() ) was 0.01. The population estimate using M
h with the jackknife estimator was 47.00 ± SE 11.30. Using MARK the estimates of abundance were 27–35 (± SE 5.60). The Pledger model M
h was the most strongly supported, based on AICc, with a model-averaged estimate of common leopard abundance of 35.60 ± SE 5.50. Model-averaged initial capture probability was 0.02 ± SE 0.06 and recapture probability 0.11 ± SE 0.02.
) was 0.01. The population estimate using M
h with the jackknife estimator was 47.00 ± SE 11.30. Using MARK the estimates of abundance were 27–35 (± SE 5.60). The Pledger model M
h was the most strongly supported, based on AICc, with a model-averaged estimate of common leopard abundance of 35.60 ± SE 5.50. Model-averaged initial capture probability was 0.02 ± SE 0.06 and recapture probability 0.11 ± SE 0.02.
For the clouded leopard the overall model selection test ranked M h as the best model, using CAPTURE. The probability of detecting an individual on at least one sampling occasion was 0.02. The population estimate using M h with the jackknife estimator was 21.00 ± SE 6.60. Using MARK the estimates of abundance were 16–25 (± SE 6.90). The Pledger model M h was the most strongly supported, based on AICc score, with a model-averaged clouded leopard abundance estimate of 25.03 ± SE 6.80. Model-averaged initial capture probability was 0.02 ± SE 0.006 and recapture probability 0.12 ± SE 0.03.
Density
For the common leopard the maximum distance moved by recaptured individuals between captures was 1.6–13.1 km (mean 3.4 ± SE 1.9). Based on HMMDM the total sampling area was estimated to be 414.2 ± SE 36.3 km2. Density estimates based on model M h (jackknife), using CAPTURE, were 11.30 ± SE 2.90 per 100 km2, and 8.40 ± SE 1.40 per 100 km2 based on model-averaged abundance estimates using MARK. In spatially-explicit capture–recapture analysis using DENSITY, density was estimated to be 3.40 ± SE 0.82 per 100 km2. Capture probability at home-range centre (g o) was estimated to be 0.54 ± SE 0.13 and σ (a function of movement) was 4,210 ± SE 489 m.
For the clouded leopard the maximum distance moved by recaptured individuals between captures was 2.0–13.6 km (mean 2.5 ± SE 1.6 km). Based on HMMDM the total sampling area was estimated to be 382.6 ± SE 35.2 km2. Density estimates based on model M h (jackknife), using CAPTURE, were 5.50 ± SE 1.80 per 100 km2, and 6.53 ± SE 1.88 per 100 km2 based on model-averaged abundance estimates using MARK. Based on spatially-explicit capture–recapture analysis using DENSITY, density was estimated to be 4.73 ± SE 1.43 per 100 km2. Capture probability at home-range centre (g o) was estimated to be 0.86 ± SE 0.34 and σ was 1,602 ± SE 246 m.
Discussion
Our results provide the first reliable abundance and density estimates for the clouded leopard in Manas National Park, and India, and baseline estimates for the common leopard in the Park. We estimated density using several approaches but the estimates were bounded by wide confidence intervals, as in the studies of the Sunda clouded leopard (Brodie & Giordano, Reference Brodie and Giordano2012; Wilting et al., Reference Wilting, Mohamed, Ambu, Mannan, Hofer and Sollmann2012). The broad confidence intervals are probably because of the low number of recaptures of both common and clouded leopards, and highlight the fact that when using camera traps for surveying rare elusive large carnivores, maximizing both individual capture and recapture probabilities, and the sample size, are important (Gray & Prum, Reference Gray and Prum2012). As our study was specifically designed to maximize the photographic-capture of tigers we believe that increasing the density of camera traps, and a reduced grid size, would maximize individual capture and recapture probabilities for common and clouded leopards.
The density of the common leopard has been reported to be 1.0–25.5 per 100 km2 in the Indian subcontinent (Ramesh, Reference Ramesh2010) and that of the clouded leopard in South-east Asia has been reported to be 9–25 per 100 km2 (Wilting et al., Reference Wilting, Fischer, Abu Bakar and Linsenmair2006) and 0.8–1.9 per 100 km2 (Brodie & Giordano, Reference Brodie and Giordano2012; Wilting et al., Reference Wilting, Mohamed, Ambu, Mannan, Hofer and Sollmann2012). Our density estimate for the common leopard in Manas National Park is thus comparable to estimates from elsewhere. In the same survey the density of the tiger was estimated to be 1.8 ± SE 1.1 and 0.8 ± SE 0.3 based on HMMDM and maximum likelihood spatially-explicit capture–recapture, respectively (Jhala et al., Reference Jhala, Qureshi, Gopal and Sinha2011). Manas National Park is recuperating from the aftermath of ethnic violence but, with recent support from Government agencies, including the forest department, and involvement of various NGOs and local communities, wildlife populations, including those of carnivores, are now showing signs of recovery (Boojh et al., Reference Boojh, Mainka and Van Merm2011). The low densities of the common and clouded leopards could be attributed to the presence of other predators, including tigers and dholes Cuon alpinus. The influence of competitive interactions between sympatric carnivores on their abundance and distribution is well known (Linnell & Strand, Reference Linnell and Strand2000). We recommend that future studies in Manas National Park examine intra-guild competition among these top predators.
Photographic capture–recapture analysis has been used previously for estimating individually identifiable cryptic animals such as tigers (Karanth & Nichols, Reference Karanth and Nichols1998, Reference Karanth and Nichols2000, Reference Karanth and Nichols2002; Karanth et al. Reference Karanth, Nichols, Kumar, Link and Hines2004) and common leopards (Chauhan et al., Reference Chauhan, Harihar, Goyal, Qureshi, Lal and Mathur2005; Edgaonkar, Reference Edgaonkar2008; Sankar et al., Reference Sankar, Qureshi, Mondal, Worah, Srivastava, Gupta and Basu2008; Harihar et al., Reference Harihar, Pandav and Goyal2009a). We recommend exploring data using models in which individual covariates can be included to determine factors affecting capture and recapture probabilities. Estimating densities from abundance estimates in closed population capture–recapture models is largely based on observed animal movements (Borchers & Efford, Reference Borchers and Efford2008; Karanth & Nichols, Reference Karanth, Nichols, Tilson and Nyhus2010). The best approach is to use the spatial capture histories of camera traps in a likelihood-based density estimation framework (Borchers & Efford, Reference Borchers and Efford2008; Efford et al., Reference Efford, Dawson and Borchers2009). As this method does not require the addition of a buffer to the trapping polygon for estimating effective trapping area, the resultant estimates are less biased by trap layout and density (Efford, Reference Efford2004).
For monitoring the success of conservation activities baseline estimates of abundance and density are critical. However, low sample size and low probabilities of capture and recapture may lead to uncertainty, particularly when monitoring large rare carnivores such as tigers and common and clouded leopards. Data on intra-guild relations among sympatric carnivores are therefore essential for planning conservation interventions (Bangs & Fritts, Reference Bangs and Fritts1996). Our research has provided evidence that in Manas National Park tigers and other carnivores have survived a decade of social turmoil in the region. Previous studies of sympatric large carnivores have examined behavioural factors and patterns of prey selection to infer the mechanisms facilitating coexistence (Karanth & Sunquist, Reference Karanth and Sunquist1995, Reference Karanth and Nichols2000; Wang & Macdonald, Reference Wang and Macdonald2009; Wegge et al., Reference Wegge, Odd, Pokharel and Storaas2009; Harihar et al., Reference Harihar, Pandav and Goyal2011). Similar studies in Manas National Park would facilitate a better understanding of the ecology of the large carnivore assemblage. Although there has been considerable conservation investment in recovering tiger populations (Walston et al., Reference Walston, Robinson, Bennett, Breitenmoser, da Fonseca and Goodrich2010), such efforts rarely take into account the possible cascading effects on sympatric carnivores such as the common and clouded leopard.
Our study has provided baseline density estimates for the common and clouded leopards in Manas National Park, and annual population monitoring is now being carried out to examine the population dynamics and trends of these species and the sympatric tiger. The densities of prey species are also being estimated. Future research and conservation initiatives will be able to use these baselines for management planning.
Acknowledgements
We thank the Principal Chief Conservator of Forest (Wildlife) & Chief Wildlife Warden, and Chief Conservator of Forest (Wildlife), Department of Environment and Forests, Government of Assam for their support, and Mr A. Swargowari, Field Director, and Mr C. Bhobora, Divisional Forest Officer, Manas National Park, for facilitating the fieldwork. We acknowledge the support provided by Range Officers P. K. Brahma and L. Ramchiary, and are grateful to the following persons for assisting in the field: D. Dutta, S. Basumatari, M. Kalita, R. Khan, J. Ali, Y. Khan, B. Nath, U. Deka, B. Roy, T. Barman, M. Rabha, A. Hussain, B. Sinha, K. Azad and B. P. Lahkar. We thank Ms Sonali Ghosh, Institute of Geography and Earth Sciences, Aberystwyth University, for drafting Fig. 1.
Biographical sketches
Jimmy Borah is interested in understanding the population dynamics of large carnivores and in studying human–carnivore conflicts at the landscape level. Tridip Sharma is interested in studying animals using camera traps. Dhritiman Das's primary research interests are in ecosystem ecology and interdisciplinary approaches to biodiversity conservation. Nilmani Rabha's research interests include large mammal biology and carnivore ecology. Niraj Kakati is interested in environmental policy and governance, protected area management and the sustainability of conservation. Ajit Basumatary is interested in the study of tigers using photographic capture–recapture. Firoz Ahmed has researched amphibians and reptiles in north-east India and contributed to the discovery of at least 10 new species of Amphibia. Currently he is coordinating tiger conservation and research for the NGO Aaranyak. Joseph Vattakaven has been studying the ecology of large carnivores in various landscapes and is particularly interested in the ecology of tigers.


