


Introduction
Local governments are responsible for the practical implementation of many European Union (EU) policies. The Urban Waste Water Treatment Directive (91/271/EEC), the Environmental Noise Directive (2002/49/EC) and the Ambient Air Quality Directive (2008/50/EC) are just a few examples of EU policies affecting local governance. While the European Commission initiates this legislation, it has little enforcement capacity on its own and has to rely on the member states and their constitutive levels of government to ensure that this legislation is put into practice. This begs a classic question regarding to what extent Brussel’s expectations are dashed locally (cf Pressman and Wildavsky, Reference Pressman and Wildavsky1984). Yet, the EU compliance literature has paid little systematic attention to the local implementation of EU policies (Treib, Reference Treib2014; Versluis, Reference Versluis2007). This lack of systematic attention is surprising as analysis of local implementation is instrumental to understanding how member states make EU policies work (Thomann and Sager, Reference Thomann and Sager2017).
Recent studies on the local implementation of the EU Ambient Air Quality Directive 2008/50/EC (AAQ) in the Netherlands revealed that there is great variation in policy responses at the local level (Bondarouk and Liefferink, Reference Bondarouk and Liefferink2017; but also see a description of German local implementation variation - Gollata and Newig, Reference Gollata and Newig2017). Besides setting minimum procedural obligations, like drawing up a management plan, monitoring air pollution and informing the public on the state of pollution, the directive leaves it up to the implementers how to go about it (Bondarouk and Liefferink, Reference Bondarouk and Liefferink2017; Gollata and Newig, Reference Gollata and Newig2017). While faced with the same regulatory pressure, some Dutch municipalities took more extensive measures than others (Bondarouk and Liefferink, Reference Bondarouk and Liefferink2017). Accordingly, a pattern of local pioneers and laggards – those who do more and those who do less – emerges (Lee and Koski, Reference Lee and Koski2012; Liefferink et al., Reference Liefferink, Arts, Kamstra and Ooijevaar2009; Liefferink and Wurzel, Reference Liefferink and Wurzel2016; Urpelainen, Reference Urpelainen2009). The local differences in air quality policy efforts are even more surprising considering that the Dutch national government reserved 372 million euros for local air quality measures. All municipalities were invited to stake a claim to these subsidies. In light of the same regulatory pressure and available financial resources, the question arises – how can these differences in local implementation of EU AAQ policy be explained?
EU compliance research has shown that national differences in compliance at the transposition level – the level where EU legislation is transposed into national law – can be largely explained by domestic politics (Mastenbroek and Kaeding, Reference Mastenbroek and Kaeding2006; Treib, Reference Treib2014). Whether this politicisation of EU policies can also account for differences in local implementation is yet to be determined (Treib, Reference Treib2014). Alternatively, the management approach in EU compliance research views implementation as a matter of managerial capacity and the way policy implementation is organised (Walker and Andrews, Reference Walker and Andrews2013).
While both explanatory approaches have merit, it is important to understand which of the two approaches drives different local responses to EU policy. If political explanations outweigh managerial ones, the remedy for nonimplementation is fundamentally different. Where the political approach assumes that strict enforcement mechanisms can remedy nonimplementation, the management approach advocates for capacity-building strategies (see Tallberg, Reference Tallberg2002). If one sets out to improve local implementation of EU directives, we first need to understand which of the two approaches drives different local responses to EU policy. Hence, in this paper we address the following research question: to what extent can differences in Dutch local implementation of an EU directive be attributed to politicization or managerial considerations?
This study offers an empirical and theoretical contribution to the literature. Empirically, by putting local government at the centre of this research we address the empirical gap in EU compliance literature (Thomann and Sager, Reference Thomann and Sager2017; Treib, Reference Treib2014). Furthermore, compared to the Water Framework Directive, the AAQ directive has received less scholarly attention (for an overview see Bondarouk and Mastenbroek, Reference Bondarouk and Mastenbroek2018).
When it comes to theoretical contributions, by examining whether the explanatory variables identified for the variation in national compliance with EU policies also hold in the local context we explore the strength of implementation theory (see Saetren, Reference Saetren2014: 86; Winter, Reference Winter2012: 265). In addition, so far both managerial and political explanations have been analysed mainly regarding the timeliness of EU national implementation, i.e. whether EU legislation has been translated into national law according to EU deadlines (see for an overview Treib, Reference Treib2014). Alternatively, we focus on the content of policy implementation, i.e. the policy measures that local government have taken in light of the AAQ directive. Thus, we enrich our understanding of the explanatory variables by examining them in a different conceptual context. By employing a theory-driven process tracing over a period of 10 years of local implementation in several Dutch municipalities, we identify the sequence of explanatory variables. We thus illustrate how the variables interact and affect implementation performance.
In analysing the antecedents of EU implementation performance, this study focuses on the local implementation of the EU AAQ Directive in the Netherlands. Bondarouk and Liefferink (Reference Bondarouk and Liefferink2017) provide a database of Dutch local AAQ policy output. Following a distribution-based most diverse case selection on the dependent variable (Rohlfing, Reference Rohlfing2012), we selected the two highest and two lowest scoring municipalities from the database developed by Bondarouk and Liefferink (Reference Bondarouk and Liefferink2017). The selection on the dependent variable is driven by our interest in what explains different outcomes on the dependent variable, in this case implementation performance. A selection of only medium-sized municipalities offers a focused comparison, as they form a rather homogeneous group with similar air pollution sources, i.e. traffic, making them an almost ideal sample for horizontal comparison. These Dutch municipalities enjoyed equal access to the national subsidies for AAQ measures and experienced the same amount of steering from the national government.
The next section sets out our conceptualisation of the dependent variable – implementation performance. Afterwards, our expectations are outlined with regard to political and management explanations. We address the case selection, operationalisation and analysis techniques in full detail in the following section; give short descriptions of the four cases before moving on to findings and conclusions.
Delving into political and management theoretical approaches
Before we delve into the differences between political and management approaches, we first need to address the conceptualisation of local implementation performance. Local implementation of EU policies refers to the stage where local governments put EU law into practice – ‘translate policy into action’ (Barrett, 2004: 251). The way local governments perform during local implementation can be understood in terms of policy outputs – i.e. the regulatory actions taken in response to law – or in terms of policy outcomes or impact – i.e. the question of whether a policy indeed resolved the problem it set out to solve (for literature review see Bondarouk and Mastenbroek, Reference Bondarouk and Mastenbroek2018: 17; Knill et al., Reference Knill, Schulze and Tosun2012; Tosun, 2012).
An evaluation of EU policy impact is extremely challenging, due to the fact that an isolation of the EU effect is practically impossible (Bauer and Knill, Reference Bauer and Knill2014; Haverland, 2006; Tosun, 2012). Hence, one quickly faces ‘construct validity concerns’ when one tries to causally link EU policy with actual local state of environmental pollution (Tosun, 2012: 442–444). Instead, a growing number of scholars have suggested focusing on policy outputs in order to assess more directly what the implementing actors do to mitigate the policy problem (Bondarouk and Mastenbroek, Reference Bondarouk and Mastenbroek2018; Knill et al., Reference Knill, Schulze and Tosun2012; Liefferink et al., Reference Liefferink, Arts, Kamstra and Ooijevaar2009; Tosun, 2012). As in this paper, we are interested in the differences between local policies in response to an EU directive, we follow Bondarouk and Mastenbroek (Reference Bondarouk and Mastenbroek2018) and conceptualise implementation performance in terms of policy outputs.
An assessment of policy outputs presupposes a firm understanding of policy measures: the techniques by which authorities attempt to change or maintain the policy status quo (Howlett et al., 2009; May, 2003: 225; Schaffrin et al., 2015). These measures are then examined on the content, i.e. the breadth and differentiation of policy responses (Bauer and Knill, Reference Bauer and Knill2014: 33; Knill et al., Reference Knill, Schulze and Tosun2012). Hence, we define implementation performance as the comprehensiveness of policy outputs undertaken by local implementers in response to the EU AAQ policy obligation. Thus we are interested in explaining why local policy output in one municipality is more elaborate than in another.
The political and management approaches to explaining implementation performance have two different points of departure: respectively the willingness and the ability to implement (for an extensive literature review, see Hill and Hupe, Reference Hill and Hupe2014). The political approach stresses the importance of political will to implement policies. Politics determine the allocation of values and the distribution of benefits and costs (Kingdon, Reference Kingdon2014: 145). Therefore, implementation performance is seen to reflect a deliberate choice. National policy makers, in response, can remedy low implementation performance by strict and coercive enforcement (Tallberg, Reference Tallberg2002).
The management approach, by contrast, assumes that implementation is not a matter of calculated willingness, but of implementers’ capacity to do so (Tallberg, Reference Tallberg2002; Treib, Reference Treib2014; O’Toole and Meier, Reference O’Toole and Meier2010). Sound management has been argued to make a significant difference to policy implementation (see for an overview Meier et al., Reference Meier, O’Toole, Boyne and Walker2007: 369; O’Toole and Meier, Reference O’Toole and Meier2009: 499). Low implementation performance is then attributed to implementers’ ability to implement, rather than their willingness to do so. Based on these assumptions, implementation can be improved by investing in capacity building (see Tallberg, Reference Tallberg2002).
In the remainder of this section, we present the political and managerial variables to account for variance in implementation performance. However, we do not claim to list all potential variables – ‘as has been widely recognised dozens of variables are relevant to implementation action’ (O’Toole, 2017: 377). We specifically focus on a few variables, which we would like to subject to empirical investigation. For both approaches, the variables were selected that have been repeatedly identified in different literature reviews as being correlated with comprehensive implementation performance. Such focused theory testing is embedded in the current ‘third generation implementation research’ (for an overview see Hupe and Saetren, 2015; Saetren, Reference Saetren2014). Instead of trying to be as complete as possible in theoretical frameworks, the third generation implementation scholars call for ‘testing partial theories and hypotheses’ that have been repeatedly identified as being correlated with comprehensive implementation in order to strengthen implementation theory, which for too long has been of an explorative or descriptive nature (Winter, Reference Winter2012: 265; see for literature reviews Bondarouk, Reference Bondarouk2017; Hupe and Saetren, 2015; Saetren, Reference Saetren2014).
Next to this multiplicity of explanatory variables, implementation research is also characterised by equifinality of explanatory variables (e.g. Toshkov, Reference Toshkov2011; Treib, Reference Treib2014; Winter, Reference Winter2012). For this reason, we expect that several explanatory variables together would form a potential explanation for the variance in implementation performance. As the literature does not provide guidance on the relationship between the variables, we do not a priori hypothesise any relationship between different variables. However, the comparative process tracing in the analysis allows us to distil the causal mechanism, illustrating how different variables are interrelated (see Benett and Checkel, 2014).
The political approach
The political approach is disentangled into four specific explanations: policy preferences, policy saliency, interest group pressure and policy entrepreneurship (Kingdon, Reference Kingdon2014; Lee and Koski, Reference Lee and Koski2012; Saetren, Reference Saetren2014: 100; Versluis, Reference Versluis2007).
Policy preferences
At the municipal level, the local preferences regarding air quality policy, i.e. policy positions, of key players are assumed to determine policy formulation and implementation (Kingdon Reference Kingdon2014; Henstra, Reference Henstra2010; May and Winter, Reference May and Winter2009). In the Netherlands, key local players are the local council, the college of aldermen and the local policy officers, as they are responsible for implementing policies. As they all have different policy purviews they are likely to have diverging preferences when it comes to AAQ. For instance, a policy officer responsible for the mobility of public and private transit might prioritise the speed of the traffic flow over concerns about air pollution. There are many possible differences when it comes to actors’ preferences. We argue that there are two types of differences in policy preferences that are important for implementation performance on AAQ.
First, AAQ policy preferences of the implementing officials tasked with implementation of environmental policies, including AAQ, might be more or less ambitious than the goals set out in the EU policy. The AAQ directive determines minimum levels of air pollution, but member states and local governments are allowed to set stricter norms. For instance, the World Health Organization sets stricter norms than the EU policy (Bondarouk and Liefferink, Reference Bondarouk and Liefferink2017). Local governments are also allowed to set a stricter deadline, for example the desired level of pollution should be met earlier than the deadline prescribed in the directive. Alternatively, local governments could be less ambitious and not adhere to the deadlines or only do a bare minimum to meet the obligation of having an AAQ policy plan in place. The reason for this could be that the implementing officers give precedence to other objectives, for instance car mobility, than AAQ policy objectives. The difference in policy preferences of implementing bodies and the prescribed EU objectives is crucial for explaining noncompliance at national level (see for a vast literature overview Treib, Reference Treib2014; Angelova et al., 2012). Following the same logic, the difference between what standards local governments prefer and what the EU asks for may therefore influence how comprehensive implementation performance will be on the ground.
Second, implementing officials may hold diverging AAQ preferences among themselves (Henstra, Reference Henstra2010; Kingdon, Reference Kingdon2014: 81; Lee and Koski, Reference Lee and Koski2012; May and Winter, Reference May and Winter2009; Robichau and Lynn, Reference Robichau and Lynn2009; Walker and Andrews, Reference Walker and Andrews2013). This means that some implementing officials may be in favour of prioritizing stricter AAQ policy than the EU calls for, while others may be concerned with its impact on other policies, like public and private transit policy, and advocate a more lenient AAQ policy. Before implementing any measures, the officials will then have to deliberate and reach consensus on what AAQ policy goals and measures are appropriate and acceptable to everyone. As this consensus building is likely to be difficult and time-consuming, they will be able to agree on fewer measures in the case of stark policy preference differences than in the case where differences in AAQ policy preferences are absent or easily overcome (see Andrews et al., Reference Andrews, Boyne, Meier, O’Toole and Walker2012: 81). Hence, if the differences on AAQ policy preferences between key players are too pronounced, implementation performance will suffer as actors will not be able to agree on as many policy measures. Hence, policy output will be lower. Where the policy preferences are aligned but not ambitious, it is unlikely that implementation performance will benefit from it.
Therefore, we expect that higher implementation performance on AAQ policy is associated with more ambitious policy preferences than the EU policy calls for, and these policy preferences have to be approximately equally ambitious and shared among the key local players.
Policy saliency
Although policy saliency is strongly associated with policy preferences, it is ‘conceptually and empirically distinct from actors’ policy positions’ (Thomson, Reference Thomson2011: 47). Policy saliency concerns the importance actors attach to a particular issue. It is possible that stakeholders attach a high level of importance to an issue on which they take a moderate position, and a low level of saliency to an issue on which they take an extreme position (Thomson et al., Reference Thomson, Arregui, Leuffen, Costello, Cross, Hertz and Jensen2012: 613).
Given the enormous amount of national policy implementation tasks combined with limited resources, local actors pick and choose where to focus their attention (Lipsky, Reference Lipsky1980). The level of attention and effort paid to implementation will depend on the importance local implementers attach to that specific policy (Spendzharova and Versluis, Reference Spendzharova and Versluis2013; Thomann Reference Thomann2015; Treib, Reference Treib2014). High relative importance of a policy issue positively impacts local implementers’ prioritisation and will be reflected in the implementation performance. However, where policy saliency is high but implementers do not support EU policy, policy saliency is unlikely to positively impact implementation performance.
Therefore we expect that higher implementation performance on AAQ policy is associated with higher levels of AAQ saliency among local implementers in cases where these implementers are (at least) supportive of EU AAQ policy goals.
Interest group pressure
Interest groups may target a policy issue and advocate a specific set of measures, thus creating an incentive for policy implementers to act (see Binder and Neumayer, Reference Binder and Neumayer2005; Cheon and Urpelainen, Reference Cheon and Urpelainen2013; Henstra, Reference Henstra2010; Kingdon, Reference Kingdon2014; Spendzharova and Versluis, Reference Spendzharova and Versluis2013; Thomson et al., Reference Thomson, Arregui, Leuffen, Costello, Cross, Hertz and Jensen2012; Warntjen, Reference Warntjen2012). Several EU compliance studies looking at the national level of EU policy implementation have shown that groups whose members profit from a particular EU policy will try to influence policy implementation by means of, for instance, lobbying or public shaming (see Treib, Reference Treib2014 for an overview).
In the same vein one could argue that local interest groups would try to exert influence on the AAQ local policy. At the municipal level such locally organised advocacy represents direct ties to local constituencies (Henstra, Reference Henstra2010). Spendzharova and Versluis (Reference Spendzharova and Versluis2013: 1504) show that ‘when an issue receives a lot of political and social attention, there is an extra effort to do things right’ and to take policy measures that reflect stakeholders’ preferences. Hence, local interest groups, such as environmental organisations, health organisations or other civil society organisations, may raise the stakes for local implementers to make an effort in implementing AAQ policy, while other interest groups would like to see a less strict AAQ policy (Lee and Koski, Reference Lee and Koski2012).
The composition of an interest group constellation at a local level plays an important role in determining how extensive AAQ policy will be. Local interest groups may differ in their position on how comprehensive the AAQ policy should be. Cheon and Urpeilanen (Reference Cheon and Urpelainen2013) point out that supporters of ambitious renewable electricity policy plans are decisive in the absence of opposition (see also Binder and Neumayer, Reference Binder and Neumayer2005), but the positive effect diminishes with the strength of opposition. Hence, if there is a balance of powers between the proponents and the opponents, implementation performance is likely to be less comprehensive when compared to a situation where supporters of AAQ policy dominate in the city. If opposition to AAQ measures is strong it is also likely to negatively impact the AAQ policy output. In such a case, the AAQ policy would be quite minimal and symbolic in nature.
Therefore, we expect that higher implementation performance on AAQ policy is associated with environmental, health and civil society organizations who are predominantly supportive of EU AAQ policy goals.
Policy entrepreneurship
The final political variable, policy entrepreneurship, is not bound to individuals within the local administration and can be found anywhere (Kingdon, Reference Kingdon2014; Meijerink and Huitema, Reference Meijerink and Huitema2010). The main characteristic of policy entrepreneurs is their willingness “to invest their resources-time, energy, reputation, and sometimes money in pushing their proposals or problems, […] prompting important people to pay attention, coupling solutions to problems and coupling both problems and solutions to politics” (Kingdon, Reference Kingdon2014: 122). Sabatier and Mazmanian (Reference Sabatier and Mazmanian1980: 553) pointed to the importance of “commitment of supportive implementing officials” in affecting policy outputs by going beyond “what could reasonably be expected in using the available resources”. These individuals are able to balance advocacy and brokerage strategies to achieve their goals and know exactly how to operate the administrative apparatus and mobilise group efforts (Gabris et al., Reference Gabris, Golembiewski and Ihrke2001; Meijerink and Huitema, Reference Meijerink and Huitema2010). Policy entrepreneurs are always on the lookout for new policy opportunities, are innovative and risk-taking (see Andrews et al., Reference Andrews, Boyne, Meier, O’Toole and Walker2012; Meier et al., Reference Meier, O’Toole, Boyne and Walker2007; Walker et al., Reference Walker, Andrews, Boyne, Meier and O’Toole2010).
Therefore, we expect that higher implementation performance on AAQ policy is positively associated with aldermen and policy officers exhibiting policy entrepreneur characteristics.
The management approach
The management approach is detailed in four specific explanations: internal coordination, external coordination, policy experience and knowledge, and personnel stability (see for overview Saetren, Reference Saetren2014: 100; Walker and Andrews, Reference Walker and Andrews2013; Bondarouk, Reference Bondarouk2017).Footnote 1
Internal coordination
As policy implementation typically involves various government departments, effective coordination between them enhances compliance (Toshkov, Reference Toshkov2011; Treib, Reference Treib2014) and implementation performance (see Andrews et al., Reference Andrews, Boyne, Meier, O’Toole and Walker2012). Effective coordination enables the organisation to shepherd actions, processes and efforts towards one common policy goal (Andrews et al., Reference Andrews, Boyne, Meier, O’Toole and Walker2012) and create a shared understanding of the policy vision throughout the organisation (Jordan and Lenschow, Reference Jordan and Lenschow2000; May and Winter, Reference May and Winter2009; Saurugger, Reference Saurugger2012; Walker and Andrews, Reference Walker and Andrews2013). The systematic literature review by Bondarouk (Reference Bondarouk2017) also shows that internal coordination could produce more integrated policy approaches, which would benefit comprehensive implementation performance.
This common policy vision can be achieved with either formal or informal coordination mechanisms. An example of formal mechanisms is project groups in which staff from different departments participate. These groups “have rules or operating procedures on how often to meet, who prepares meetings, problem solving, and so on” (Schout and Jordan, Reference Schout and Jordan2005: 2010). Alternatively, a shared understanding of the policy direction can be achieved through frequent informal communication between departments (Schout and Jordan, Reference Schout and Jordan2005).
Therefore, we expect that higher implementation performance on AAQ policy is associated with frequent formal and/or informal interdepartmental coordination on this policy.
External coordination
A single municipality cannot assess all information on a given policy by itself, especially when it comes in the form of a policy as complicated as air policy. An infrastructure for external (formal or informal) deliberation or networking facilitates high implementation performance (Betsill and Bulkeley, Reference Betsill and Bulkeley2004; Jänicke, Reference Jänicke2005; Walker and Andrews, Reference Walker and Andrews2013). Policy implementers may use their networks to support and enrich their policy initiatives (Mintrom and Norman, Reference Mintrom and Norman2009). At the same time, by networking or deliberating, policy implementers may strengthen the legitimisation of their policy proposals (Meijerink and Huitema, Reference Meijerink and Huitema2010; Rousselin, Reference Rousselin2016).
Therefore, we expect that higher implementation performance on AAQ policy is associated with frequent formal and/or informal coordination with external stakeholders on this policy.
Policy experience and knowledge
Municipalities’ human resources, i.e. their knowledge and policy experience, are also argued to contribute to comprehensive implementation performance (O’Toole and Meier, Reference O’Toole and Meier2009, Reference O’Toole and Meier2010; Walker and Andrews, Reference Walker and Andrews2013: 106). Some municipalities may employ better schooled and experienced policy officers than others. Policy officers with relevant education and years of experience can effectively boost implementation performance (Gabris et al., Reference Gabris, Golembiewski and Ihrke2001; O’Toole and Meier, Reference O’Toole and Meier2010; Treib, Reference Treib2014).
Therefore, we expect that higher implementation performance on AAQ policy is associated with higher levels of knowledge and policy experience.
Personnel stability
Personnel stability is the final managerial variable alleged to affect implementation performance (Walker and Andrews, Reference Walker and Andrews2013; Meijerink and Huitema, Reference Meijerink and Huitema2010). High personnel turnover has been argued to disrupt established patterns of coordination and cooperation between different municipal organisational echelons, which can negatively affect implementation performance (Andrews et al., Reference Andrews, Boyne, Meier, O’Toole and Walker2012: 80; Henstra, Reference Henstra2010: 244; Meier et al., Reference Meier, O’Toole, Boyne and Walker2007: 366). Changes in personnel can be harmful to implementation performance because of the loss of policy knowledge and skills and the costs of training new staff (Walker and Andrews, Reference Walker and Andrews2013: 115).
Therefore, we expect that higher implementation performance on AAQ policy is associated with higher levels of personnel stability.
Research design
The AAQ directive is a typical EU environmental directive containing both substantive and procedural provisions. It establishes air quality objectives, such as standards for the concentrations of specific air pollutants, and calls for the assessment, monitoring, improvement and sustainment of air quality through rigorous air quality plans. Agglomerations where air quality norms are expected not to be met are required to have a plan of action to improve air quality.
In the Netherlands, the AAQ directive has been transposed into the Environmental Protection Act (EPA), which lays the basis for the National Air Quality Cooperation Programme (NAQCP). The limit values are the same as in the EU directive. Although the directive and the transposition focus on other pollutants as well, NAQCP identified particulate matter ten and nitrogen dioxide, resulting from fossil fuel combustion processes, as the only pollutants being exceeded in the Netherlands. In urban outdoor air, the presence of both pollutants is mainly due to traffic. The Dutch national government is responsible for taxes on polluting cars and fuel, and traffic flows on national highways. The Dutch municipalities are responsible for limiting exposure to pollutants at urban level. For example, this can be achieved by setting higher environmental standards for urban public transport vehicles through public procurement, rearranging traffic flow management, or through the encouragement of environmentally friendly ways of providing transportation (Bondarouk and Liefferink, Reference Bondarouk and Liefferink2017; Fransen, Reference Fransen2012; Van Oort and Van Oort, Reference Van and Van2012; Van Rij and Brink, Reference Van Rij and Brink2013).
The Netherlands present an interesting case for investigating whether differences in local AAQ policy implementation performance can be attributed to political or management explanations. Dutch municipalities form a very homogeneous group. First, almost all Dutch municipalities are faced with approximately the same geographical conditions that affect air quality (Busch et al., Reference Busch, Lenschow and Mehl2012; Busscher et al., Reference Busscher, Zuidema, Tillema and Arts2014). Hence, differences in geographical conditions among the municipalities cannot explain differences in policy output. Second, we selected medium-sized municipalities for the analysis, as they represent a large and homogeneous portion of Dutch society, making them an almost ideal sample for horizontal comparison.Footnote 2 Unlike bigger municipalities where there are harbours and airports, which tend to have a heavily negative effect on air quality, these medium-sized municipalities are also very similar when it comes to physical sources of pollution. Regional and urban traffic is the biggest source of pollution in these municipalities (Bondarouk and Liefferink, Reference Bondarouk and Liefferink2017; Fransen, Reference Fransen2012; Van Oort and Van Oort, Reference Van and Van2012; Van Rij and Brink, Reference Van Rij and Brink2013). Thus, they all hypothetically could take similar measures. Moreover, all municipalities had to take several measures at the same time, as it is the combination of different measures taken together that can make a difference (Fransen, Reference Fransen2012; Van Oort and Van Oort, Reference Van and Van2012; Van Rij and Brink, Reference Van Rij and Brink2013). Taken separately, each measure does not contribute that much to the improvement of AAQ. For example, next to discouraging car-use, it makes sense to encourage and facilitate other sorts of transportation at the same time.
Third, Wood et al. (Reference Wood, Hultquist and Romsdahl2014: 534) identified that regulatory pressure from the national government can account for differences in local implementation. Having ample discretion in deciding on AAQ measures (Bondarouk and Liefferink, Reference Bondarouk and Liefferink2017), Dutch municipalities have experienced equal pressure from the national government. And finally, the medium-sized municipalities had very similar municipal budgets and drew comparatively similarly from the available national funds. Dutch municipalities had equal access to the national subsidies for AAQ measures (Bondarouk and Liefferink, Reference Bondarouk and Liefferink2017). Hence, differences in implementation performance in our sample cannot be attributed to geographical conditions, differential national steering or financial resources.
Despite eliminating these rival explanations for the differences in implementation performance through careful case selection, we needed to control for a strong alternative explanation. If municipalities start with different levels of air pollution, i.e. the AAQ pressure, then the severity of environmental problem might explain why some municipalities took more measures than others (see also Henstra, Reference Henstra2010; Wood et al., Reference Wood, Hultquist and Romsdahl2014; Zahran et al., Reference Zahran, Brody, Vedlitz, Grover and Miller2008). We control for this explanation by selecting municipalities from two groups: those that did and those that did not have an air pollution problem to start with. In 2008, the national government identified several municipalities that, despite national air quality measures, would still exceed the EU norms by 2015. Facing more persistent air pollution, these municipalities can be expected to take extra local measures next to national measures, compared to municipalities without the forecasted AAQ norms exceedance.
The measurement of implementation performance was based on the secondary database from Bondarouk and Liefferink’s (Reference Bondarouk and Liefferink2017) study on local AAQ implementation performance. They provide a ranking of medium-sized municipalities based on their AAQ implementation performance along with an extensive codebook, detailing what measures were taken over the 2005–2015 period. Hence, they have mapped which municipalities were more comprehensive in their policy output than others. Bondarouk and Liefferink (Reference Bondarouk and Liefferink2017) based their ranking on the measures that were actually taken, so not the measures that were only decided upon in the management plans but the measures that the local governments ended up implementing. They have identified six categories of all AAQ policy measures the local governments took in that period (see also Fransen, Reference Fransen2012; Van Oort & Van Oort, Reference Van and Van2012; Van Rij and Brink, Reference Van Rij and Brink2013). The six categories of air quality measures are (1) public transport, (2) prevention of cars in the city, (3) bicycle policy, (4) stimulating the demand for alternative transportation, (5) information for the public and (6) sensitive destination measures. The measures in these categories were coded along five aspects: how comprehensive the measures were, the territorial and temporal scope of the measures, how broad the target group of AAQ measures was, and whether there was any form of monitoring envisioned for the policy instruments. A policy measure received a higher score per aspect if more descriptions from the long-list of all possible policy practices could be ‘ticked’ for the city in question. To come up with an aggregate score for one of the six categories of measures, the scores on the individual measures of the same category were added up. We have included the summary of Bondarouk and Liefferink’s (Reference Bondarouk and Liefferink2017) codebook in online Annex A. It also describes all AAQ measures that the medium-sized municipalities actually took.
For the selection of municipalities, we employed the most diverse distribution-based case selection on the dependent variable method (Rohlfing, Reference Rohlfing2012) as it allows us to explain the variation in implementation performance. The selection on the dependent variable is warranted as this research is Y-centred (Gerring, Reference Gerring2001: 137; see also George and Bennett, Reference George and Bennett2005: 218; Blatter and Haverland, 2012; Rohlfing, Reference Rohlfing2008; Rohlfing, Reference Rohlfing2012). Y-centred research aims to analyse whether variance on the dependent variable can be associated with certain independent variables. “The starting point of the analysis is the dependent variable and within-case analysis moves backward to determine the relevant independent variables” (Rohlfing, Reference Rohlfing2008: 1505). This is different to X-centred research which tests whether and to what extent certain independent variables lead to certain levels of the dependent variable. In X-centred research, the independent variable is the starting point for the process tracing analysis (Rohlfing, Reference Rohlfing2008: 1505).
We selected four municipalities from the Bondarouk and Liefferink (Reference Bondarouk and Liefferink2017) database based on the scores on the implementation performance. It should be noted that the least-performing municipalities are still compliant with EU directives, as they have an AAQ plan and met AAQ standards. Relative to their best-performing peers though, the least-performing municipalities took less extensive measures. The database was first divided into two groups: municipalities that did and those that did not have an air pollution problem to start with. From each group of municipalities we selected two highest- and two least-performing municipalities. In this way, we aimed to control for the severity of environmental problem that could potentially explain why some municipalities took more measures than others. In order to safeguard the anonymity that was promised to the respondents, the municipalities are labelled as A and B (the best performing municipalities), and C and D (the least performing). A and C have a high, B and D a low AAQ pressure.
Data on explanatory variables were gathered through document analysis and interviews with 37 respondents who were involved in AAQ policy in the period of 2005-2015. Even though the directive’s transposition deadline was in 2009, we analysed data in the time frame of 2005–2015. This broader time frame allowed for sounder process tracing as we could fully capture the AAQ measures, which some municipalities had taken prior to the formal transposition. In each municipality we interviewed policy officers from environment, traffic and transit departments; aldermen with environment, traffic and transit affairs in their portfolios; consultants involved in the implementation process, local environmental groups, local Community Health Services (GGDs), local industries or companies affected by local air quality policy, and local citizens’ associations. In order to obtain an overall impression of local implementation practices and trends, we also conducted interviews with a number of national actors: the Ministry of Infrastructure and the Environment, the Association of Community Health Services, the National Institute for Public Health and the Environment (RIVM), consultancies, and the national Court of Audit. A list of respondents is provided in online Annex B.
Based on these interviews, the explanatory variables were coded as high, medium or low. Within the authors’ team, we have thoroughly discussed the data and the coding of the explanatory variables. Due to this extensive coordination we did not perform an inter-coder reliability test. As this was a comparative case study the coding represents relative values in the case studies. As we have gathered data over ten years, we had to comprise the data in order to be able to compare it. Table 1 presents the operationalisation and coding scheme for the explanatory variables.Footnote 3
Table 1 Operationalisation of explanatory variables
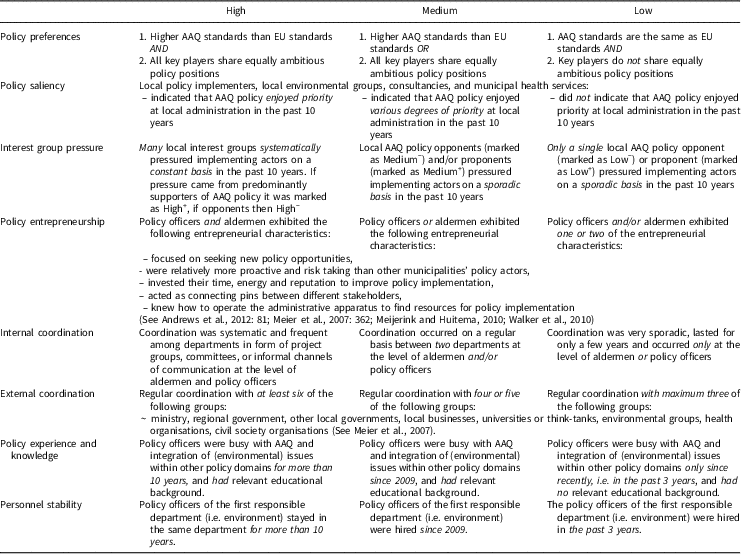
We used the following steps to analyse the data. First, this methodological design rests on the classic principle in logic that as long as the cases are similar in all other relevant aspects, differences in dependent variable are explained by differences in independent variables (Denk, Reference Denk2010). Thus, the codes on the explanatory variables are to covary with the codes on the dependent variable in order for them to be considered as potential explanations for implementation performance. Hence, we first eliminated variables in our cross-case comparison that did not covary with the dependent variable. As implementation research is characterised by equifinality of explanatory variables (e.g. Toshkov, Reference Toshkov2011; Treib, Reference Treib2014; Winter, Reference Winter2012), we expected that several explanatory variables together would form a potential explanation for the variance in implementation performance. Therefore, several explanatory variables were expected to survive the elimination round.
Second, we employed process tracing of individual cases to identify the sequence and interrelation of the variables that survived the elimination round (see Bennett and Checkel, Reference Bennett and Checkel2014). These variables served as theoretical clues to guide the process tracing of within-case analysis (Bennett and Checkel, Reference Bennett and Checkel2014: 7). The individual within-case analyses were then compared among each other in order to reach sounder conclusions on the causal mechanisms and interactions at play.
In addition, following the conventional method of process tracing, we also kept an eye on potential alternative explanations that could emerge from the data (see Bennett and Checkel, Reference Bennett and Checkel2014). Party politics is one of the explanations that has been identified as accounting for EU compliance (see for an overview Treib, Reference Treib2014; Thomson, Reference Thomson2010: 582; Mastenbroek and Kaeding, Reference Mastenbroek and Kaeding2006). Even though this explanation is very intuitive, especially if one examines political explanations, the literature does not offer consistent findings (see for an overview Treib, Reference Treib2014: 22). The partisan effect is difficult to operationalise in longitudinal studies and depends on policy sector in terms of what effect can be hypothesised (Treib, Reference Treib2014: 22). Yet, it is almost intuitively important to check for this explanation in our data.
In the next section, we present the case descriptions, based on document analysis and interviews, before moving on to the analysis and the elimination rounds of variables.
Case descriptions
Municipality A
This municipality scored high on implementation performance. This means that it took most measures, which were also generally more extensive, targeted larger parts of the population, had wider territorial scope, and the AAQ measures had been in place for a longer time than in other municipalities.
Air pollution enjoyed high saliency in this municipality for health reasons. A report by the Community Health Service identified air pollution as a cause for the high number of cancer patients in one of the districts. This report spurred a long institutionalised discussion between the municipal administration, local industry representatives, and civil society organisations. A platform was established which brought these different stakeholders together twice a year to discuss, i.e. health impacts of various municipal infrastructural projects. The heavy industry in the city was cooperating with the municipality’s administration and was sympathetic to AAQ ambitious local policy.Footnote 4 Together they wanted to ensure that the city had a progressive environmental policy with green modes of transportation. In order to reassure the public that the municipality was doing all it could to safeguard the health of its citizens, the aldermen and policy officers from environment, and traffic and transit departments were highly committed to taking as many policy measures as possible to achieve higher air quality than the AAQ directive called for.
In addition, many respondents characterised the aldermen and policy officers involved in AAQ policy as intrinsically and idealistically driven to improve AAQ. Both groups of actors were very knowledgeable on environmental issues. They were known for being open to new avenues of improving environment quality, even across municipal borders. They were involved in various national and inter-municipal projects. Political and administrative actors of the environmental department worked very closely with each other, as well as with the traffic and transit department’s political and administrative actors. This close cooperation even resulted in the restructuring of these administrative units into a single department.
Municipality B
This municipality also scored high on AAQ implementation performance. This means that it took a lot of AAQ measures, which were generally more extensive, targeted larger parts of population, had wider territorial scope, and the measures had been at place already for a longer time than in other municipalities.
In municipality B, similar to municipality A, AAQ was framed in terms of health. As early as 2000, a local pulmonologist raised concerns about the high number of lung patients in the municipality. Policy officers from the environmental department picked up the issue and invited a consultancy firm to calculate the health benefits of establishing an environmental zone. These calculations were crucial in swaying the alderman of environmental issues, who hereafter became a fierce proponent of the environmental zone and strongly advocated extensive AAQ measures and going beyond existing EU norms.
This alderman instructed his policy officers to ensure broad public and administrative support for the environmental zone, as this would enable the adopting of more extensive measures. If necessary, the alderman declared himself willing to push the issue through the council anyway. The environmental department hired a consultancy firm specialised in tackling multi-faceted issues characterised by a large number of different stakeholders with very diverging interests to coordinate the policy internally and externally. This consultancy firm managed to create broad support within the municipality apparatus and among local and regional partners, and taught the environmental policy officers how to maintain this support. Local interest groups were not visible in these discussions, with the exception of representatives of city centre shop owners, that were hampered by the environmental zone arrangements. Yet, the municipality managed to cooperate with them and to ensure that they also supported ambitious AAQ policy. The local city centre shop owners were facilitated in their management of goods supply. In this way, the traffic within the city was minimised. The key to getting everyone on board (including city centre shop owners) was to focus on the benefits for the citizens’ well-being. In addition to this consultancy firm, a special policy officer responsible for the integration of municipal policies boosted close interdepartmental cooperation further.
Many respondents credited the environmental policy officers for their knowledge, their drive and their passion, viewing this as a cause for the municipality’s high implementation performance. Municipality B was selected by the national government as an example of how to organise an environmental zone, and environmental policy officers were asked to present their experience at different national meetings.
Municipality C
This municipality scored low on implementation performance. It took fewer AAQ measures, which were also less extensive in terms of target group and territorial scope. The measures were also taken rather late, as compared to municipalities A and B.
Unlike in municipalities A and B, AAQ was seen as a transit issue and not so much related to health. Currently, though, policy officers try to link air quality to sustainability and energy issues to make it more palatable to politicians. Over the years, local environmental policy officers did their best to push through more ambitious AAQ objectives. In contrast to the policy officers, the alderman first dealing with the issue was merely motivated to reach the EU norms by 2015. In 2010, a more committed and entrepreneurial alderman was installed. She was even nominated for the Greenest Politician award of the year. Although this alderman was just as committed to AAQ policy as her environmental policy officers, together they were not able to persuade the council to adopt more ambitious AAQ measures. The council simply did not see the need or urgency of going beyond EU norms or taking a lot of measures. Only by 2014 did they manage to install an environmental zone. When it comes to interest group’s pressure, the local Cyclists’ Union and a local environmental group sporadically pushed for more extensive policy measures over the years. The representatives of city centre shop owners, which were negatively affected by the changes in traffic circulation, did not manage to voice their concerns in the council about the change in customers’ access to their shops.
The policy officers were very knowledgeable and experienced in air pollution prevention. They cooperated on a regular basis with the Community Health Service and were well connected nationally and internationally, participating in different associations and networks. The traffic and transit department cooperated informally with the environmental department. Over the years, the cooperation intensified and ebbed. When the alderman had both environment and transit in his dossier, the administrative units worked together more closely.
Municipality D
This municipality also scored low on implementation performance. It also took fewer AAQ measures, which were less extensive, targeting not as a large group of population or a territorial scope. The measures were also taken rather late as compared to municipalities A and B.
AAQ did not enjoy full political or administrative attention, as financial mismanagement and internal reorganisations dominated the agenda. The policy officer and alderman merely aimed to reach the EU norms. Just like in municipality C, AAQ was associated with transit rather than health. Only recently a local civil society organisation actively raised health concerns, starting to lobby for stricter standards and more policy measures. So far this has been the only interest group concerned with AAQ in municipality D. There was no interest group opposing the AAQ measures.
The city council demanded an ex-ante evaluation of the effect on AAQ of all measures that were considered for adoption. This process stalled the actual adoption of measures. As different respondents claimed, the need to justify all AAQ measures with calculations could be seen as a pretext not to take any measures at all, as calculations are time-consuming and often do not generate conclusive recommendations. This ‘policy hesitance’ laid bare the lack of a policy entrepreneur who would have taken the risk of breaking the deadlock and rejecting the demands for further calculations on basis of a too tardy process, enough data being available and the inconclusiveness of these calculations.
In contrast to the other three municipalities, the internal coordination was very sporadic and only occurred when specific infrastructure projects called for cooperation between the departments. There was virtually no coordination on the political level. External coordination was limited as well, compared to the other three municipalities. The policy officers were knowledgeable and experienced in air pollution prevention.
Analysis
This section presents the patterns, similarities and differences among the municipalities. Table 2 schematically presents the findings for all four municipalities. We first eliminate the explanatory variables that do not covary with the dependent variable. Table 2 assists in this first crosscase analysis. We then proceed with the comparative within-case analysis to go into more depth, to identify the interaction of variables, and to isolate causal mechanisms. Following the conventional method of process tracing, we also reflect on potential alternative explanations (see Bennett and Checkel, Reference Bennett and Checkel2014).
Table 2 Schematic representation of the findings in four municipalities
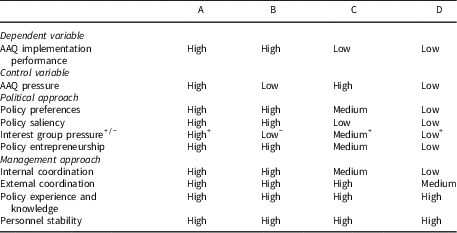
Note: “+” signifies pro-strict AAQ measures interest group pressure, “−” signifies anti-strict AAQ measures interest group pressure.
Table 2 shows that the political variables covary with the dependent variable of implementation performance more strongly than the management variables. Contrary to scores on the political variables, all municipalities scored very similarly on external coordination, policy knowledge and experience, and personnel stability. This lack of variation means that these management variables cannot explain the differences in implementation performance. Yet, it is important to note that as all municipalities formally complied with an obligation to have a plan, these variables may account for the fact that these municipalities complied with this procedural provision in the first place. Though interesting in itself, this finding is nevertheless of secondary importance in this study as we are interested in differences in implementation performance.
Zooming in on the political variables in Table 2, two observations stand out. First, Table 2 shows that interest group pressure does not covary with the high scores for implementation performance. Thus, it does not constitute a necessary condition for high implementation performance. Interestingly though, the scores on interest group pressure seem to correlate with the level of AAQ pressure. This suggests that interest group pressure intensifies with the level of environmental problem pressure. What the empirics also showed is that there was almost no opposition from interest groups against AAQ measures. In municipality B, there was one interest group of city-centre shop owners that voiced its concerns about the reachability of their shops if the municipality were to ban vehicles from the city centre with the new environmental zone (Respondents: 17–19, 21). Yet, very quickly the policy officers managed to convince them that this would not be a problem (Respondents: 17–19, 21). Hence, the city-centre shop owners were swayed over to support the environmental zone. In other cities, there was no opposition of any significance at all. While more research is required to explain this phenomenon, a possible explanation emerged from the interviews. The car and transport industry that is affected by traffic-reducing AAQ measures operates in the Netherlands on a national level (Respondents: 1 and 4). Hence, they would try to represent their interest on a national rather than a local level.
A second observation based on Table 2 is that policy saliency seems to covary perfectly with the dependent variable. The difference in saliency can be linked to the type of framing of AAQ. In municipalities A and B, AAQ policy was framed as a health issue (Respondents: 5, 11, 13–23), while C and D framed it as a transit issue (Respondents: 24–26, 32, 33, 35, 37). This could explain the high saliency of AAQ policy in A and B, as generally health issues are considered to be more urgent in local politics than transit issues.
In addition to policy saliency, policy preferences and policy entrepreneurship covary to some extent with implementation performance (Table 2). Comparative process tracing suggests that high saliency alone is not enough to result in high implementation performance. In case B, the AAQ issue was salient to the policy officers, but in the beginning of the process political actors were not yet as ambitious as policy officers (Respondents: 5, 17–19, 22, 23). Highly entrepreneurial and committed policy officers were crucial in convincing the political actors of the necessity of extensive measures (Respondents: 5, 17–19, 21–24). Case C illustrates that low saliency (Respondents: 24, 27, 29, 30) provided room for differences in policy preferences among political actors (Respondents: 24, 27, 30). As AAQ was not considered urgent by the city council, the ambitious preferences of entrepreneurial policy officers were not sufficient to convince the alderman first dealing with the issue and the city council of the necessity of extensive AAQ policy (Respondents: 24–28, 30, 31). Only in 2010 with the new alderman, who was more entrepreneurial and committed to the AAQ policy, were the policy officers able to successfully advocate for more extensive measures. However, still the city council did not favour extensive measures, and thus municipality C could take fewer measures than municipalities A and B. In Case A, AAQ enjoyed high saliency among policy officers and political actors. The ambitious policy preferences were necessary to signal their commitment to the far-reaching AAQ policy to the public (Respondents: 5–16). As political and administrative actors were highly entrepreneurial, this exacerbated their policy efforts (Respondents: 5–16). In case D, finally, there was no policy saliency to begin with (Respondents: 32–36). This coincided with less entrepreneurial policy officers and political actors (Respondents: 32–35, 37). The city council was highly critical of the policy ambitions of the alderman and the policy officers, requesting detailed cost-benefit calculations of all AAQ policy measures (Respondents: 32–35). This resulted in a protracted process of approving budgets for the policy (Respondents: 5, 32, 33, 35). In sum, policy saliency, preferences and entrepreneurial activity of political actors and policy officers, if ambitiously aligned, can reinforce each other, resulting in higher implementation performance.
Next to these differences on political variables, there is one notable difference in how internal coordination, i.e. the management variable, was organised in the best and the least performing municipalities (Table 2). Municipalities A and B exhibited extensive coordination within the administration and with the political apparatus. Especially municipality B put a lot of effort into establishing effective forms of internal policy coordination (Respondents: 17–22). Even so, this explanatory factor seems to covary less consistently with implementation performance than the policy saliency variable (see Table 2). Whereas it clearly facilitated the communication and exchange of ideas between the administrative stakeholders, which enabled more measures to be taken (Respondents: 16–22, 24, 25, 27, 35), it does not seem to be a sufficient condition on its own and needs to coincide with other explanatory variables like policy saliency, preferences and entrepreneurship to be able to positively impact implementation performance.
Finally, concerning potential alternative explanations, our empirical data over 10 years gives rise to an interesting observation regarding the impact of political party affiliation of aldermen and electoral change (Table 3). Electoral change seemed to matter in municipality C (Respondents: 24, 26, 27). A more committed, entrepreneurial alderman from the liberal party replaced a less committed one from the Christian-democrat party (Respondents: 24, 26, 27). Even though the Dutch liberal party is known for favouring car-friendly policies, this liberal alderman was in favour of far reaching traffic-limiting measures. Thus more AAQ measures could be taken.
Table 3 Alternative explanations

Note: *Ambitious AAQ policy preferences.
At the same time, a change of aldermen did not seem to make a difference for the implementation performance in municipality B, where a labour alderman succeeded a local party alderman (Respondents: 17, 18, 20, 21). Here one could not expect a labour alderman to continue with an ambitious green policy of his local party predecessor. Nevertheless, both were equally ambitious. Neither was implementation performance affected by an electoral change in municipality D. Here, a liberal-democrat alderman took over from a left green alderman (Respondents: 35, 36, 37). One could have expected that a liberal democrat would have to deal with the green legacy of his predecessor, but the policy preferences of both aldermen were similar and equally unambitious. Municipality A had the same left green alderman during the entire period of investigation. Thus, the political party affiliation of aldermen and change of aldermen on its own cannot explain the differences in implementation performance in our sample.
Conclusion
We examined to what extent differences in local implementation performance can be attributed to the political and managerial variables derived from EU compliance and implementation research. Our analysis shows that differences in local implementation performance are better explained by the political approach than by the management approach. Hence, the national politicisation of EU policies continues at the local level as well. This finding illustrates the necessity to look beyond national level to see how EU plays out on the ground. As the EU often sets minimum targets or employs procedural policy instruments, we need to examine why some implementers do more than others to understand how member states make EU policies work.
By conducting a theory-driven comparative within-case analysis, we complemented earlier research on policy saliency showing how saliency may interact with other variables. High policy saliency emerged as the driving force, which in combination with ambitious policy preferences and entrepreneurship of both policy officers and political actors determined high implementation performance. In addition to this, frequent internal coordination contributed to high implementation performance, by enabling and strengthening the preference alignment of policy officers and political actors.
While political variables explain the differences between municipalities in the Netherlands, the management variables might be conducive to another outcome. All municipalities comply with the procedural obligation to have an AAQ management plan in the first place. Hence, while similar scores on management variables cannot explain the differences between municipalities, they could explain the same outcome on compliance. Thus, politicisation explains the differences in implementation performance, but management variables could explain the compliance record in our cases. Whether the latter is indeed the case, should be subjected to rigorous comparative research.
When it comes to the representativeness of our findings we may reasonably expect that differences in environmental policy implementation performance in medium-sized municipalities of (at least) North-western EU member states will exhibit the same causal mechanism. These member states are characterised by relatively similar environmental awareness and economic development. At the same time, we expect that the observed causal mechanism, driven by policy saliency, will also be at play during the implementation of other policies. However, whether this is the case should be examined in future research.
This analysis identified two peculiarities, which call for further research on EU implementation. First, the framing of environmental issues as health issues was found to have played an important role in the implementation of the AAQ directive as it resulted in higher policy saliency when compared to cases where AAQ was framed as a transit issue. How the framing dynamic exactly impacts saliency and, in turn, policy implementation should be examined in more depth. Second, despite the observed politicisation of EU implementation at the local level, our analysis sketched a limited effect of local council elections on the implementation performance. Aldermen behaved differently from what one may have expected if one relied on only their political affiliation. More in-depth research is needed to understand how local political parties interests affect EU implementation.
Supplementary material
To view supplementary material for this article, please visit https://doi.org/10.1017/S0143814X19000035
Acknowledgements
The authors would like to acknowledge valuable feedback from Prof. Dr. Andrea Lenschow on the previous version of this paper and the three anonymous reviewers.


 Open access