Introduction
The proportion of Canadians over the age of 65 is expected to reach 25 per cent in 2036 (Statistics Canada, 2010). As people grow older, they are more likely to experience frailty (Buckinx et al., Reference Buckinx, Rolland, Reginster, Ricour, Petermans and Bruyère2015), which is defined as “a patient health state associated with getting older; involving multiple serious health issues that increase an individual’s vulnerability for extended acute care or end-of-life care”(Canadian Frailty Network, 2016). Currently, 25% of Canadians over the age of 65, and 50 per cent of those over the age of 85, are considered frail (Hoover, Roterman, Sanmartin, & Bernier, Reference Hoover, Roterman, Sanmartin and Bernier2013).
Compared with their non-frail counterparts, older persons with frailty have even greater and more complex health care needs. This has been supported by several studies that have found higher rates of health services utilization (i.e., rates of hospitalization [Fried et al., Reference Fried, Tangen, Walston, Newman, Hirsch and Gottdiener2001] and institutionalization [Rockwood et al., Reference Rockwood, Howlett, MacKnight, Beattie, Bergman and Hébert2004]) and poorer short- and long-term health outcomes (Bagshaw et al., Reference Bagshaw, Stelfox, McDermid, Rolfson, Tsuyuki and Baig2014; Patel et al., Reference Patel, Brennan, Brennan, Jupiter, Shar and Davis2014; Rockwood et al., Reference Rockwood, Howlett, MacKnight, Beattie, Bergman and Hébert2004) in frail older adults than in older adults who are not frail. With its multiple clinical and societal consequences, frailty is a major population health issue, and health systems must be prepared to provide the best possible care for this growing population in the coming decades.
In a first step towards addressing this challenge, we conducted an environmental scan to describe the current state of care for older persons with frailty across Canada. The scan consisted of a literature review, stakeholder interviews, and analysis of administrative health data. This article focuses on the administrative health data analyses. The specific objectives of this work were to:
(1) Identify a series of quality indicators (QIs) appropriate for assessing the quality of care provided to older persons with frailty and that could be derived from provincial administrative health databases,
(2) Assess the quality of care provided to older persons with frailty in selected provinces by examining the identified QIs, and
(3) Examine how various demographic factors may influence QIs.
Methods
Cohort Identification
We identified cohorts of older persons with frailty (≥ 65 years of age) in five Canadian provinces: British Columbia (BC), Alberta (AB), Ontario (ON), Quebec (QC), and Nova Scotia (NS). Because of the lack of an established method by which to identify frail persons within administrative health databases, we first developed a set of “frailty identification rules” through a process described elsewhere (Urquhart et al., Reference Urquhart, Giguere, Lawson, Kendell, Holroyd-Leduc and Johnston2017). Briefly, we based the proposed rules on a literature search, consultations with experts (practicing physicians with expertise in geriatric medicine, experts in frailty research, and researchers with expertise in administrative health data) and a scoping literature review. Older people with claims data meeting at least one of the following three rules were considered frail: (1) person was a long-term care resident, (2) person received palliative care, or (3) person was categorized as meeting at least two of seven domains, which were based on frailty scales, geriatrician discussions, and health service utilization indicators (Urquhart et al., Reference Urquhart, Giguere, Lawson, Kendell, Holroyd-Leduc and Johnston2017) .
In BC, AB, ON, and QC, these rules were applied to population-based hospitalization (i.e., discharge abstracts databases in BC, AB, ON; Med-Echo in QC) and provincial physician billings databases. Older persons with frailty were then further divided into two cohorts: those who had died and were 66 or older at the time of death (henceforth “decedents”), and those with no recorded date of death who were 65 or older at the start of the most recent year of data examined (henceforth “living persons”). In NS, we identified older persons with frailty from within an existing cohort of individuals who had died from cancer and for whom hospitalization (i.e., discharge abstracts database), and physician billings data were available. As with the decedent cohorts in other provinces, individuals in NS were only included in the study cohort if they were 66 or older at the time of death.
The years of data used to identify each cohort of individuals varied across provinces. We identified decedents using the following fiscal years (FY) of data: FY 2009/10–2013/14 in BC; FY 2004/05–2008/09 in NS; and FY 2013/14 in AB, ON, and QC. We identified living persons using data from FY 2013/14 in all provinces (except NS), as this was the most recent year of data available at the time of the study.
QI Selection
QIs are quantitative measures, based on evidence and/or expert consensus, that are used to monitor and evaluate the ability of health professionals and systems to provide care that meets patients’ needs (Mainz, Reference Mainz2003). A preliminary list of potential QIs for assessing the quality of care provided to older persons with frailty was assembled based on previous QI development work relevant to end-of-life care in cancer patients (Earle et al., Reference Earle, Park, Lai, Weeks, Ayanian and Block2003; Grunfeld et al., Reference Grunfeld, Johnston, Mykhalovskiy, Cicchelli, McIntyre and Burge2006) and supplemented with those identified from the literature review we conducted as part of the larger environmental scan. We then restricted this list to only those indicators that we could extract within administrative data sets in at least two of the five participating provinces.
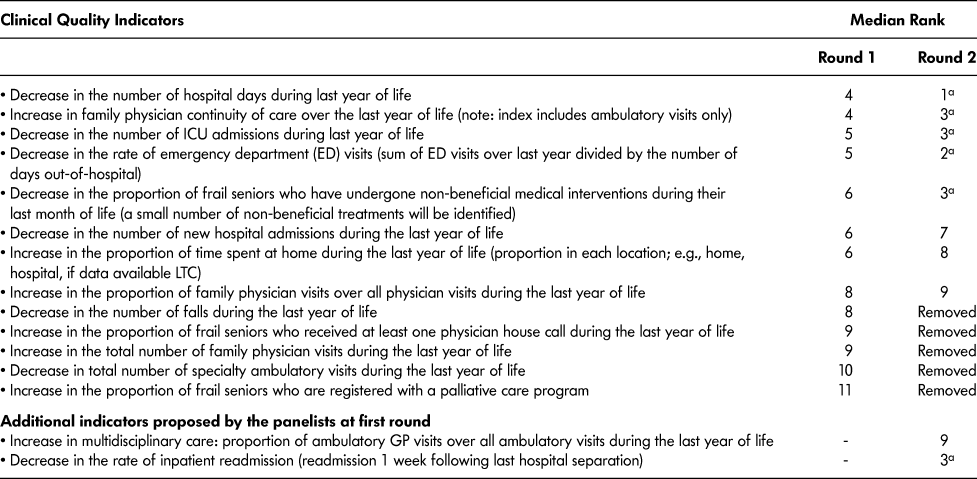
Next, we used a Delphi approach (Jones & Hunter, Reference Jones and Hunter1995) to obtain consensus with regard to the final set of QIs to be examined. We invited project team members, including members of the Stakeholder Advisory Group and research staff, to participate. Two rounds of electronic survey administration occurred during which the participants ranked the selected QIs based on their perceptions of their importance and relevance in assessing the performance of individual clinicians, clinical delivery teams, or delivery organizations in the provision of care to older persons with frailty. A meeting with the participants allowed discussing the ratings between rounds. Of the 23 individuals invited to participate, 19 participated in the first round of survey administration, and 21 participated in the second. Participants included two primary care physicians, two specialist physicians, two geriatricians, 10 researchers (with expertise in aging, geriatrics/gerontology, palliative care, or frailty), two research assistants, and five decision makers (categories are not mutually exclusive). Only the QIs that achieved a median rank of eight and above (i.e., 8–11) in the first round were included in the second round. Of those, only those with a median rank of 1, 2, or 3 were selected for study inclusion (Table 1).
Table 1: Potential clinical quality indicators presented to the Delphi panel and median rank during each round of deliberations
Note. a Selected for extraction.
ICU = intensive care unit, LTC = long-term care, GP = general practitioner.
Analysis
QIs were examined by cohort and province. Because of differences in databases across provinces, the specific data elements used in the calculation of each QI varied. The definition of each QI, the general approach used in the calculation of each, and the time frames over which each was calculated were as follows.
(1) Length of stay in hospital was defined as rates, as the total number of days spent in hospital for any diagnosis either during one year or during 30 days. We did not include hospitalizations for which the admission and discharge date were the same day to avoid counting hospitalizations for out-patient care (i.e., same-day discharge). We considered the discharge date to be an in-patient day, but not the admission date. For decedents, we calculated this indicator over the last 30 days of life and the last year of life; for living persons, we calculated it over the most recent year for which data were available.
(2) In-patient readmissions were defined as the proportion of individuals admitted to hospital for any diagnosis within 30 days of the previous discharge. We excluded admissions occurring on the same day as the previous discharge in order to avoid counting transfers. For decedents, we calculated this indicator over the last year of life; for living persons, we calculated it over the most recent year for which data were available.
(3) Number of emergency department (ED) visits was defined as the total number of visits to the ED for any diagnosis. For decedents, we calculated this indicator over the last 30 days of life, and again over the last year of life; for living persons, we calculated it over the most recent year for which data were available.
(4) Family physician continuity of care was defined as the extent to which an individual received care from the same individual physician. We measured continuity using the Modified Modified Continuity Index (MMCI) (Magill & Senf, Reference Magill and Senf1987), which generates an index score between 0 and 1, whereby a higher number indicates better continuity of care. For decedents, we calculated continuity over the last year of life; for living persons, we calculated it over the most recent year for which data were available. We had access to the unique physician identifiers needed to calculate this indicator only for BC, AB, and ON.
(5) Use of mechanical ventilation was calculated as the proportion of decedents who were on mechanical ventilation at least once during the last 30 days of life. This indicator was included as a measure of the receipt of non-beneficial treatment during the last 30 days of life.
(6) Admission to intensive care unit (ICU) was calculated as the proportion of decedents with at least one ICU admission during the last 30 days of life. ICU admissions included transfers to the ICU from other units. This indicator was included as a measure of the receipt of non-beneficial treatment during the last 30 days of life.
Except for indicator number 4 (family physician continuity of care), lower numbers for the above QIs mean better quality in many contexts.
For each data set, we examined the relationship between each covariate (sex, age, community size, income quintile, material deprivation index [Pampalon, Hamel, Gamache, & Raymond, Reference Pampalon, Hamel, Gamache and Raymond2009]) and the selected QIs using multivariable analyses. We used negative binomial regression models to examine the relationships between covariates and the number of ED visits, as well as between covariates and length of stay in hospital. We used logistic regression models where the dependent variables were dichotomous (i.e., inpatient readmission [yes/no], receipt of invasive ventilation [yes/no], admission to ICU [yes/no]). We used generalized linear modeling with gamma distribution and log-link function to examine the relationships between covariates and family physician continuity of care. Adjustments consisted of controlling for all the other covariates in the model. For example, the results comparing females with males were adjusted for age, community size, income, and material deprivation. The results that compare those who were 66–74 or 75–84 years of age with those who were ≥ 85 years of age were adjusted for sex, community size, income, and material deprivation.
Results
Cohort Characteristics
Table 2 summarizes the cohorts’ characteristics by province.
Table 2: Description of older persons with frailty by province and cohort
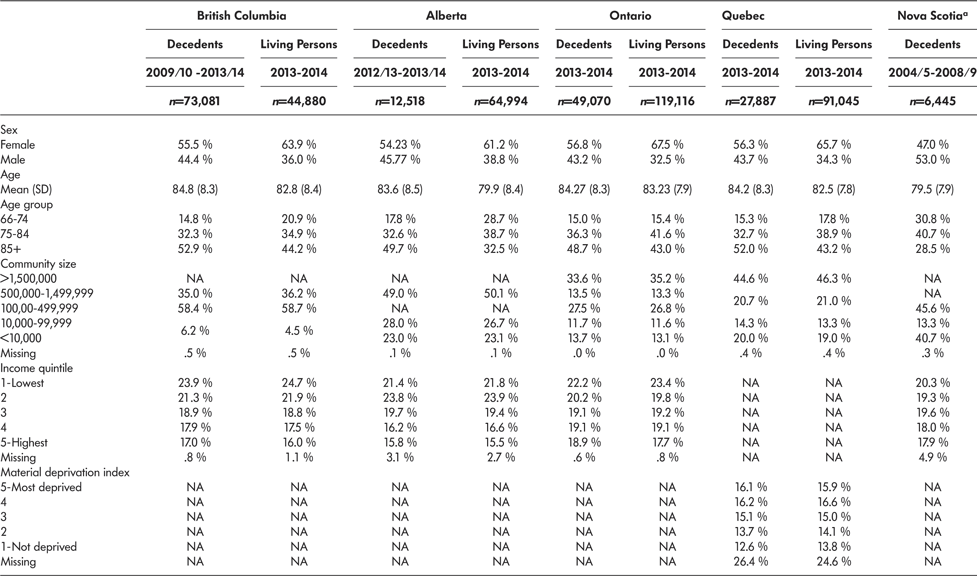
Note. a Nova Scotia cohort included all older adults (≥ 66 years of age) who had died of cancer between 2004 and 2009.
QI Selection
Participants required two rounds to reach consensus (Table 1). During a meeting between the two rounds, participants decided that the “number of falls during last year of life” would not be included in the second round, as this measure is not an indicator of clinical quality of care, but is instead a frailty indicator. Only the “rate of emergency department visits” changed rank between the first and second rounds, moving from the third to the second rank. Based on this exercise, we selected the top-ranked QIs (i.e., ranked 1, 2, or 3) for indicator development. We restricted the indicator “decrease in the proportion of frail older adults to have undergone non-beneficial medical interventions during their last month of life” to ventilation only, because of the challenge of reliably identifying other non-beneficial procedures within administrative data, which was beyond the scope of the project.
QI Results
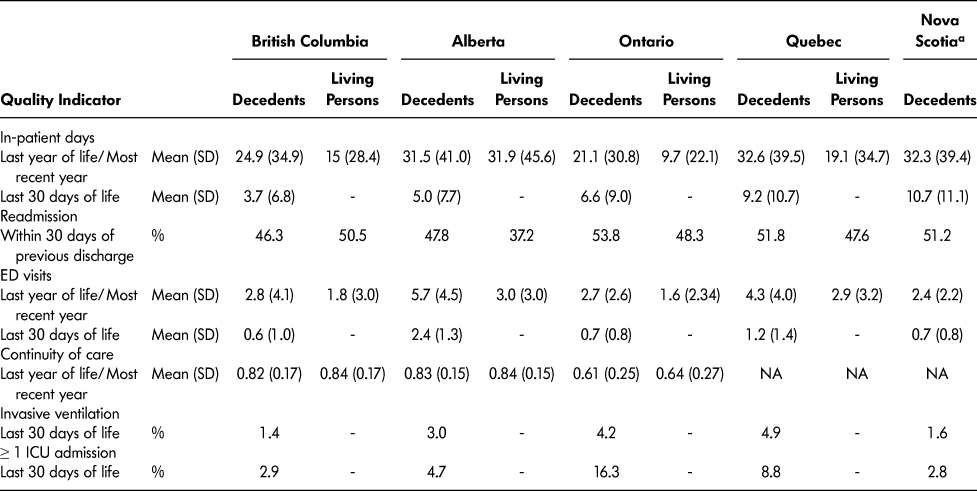
Table 3 summarizes performance on the selected QIs. Tables 4–9 present the results of the multivariate analyses.
Table 3: Quality of care based on selected quality indicators by province and cohort
Note. a Nova Scotia cohort included all older adults (≥ 66 years of age) who had died of cancer between 2004 and 2009.
ED = emergency department, NA = not available (individual level physician identifiers required for this variable were not available), ICU = intensive care unit, - = variable not calculated for this cohort
Table 4: Length of stay in hospital either during one year or 30 days (adjusted rate ratio and 95% confidence interval) for older persons with frailty who died (decedents) and those who were living (living persons)

Note. Statistically significant associations are indicated in boldface.
a Example of calculation: in BC, the unadjusted mean length of stay (LOS) in the previous year among women was 13.6 days, and in men it was 17.6 days, resulting in an unadjusted rate ratio of .77. The ratios were adjusted based on the regression model. The estimated mean LOS of males, who were over 85 years of age, from a community with fewer than 100,000 residents, and from the group with the highest income quintile, was 12.8 days. For females, who were over 85 years of age, from a community with fewer than 100,000 residents, and from the group with the highest income quintile, the model-estimated mean LOS was 10.2 days. Hence, in BC, the ratio in the previous year LOS between women and men, adjusted for age, community size, and income was .80. This means that, on average, frail women in BC had 20 per cent fewer in-patient days than men during the last year before analysis.
Table 5: In-patient readmissions within 30 days of a previous discharge (adjusted odds ratio [OR] and 95% confidence interval), for older persons with frailty who had died (decedents) and those who were living (living persons)

Note. Statistically significant associations are indicated in boldface.
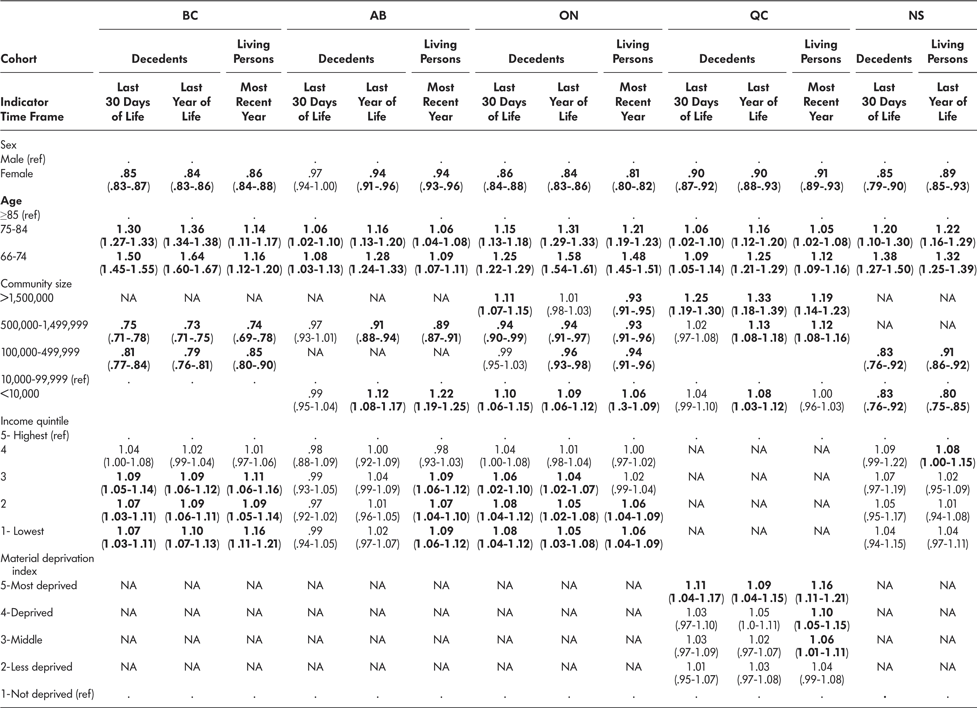
Table 6: Emergency department visits (adjusted rate ratio and 95% confidence interval) for older persons with frailty who died (decedents) and those who were living (living persons).
Note. Statistically significant associations are indicated in boldface.
Table 7: Family physician continuity of care (adjusted rate ratio and 95% confidence interval) for older persons with frailty who died (decedents) and those who were living (living persons)
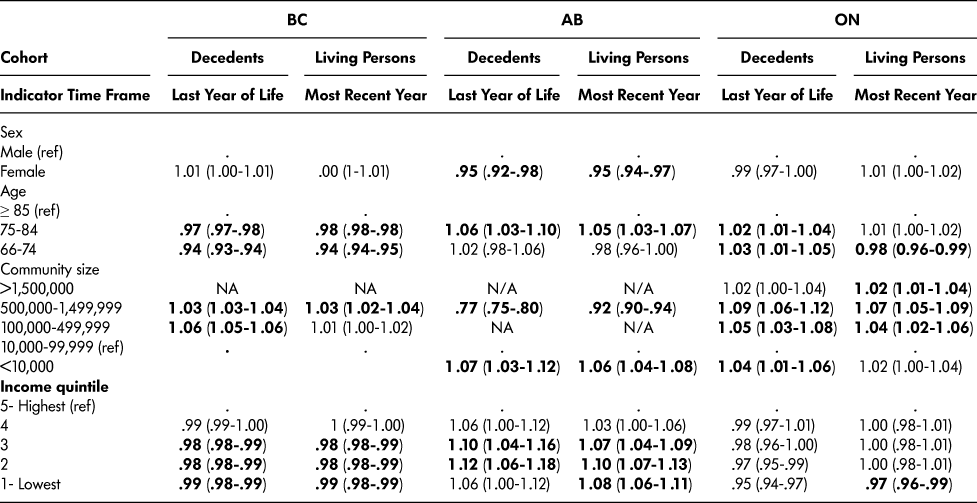
Note. Statistically significant associations are indicated in boldface.
Table 8: Invasive ventilation within 30 days of death (adjusted odds ratio and 95% confidence interval) for older persons with frailty who had died (decedent cohort)
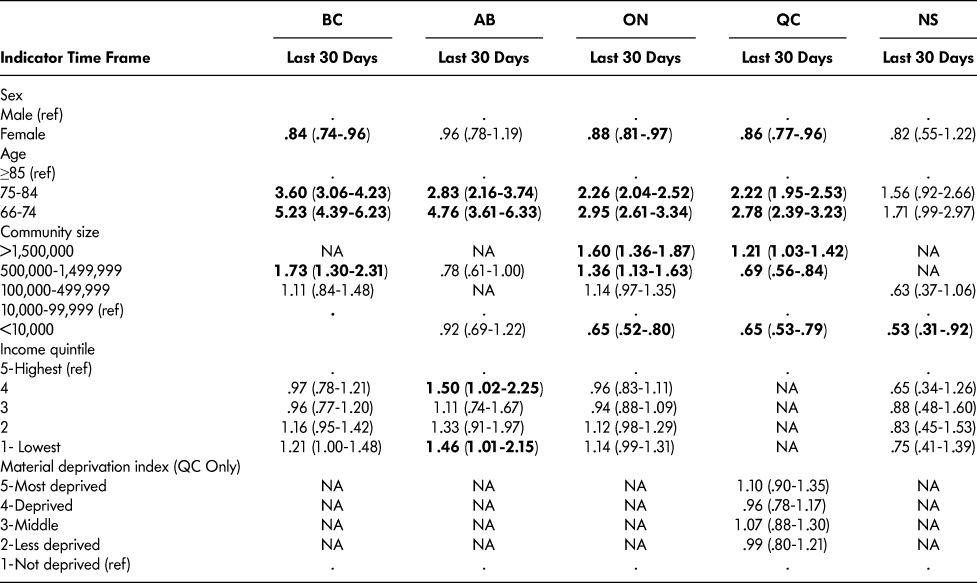
Note. Statistically significant associations are indicated in boldface.
Table 9: Intensive care unit admissions (adjusted odds ratio and 95% confidence Interval) for older persons with frailty who had died (decedent cohort)
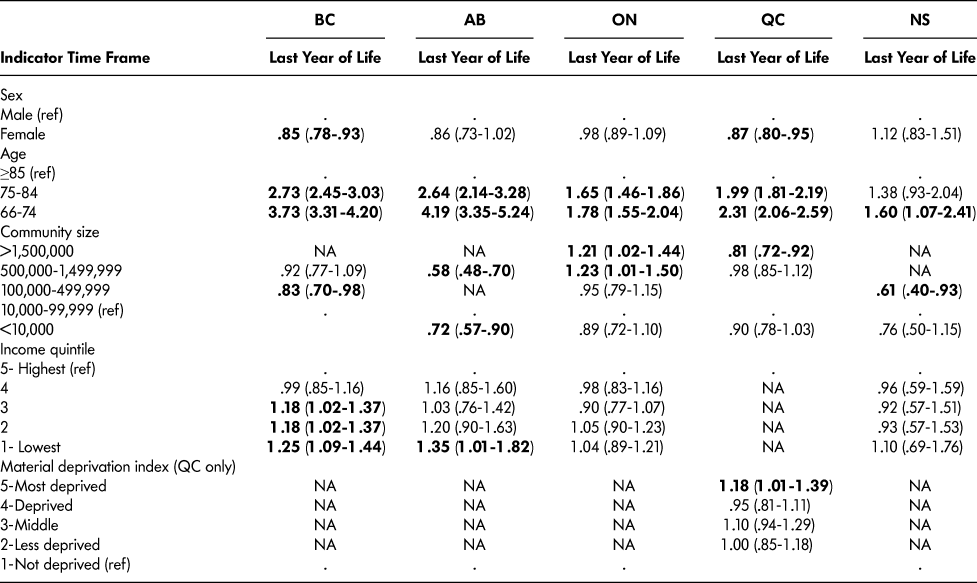
Note. Statistically significant associations are indicated in boldface.
Length of stay in hospital
Decedents with frailty spent, on average, between 3.7 and 10.7 days in hospital during the last 30 days of life, and between 21.1 and 32.6 days in hospital during the last year of life. Living persons spent, on average, between 9.7 and 31.9 days in hospital during the most recent year for which data were available. The number of days spent in hospital (Table 4) was associated with sex in all provinces, cohorts (deceased or living), and time frames with the following exceptions: QC (decedents, last year of life) and NS (decedents, last 30 days of life). Where an association existed, men typically had a higher number of in-patient days. In all provinces, age was consistently associated with the number of in-patient days with individuals who were ≥ 85 years of age spending fewer days in hospital than younger age groups. Although we found associations between community size and number of in-patient days in many cases, there was no clear directionality. Where income was examined, those in lower quintiles spent more days in hospital, with the exception of AB, where income was not associated with length of stay in hospital.
Inpatient readmission
Between 46.3 per cent and 53.8 per cent of decedents had an inpatient readmission within 30 days of a previous discharge, and between 37.2 per cent and 50.5 per cent of living persons had an inpatient readmission. Sex was inconsistently associated with inpatient readmissions (Table 5); however, where associations existed, men were more likely than women to be readmitted within 30 days of discharge. With the exception of AB (living persons), age was associated with readmissions in all provinces and cohorts such that individuals who were ≥ 85 years of age were less likely to be readmitted. Neither community size nor income (or material deprivation in QC) was consistently associated with in-patient readmissions.
ED visits
Decedents had between 0.6 and 2.4 ED visits in the last 30 days of life and between 2.4 and 5.7 ED visits in the last year of life. Living persons had an average of between 1.6 and 3.0 ED visits in the most recent year with data available. The number of ED visits (Table 6) was associated with sex in all provinces, cohorts, and time frames with the exception in AB (decedents, last 30 days of life) such that males had a higher number of visits than females. For all provinces, cohorts, and time frames, increasing age was associated with a decreasing number of ED visits. Although the number of ED visits was associated with community size in all provinces, cohorts, and time frames, with the exception of AB (decedents, 30 days of life), no clear trend was evident. Income was not consistently associated with the number of ED visits.
Family physician continuity of care
Continuity of care was similar for decedents in BC and AB (0.82 and 0.83, respectively) and the same for living persons (0.84). Compared with BC and AB, continuity of care was lower in ON for both decedents and living persons (0.61 and 0.64, respectively). Across provinces, we found lower continuity of care in decedents than in living persons. Continuity of care (Table 7) was only associated with sex in AB such that females (decedents and living persons) had poorer continuity of care than males. Community size was associated with continuity of care in all provinces and cohorts, with older persons with frailty living in larger communities in BC and ON having higher continuity of care than those in smaller communities. In AB however, continuity of care was higher in smaller communities. For all provinces and cohorts, age and income were usually associated with family physician continuity of care, although we found no consistent trends across provinces.
Use of mechanical ventilation during last 30 days
Between 1.4 per cent and 4.9 per cent of decedents were on mechanical ventilation at least once during the last 30 days of life. The use of mechanical ventilation (Table 8) was associated with sex in BC, ON, and QC, where it was more common in men. The likelihood of being placed on mechanical ventilation increased as age increased in all provinces except NS, where there was no association. Community size had an effect in all provinces except AB, such that the mechanical ventilation was less likely to be used in the smallest communities. Income was only associated with the use of mechanical ventilation in AB.
ICU admissions 30 days before death
For decedents, the average number of ICU admissions in the last 30 days of life varied greatly across provinces, from an average of approximately 3 admissions in NS and BC to 16 in ON. Sex was associated with ICU admissions (Table 9) in BC and QC only, where males were more likely than females to be admitted to ICU. Age was associated with ICU admission in all provinces, with the likelihood of an ICU admission decreasing as age increased. Community size was associated with ICU admissions; however, a clear trend was not evident. Where income was associated with ICU admissions (BC and AB only), older persons with frailty in the lower income quintiles were more likely to be admitted than those in the highest quintile. Similarly, in QC, older persons with frailty with the highest material deprivation were more likely to be admitted to ICU than those with the lowest.
Discussion
The aim of this work was to provide an overview of the quality of care provided to older persons with frailty across Canada using administrative databases that are commonly available at the provincial level. Within each province, performance on the selected QIs for each cohort and time frame varied greatly, as evidenced by high standard deviations. Data were available for both deceased older persons with frailty and for those who were alive at the time analysis in four of the five provinces studied (in NS only deceased frail persons were included).
The factor most commonly associated with QI performance was the age of the older person with frailty. In comparison with younger age groups (i.e., 66–74 and 75–84 years of age), persons ≥ 85 years of age typically had fewer days in hospital as well as fewer ED visits, and were less likely to be readmitted within 30 days of discharge, to have an ICU admission, or to be on mechanical ventilation. Overall, there was a trend towards decreasing contact with the health care system as age increased, as well as less aggressive care during hospitalization. The literature suggests that this may be related to patient preferences, as in one study, patients over the age of 80 indicated that they did not want aggressive care and preferred comfort care over life-saving measures (Somogyi-Zalud, Zhong, Hamel, & Lynn, Reference Somogyi-Zalud, Zhong, Hamel and Lynn2002), whereas in another, patients (not all of whom were seniors) felt it was very important that they not be kept on life support when a “meaningful” recovery was unlikely (Heyland et al., Reference Heyland, Dodek, Rocker, Groll, Gafni and Pichora2006). It is also possible that our findings reflect the existence of age-related bias within the health care system, whereby age is viewed as a contraindication for treatment (Higashi, Tillack, Steinman, Harper, & Johnston, Reference Higashi, Tillack, Steinman, Harper and Johnston2012; Protière, Viens, Rousseau, & Moatti, Reference Protière, Viens, Rousseau and Moatti2010). More generally, physicians may view deteriorating health as a normal part of aging (Higashi et al., Reference Higashi, Tillack, Steinman, Harper and Johnston2012), which may lead to less aggressive treatment for older adults because of the belief that ultimately, such efforts would not result in improved patients outcomes.
A sex effect was also evident in this study, with males typically spending more days in hospital and having more ED visits than females. For other QIs, where there was a statistical association with sex, the trend was similar (i.e., males had greater likelihood of in-patient readmission, ICU admission, and mechanical ventilation). Although these findings contrast with a range of studies that report women as having greater and more frequent health care utilization than men in general (Kazanjian, Morettin, & Cho, Reference Kazanjian, Morettin and Cho2004; Owens, Reference Owens2008), amongst older adults (Redondo-Sendino, Guallar-Castillón, Banegas, & Rodríguez-Artalejo, Reference Redondo-Sendino, Guallar-Castillón, Banegas and Rodríguez-Artalejo2006; Tiagi, Reference Tiagi2016), and amongst individuals with dementia (Forbes et al., Reference Forbes, Jansen, Markle-Reid, Hawranik, Morgan and Henderson2008), it is possible that females in the study cohorts did have greater overall health care utilization, but that their use of hospital services was lower. These results are in agreement with other studies that have found that females have greater use of primary and preventative care services than males but fewer hospitalizations (Bertakis, Azari, Helms, Callahan, & Robbins, Reference Bertakis, Azari, Helms, Callahan and Robbins2000; Redondo-Sendino et al., Reference Redondo-Sendino, Guallar-Castillón, Banegas and Rodríguez-Artalejo2006; Woz et al., Reference Woz, Mitchell, Hesko, Paasche-Orlow, Greenwald and Chetty2012), as well as fewer readmissions and ED visits (Woz et al., Reference Woz, Mitchell, Hesko, Paasche-Orlow, Greenwald and Chetty2012). The findings of the current study may also reflect evidence indicating that females are treated less aggressively and offered invasive procedures less frequently than males (Kent, Patel, & Varela, Reference Kent, Patel and Varela2012). Other evidence suggests that poorer compliance with medical advice and delayed help-seeking behaviours amongst males may contribute to the increased use of hospital in-patient services (Courtenay, Reference Courtenay2000; Woz et al., Reference Woz, Mitchell, Hesko, Paasche-Orlow, Greenwald and Chetty2012).
Income was not consistently associated with performance on the selected QIs, but where associations existed, older persons with frailty in lower income quintiles typically had poorer quality of care (i.e., more inpatient days in hospital and ED visits, and greater likelihood of in-patient readmissions within 30 days) than those in the highest income quintile. Similarly, in QC, the material deprivation index (Pampalon et al., Reference Pampalon, Hamel, Gamache and Raymond2009) was rarely associated with the QIs, but where an association existed, those who were more deprived had poorer quality of care (i.e., greater number of in-patient days and ED visits). This is consistent with other Canadian studies that have found higher health care utilization, including increased hospital use, amongst poorer individuals (Allin, Reference Allin2008; Lemstra, Mackenbach, Neudorf, & Nannapaneni, Reference Lemstra, Mackenbach, Neudorf and Nannapaneni2009), which may be partly explained by higher disease prevalence (Glazier, Tepper, Agha, & Moineddin, Reference Glazier, Tepper, Agha, Moineddin, Upshur and Klein-Geltink2006; Lemstra et al., Reference Lemstra, Mackenbach, Neudorf and Nannapaneni2009) and difficulty accessing primary care amongst low-income individuals (Glazier et al., Reference Glazier, Tepper, Agha, Moineddin, Upshur and Klein-Geltink2006).
As this was not a case-control or comparative cohort study, we did not perform any tests of statistical significance between cohorts. Although the cohorts have internal validity; that is, accurately reflect the situation for each cohort only, they differed in years and administrative data availability across provinces. That said, the patterns reported here provide hypotheses to test in future research. For example, the mean length of stay in hospital, number of in-patient readmissions within 30 days of a previous discharge, and number of ED visits are greater, and continuity of care is poorer for decedents (during the last year of life) than for living persons (during the most recent year). This might reflect increased acute care needs near the end of life such that patients sought care from physicians and other services other than their usual care provider. These patterns converge with previous studies that describe the dying experience in Canada as largely a hospitalized experience (Heyland, Lavery, Tranmer, Shortt, & Taylor, Reference Heyland, Lavery, Tranmer, Shortt and Taylor2000). Similarly, an increased reliance on hospital-based services during the end-of-life period (i.e., for decedents) may indicate that current community services do not adequately meet frail seniors’ needs. This would concur with results that found a lack of community-based supports available to older persons to enable them to stay in their own homes, which may have contributed to the increased number of ED visits and readmissions and longer hospitalizations observed for decedents in the current study (Williams et al., Reference Williams, Lum, Morton-Chang, Kuluski, Peckman and Warrick2016). Difficulties accessing long-term care or a lack of support to informal caregivers (Fast, Reference Fast2015) may also contribute to a higher reliance on hospital-based services. Although these data are unable to provide possible explanations for higher rates of hospital-based care in decedents, they do highlight areas for further inquiry.
To describe adequately the quality of care for frail older people, administrative databases should be used in combination with prospectively collected outcomes reported by patients (Organisation for Economic Co-operation and Development, 2017) such as insights on symptoms or quality of life, which can only be provided by the patients themselves (Black, Reference Black2013). The QIs measured in the current study had to be available within administrative databases, but our recent mixed-method study demonstrated that they were well chosen (Giguere et al, in preparation). In that study, we appraised key stakeholders’ (including frail older persons) agreement with a list of 36 QIs, among which all of those used in the current study were listed. We found that stakeholders valued the studied QIs, as they gave mean ratings of 4.0 or higher (agree or strongly agree with the indicator) out of 5 for all. However, of the six QIs extracted, only “Continuity of Care” was prioritized as one of the most valued. Hence, QIs extracted from administrative databases should be combined with patient-reported indicators, such as Patient-Reported Outcome Measures (PROMs) and Patient-Reported Experience Measures (PREMs), to ensure that health care systems changes are aligned with patients’ priorities (Bellows, Young, & Chase, Reference Bellows, Young and Chase2014).
Strengths and Limitations
This study marks the first attempt to examine care for the general population of older persons with frailty in Canada using administrative data. By providing a “snapshot” of care delivery in each of the participating provinces, this work provides a baseline against which future health care delivery may be assessed. More broadly, the current study aligns with the need to improve care through increased use of available health data to provide a complete picture of what happens to people across the pathway of care, as identified at the 2017 OECD Health Ministerial Meeting (Organization for Ecomonic Co-operation and Development, 2017).
Nonetheless, the current study is not without limitations. The identification rules were developed with a focus on specificity over sensitivity. Therefore, all older persons identified as frail met the criteria for frailty as confirmed by expert geriatricians, but some frail older persons may have not have been included (Urquhart et al., Reference Urquhart, Giguere, Lawson, Kendell, Holroyd-Leduc and Johnston2017). Future studies are required to validate the identification rules by testing them against a sample of older people identified by clinicians as frail. Furthermore, patients and their caregivers have reported to us that there are additional QIs, beyond those available from administrative data that should be monitored to ensure high quality care (Giguere et al, in preparation). Nevertheless, patients and caregivers agreed or strongly agreed with all QIs reported herein that are available from administrative data.
Additionally, in our current study, we cannot make direct statistically valid comparisons among provinces because of differences in cohort characteristics, years of data included in the analyses, and differences in how covariates were defined in each province. For example, AB calculated age based on birth month and year whereas complete birth date was available elsewhere, QC was the only province that used the material deprivation index (Pampalon et al., Reference Pampalon, Hamel, Gamache and Raymond2009) as a measure of socio-economic status whereas others used income quintile ,and community size was reported differently across provinces (i.e., BC combined 10,000–99,999 and < 10,000 into a single category, and QC combined 100,000–499,999 and 500,000 into a single category).
As discussed earlier, the QIs assessed in the current study were derived from administrative data and did not take into account patient needs or preferences. As such, definitive conclusions cannot be drawn regarding the appropriateness of care provided. There are also limitations associated with the use of administrative health data for assessing frailty. Specifically, although frailty is multidimensional, and can be influenced by social and psychological factors (Garre-Olmo, Calvó-Perxas, López-Pousa, de Gracia Blanco, & Vilalta-Franch, Reference Garre-Olmo, Calvó-Perxas, López-Pousa, de Gracia Blanco and Vilalta-Franch2013; Makizako et al., Reference Makizako, Shimada, Tsutsumimoto, Lee, Doi and Nakakubo2015), this study is focused on the physical dimension of frailty. In addition, although we recognize that individuals may experience varying degrees of frailty, this could not be assessed in the current study given that disease severity cannot be ascertained from administrative health data.
By examining QIs at the provincial level rather than at the health region or local level, we were unable to examine the extent to which geographical variations in care delivery existed (e.g., service availability), and how this may have impacted the quality of care delivered to older adults living with frailty. Where variations in care are not related to patient need, inequity may exist. Therefore, examination of care delivery at a more granular level is necessary to determine whether older persons living with frailty have equitable access to quality care. We recommend additional research examining geographic variations in care in Canadian provinces, similar to the Dartmouth Atlas (The Dartmouth Institute for Health Policy and Clinical Practice, 2017), a series of reports that document how medical resources are distributed and used in the United States. Such work is needed to inform health care planning and decision making to more effectively address the health care needs of older persons with frailty. Ultimately, QIs are useful for identifying areas of care where potential quality issues may exist; however, further work is required to determine whether or not the care being provided is appropriate, and when it is not, to determine the reasons why.
Conclusion
This study demonstrates the feasibility of using administrative health data to examine the quality of care provided to older persons with frailty in five Canadian provinces. The data provided here may be used at the provincial level to inform decision making relevant to health care delivery and to assess future efforts to improve care. Additional research is required to assess the extent to which the care being delivered to older persons with frailty corresponds to individual needs and preferences, and whether variations in care exist that are driven by other factors.


