


INTRODUCTION
Infectious disease surveillance involves the systematic collection of demographic, risk factor and event data on diagnosed cases of specified infectious diseases, combined with analysis and dissemination of disease information to provide information for action. Recent international examples of emerging infectious diseases, such as Zika virus, Middle Eastern Respiratory Syndrome Coronavirus and Ebola virus, as well as ongoing domestic foodborne outbreaks highlight the importance of a robust and responsive public health infrastructure, of which infectious disease surveillance is a vital component [1].
In Australia (population 21·5 million in 2011), each of the six states and two territories has legislation mandating notification of selected infectious diseases; defines its own notifiable diseases list; collects surveillance information from notifying doctors and/or laboratories; and is responsible for the public health responses to notified cases. Although notifiable disease data have been reported nationally since 1917 [Reference Hall2], Australia lacked a national surveillance system until 1991 when the National Notifiable Diseases Surveillance System (NNDSS) was established by the Communicable Diseases Network Australia (CDNA), on behalf of State, Territory and Australian governments. From 1991, de-identified notification data for diseases on the National Notifiable Diseases List (NNDL) [3] have been forwarded from Australian jurisdictions to the NNDSS. An evaluation published in 2004 concluded that NNDSS was a highly valued and well-used resource on communicable disease activity in Australia, with strengths of acceptability, stability and simplicity, plus relative weaknesses of inflexibility, lack of timeliness, and lack of clearly stated aims and objectives [Reference Miller4]. More recently, fragmentation of data collection, with jurisdictions collecting and storing information differently, has been identified as a barrier to effective national infectious diseases surveillance [5].
The Australian government funds several important public health programmes, including the Immunize Australia Program which provides free vaccination through the National Immunization Program (NIP), and is responsible for managing imported infectious disease risks and national health emergencies [5]. Despite a well resourced healthcare system, a life-expectancy gap of 11·5 years for males and 9·7 years for females at birth persists between Aboriginal and Torres Strait Islander (Indigenous) Australians and non-Indigenous Australians [6]. According to the Australian Burden of Disease Study, in 2010 the years of life lost due to infections was 3·8 times higher in Indigenous compared to non-Indigenous Australians [7]. Furthermore, in an analysis of NNDSS notifications using the dataset evaluated in this paper, notification incidence for all nationally notifiable infectious diseases was 5·3 times higher in Indigenous compared to non-Indigenous Australians in the Northern Territory (NT), South Australia and Western Australia [Reference Gibney8]. In line with the National Indigenous Reform Agreement (Closing the Gap), CDNA has set targets to improve Indigenous status reporting in NNDSS. This will support more accurate reporting of the health of Indigenous Australians and measurement of progress towards closing the gap in Indigenous disadvantage for notifiable communicable diseases [9]. From 2008, this target has been 95% completeness of Indigenous status reporting for 18 priority diseases and 80% for remaining notifiable diseases in NNDSS [10]. The purpose of this study was to describe selected system attributes and changes in surveillance practices over the first 21 years of the NNDSS to inform interpretation of NNDSS data and to identify aspects of NNDSS that could be improved.
METHODS
Information regarding NNDSS and surveillance practices was obtained through discussion with Commonwealth and jurisdictional surveillance staff, annual NNDSS surveillance surveys (2001–2011), and the published literature. Line listed data for all cases notified to NNDSS from 1 January 1991 to 31 December 2011 were reviewed. The study dataset, extracted from NNDSS in 2012, contained 2 438 054 case notifications. This included case notifications received by NNDSS prior to the year the disease was included on the NNDL (for most diseases introduced to the NNDL after 1991, jurisdictions collected case-notification data prior to the disease becoming nationally notifiable and these data were uploaded to NNDSS); case notifications of diseases that were not included on the NNDL during the study period (chikungunya, non-tuberculous mycobacteria, rotavirus and yersiniosis); and cases of Creutzfeldt–Jakob diseases (CJD) which are notifiable to a different national surveillance system [3].
The NNDSS was briefly described, including CDNA goals for national surveillance and relevant legislation. Selected system attributes were evaluated according to the CDC's ‘Updated Guidelines for Evaluating Surveillance Systems’, including flexibility, data quality, and timeliness [Reference German11].
Flexibility was assessed through description of changes in notifiable diseases, data fields, case definitions and technology over the 21-year study period.
Data quality was assessed by examining completeness and validity of the study dataset. Missing data were defined as an observation field which was blank; had non-informative data (e.g. ‘no information provided’); or had a value outside the plausible range (e.g. age <0 years or disease onset date after the study period). For certain variables, data completeness was analysed for a subset of all notifiable diseases as follows: vaccination history for cases aged <7 years and diseases included in the childhood vaccination schedule funded through the NIP; country of acquisition for diseases that are ‘often travel-associated’ based on disease epidemiology (brucellosis, chikungunya, cholera, dengue, hepatitis A, hepatitis D, hepatitis E, Japanese encephalitis, leprosy, malaria, measles, mumps, poliomyelitis, rubella, tuberculosis, tularaemia, typhoid fever); and serogroup/organism for legionellosis, malaria, meningococcal disease (invasive), pneumococcal disease (invasive), and salmonellosis.
In addition to reporting data completeness, we highlighted changes in diagnostic methods and testing practices that potentially impact NNDSS data. We reported changes in the proportion of notified cases diagnosed using different tests across three sub-periods (1991–1997, 1998–2004, 2005–2011). These sub-periods were selected to allow meaningful summary comparison of changes in NNDSS across the entire study. Testing practices were examined using the data-field ‘reason for the diagnostic test’, with the possible responses of ‘clinical presentation’, ‘contact tracing or epidemiological link’, and ‘screening’. Cases notified in a jurisdiction and year in which >50% of cases had this data field complete were included in analysis of testing practices (Tasmania all years, Victoria from 1998, Western Australia from 2001, South Australia from 2007). Reason for testing was compared for the nine most frequently notified diseases (chlamydial infection, hepatitis C, campylobacteriosis, pertussis, salmonellosis, influenza, gonococcal infection, hepatitis B and Ross River virus) which made up 85% of all notifications.
Completeness of reporting of Indigenous status was assessed overall, as well as for 17 of 18 priority diseases for Indigenous status reporting identified by CDNA (excluding HIV which is not notifiable to NNDSS) [10]. The 18 priority notifiable diseases for Indigenous status reporting are: dengue virus (locally acquired), donovanosis, gonococcal infection, Haemophilus influenzae type b, hepatitis A, hepatitis B (newly acquired), hepatitis C (newly acquired), HIV, leprosy, measles, meningococcal disease (invasive), pertussis (age <5 years), invasive pneumococcal disease (age <5 years), invasive pneumococcal disease (age ⩾50 years), shigellosis, syphilis (congenital), syphilis (<2 years duration), and tuberculosis.
Data validity was assessed by examining unexpected patterns in the study dataset and identifying values outside a plausible range, specifically ages <0 years and ⩾110 years; and date of disease onset, specimen collection, and notification outside the study period (before 1991 or after 2011). Due to an unexplained rise in notified cases, the number of cases notified from the NT in 1994 was compared between the study dataset (extracted from NNDSS in 2012) and online (live) NNDSS data that has undergone subsequent updates and data cleaning [12].
Timeliness was assessed by calculating time to notification by disease, jurisdiction, and sub-period. Time to notification was calculated as the number of days from the date of symptom onset (onset date) to the date the notification was received by the jurisdiction (notification received date), where both these dates were reported and the notification received date was after the onset date. Time to notification was calculated by diseases if it could be calculated for at least 100 cases.
NNDSS data were provided by the Australian Government's Office of Health Protection on behalf of CDNA jurisdictional members in March 2012 as an extract from the national data file. The project was approved by the Monash Human Research Ethics Committee and CDNA jurisdictional members. Data were analysed using Stata v. 12 (StataCorp, USA).
Ethical considerations
This project was approved by Monash University Human Research Ethics Committee (project no. CF11/2357-201) and the CDNA. This work did not involve human or animal experimentation.
RESULTS
The CDNA has identified the following goals for national surveillance: identify national trends; guide national policy development and resource allocation; monitor the need for and impact of national disease control programmes; coordinate response to national or multi-jurisdictional outbreaks; describe the epidemiology of rare diseases; meet international reporting requirements (e.g. to the WHO); and support federal government quarantine activities [Reference Gibney8]. The National Health Security Act 2007 provides a legislative framework for the NNDL and exchange of public health surveillance information between Australian state/territory and federal governments and with other countries or the WHO [14]. All eight Australian jurisdictions have signed the National Health Security Agreement which enacts the National Health Security Act 2007 and enshrines the importance of national surveillance and the role of CDNA. By 2011, 65 communicable diseases were notifiable to NNDSS (Table 1). Under their respective public health legislations, jurisdictions received notifiable diseases data from clinical sources (doctors and hospitals) and laboratories. To protect patient privacy, identifying information was removed from case records prior to submission to NNDSS, with the exception of postcode of residence. Jurisdictions were able to re-identify cases if required. Australian Government Department of Health staff were responsible for reviewing, cleaning, analysing and interpreting NNDSS data, which were discussed at the fortnightly CDNA meetings. Aggregate data tables and fortnightly summaries were available on the internet, and quarterly and annual summaries were published in Communicable Disease Intelligence.
Table 1. Diseases included in NNDSS in 1991 (foundation year) and diseases subsequently added to NNDSS by year, Australia 1991–2011
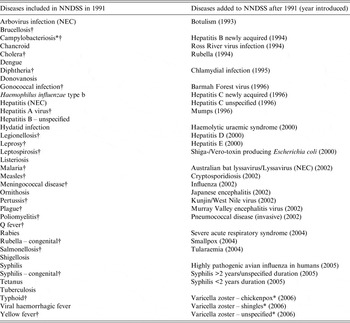
NNDSS, National Notifiable Diseases Surveillance System; NEC, Not elsewhere classified.
* Not notifiable in New South Wales.
† Diseases which were consistently notifiable across states for the entire study period.
Flexibility
Notifiable diseases
In 1991, 37 diseases were nationally notifiable, increasing to 65 by 2006 (Table 1, Fig. 1 a). All 65 diseases were notifiable by all eight jurisdictions, with the exception of campylobacteriosis and varicella zoster virus infections which were not notifiable in New South Wales (NSW). Two diseases were taken off the NNDL during the study period (chancroid and hydatid disease) and four diseases were not included on the NNDL but had cases notified (chikungunya virus disease, non-tuberculous mycobacterial diseases, rotavirus, and yersiniosis). Only 45% of case-notifications received were for diseases that were on the NNDL from 1991. Therefore, much of the observed increase in annual notification numbers can be attributed to the addition of diseases to NNDL (Fig. 1 a). Twenty-one diseases were consistently notifiable across jurisdictions for the entire study period, accounting for 36% of all notifications (Table 1). There is an established process for adding and removing diseases to the NNDL [15].

Fig. 1. Cases notified to the National Notifiable Diseases Surveillance System (NNDSS) by year, Australia 1991–2011.
Case definitions
Case definitions were initially determined by jurisdictions. Uniform case definitions were recommended by the National Health and Medical Research Council (NHMRC) in 1993 [Reference Longbottom16], however, national surveillance case definitions were not used by all jurisdictions until 2005 and have been continually updated since [Reference Miller4, 17].
Data fields
In 1991, NNDSS comprised 12 core data fields, expanding to 25 core data fields by 2011 (Table 2). Four of five mandatory fields – notification identification number, notifying jurisdiction, disease, and postcode – were included from 1991, with notification received date added later. Of the non-mandatory fields, some were relevant to all notified cases (e.g. age, sex, Indigenous status) while others only to selected notifications (e.g. species, vaccination status, outbreak reference). Twenty-three of 25 core NNDSS data fields were included in the study dataset (Table 2).
Table 2. Core data fields of the National Notifiable Diseases Surveillance System, Australia 1991–2011
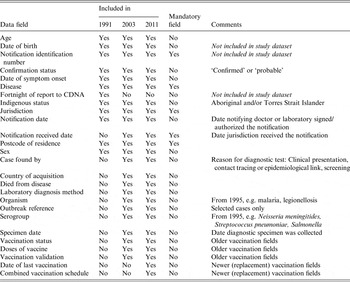
CDNA, Communicable Diseases Network Australia.
Information on included data fields derived from Ponnuthurai et al. 1992 (for 1991) [Reference Ponnuthurai and Hall13]; Miller et al. 2004 (for 2003) [Reference Miller4]; and the study dataset (for 2011).
Notifier
Jurisdictions initially relied heavily on clinicians to notify cases, but during the study period this shifted toward notification by laboratories, supported by legislative changes. For example, laboratory notification was informal in Western Australia from 1991–2005 but was thereafter mandated by the Health Amendment Act 2006. By 2012, the proportion of cases notified by laboratory report alone was ⩾95% in the ACT, NSW, NT, Queensland and Tasmania but only 5% in South Australia [10].
Technology
In 1991, jurisdictions received notifications by paper, telephone and fax, with several jurisdictions later developing capacity to directly import electronic notifications from clinicians. During the study period, electronic laboratory reporting (ELR) became well established in Queensland (from 2002 to 2006, three major pathology providers – each of which notified electronically – serviced more than 90% of the Queensland market [Reference Sweeny and Beard18]) but not in other jurisdictions. Initially, jurisdictional notification data were sent to the Australian Government Department of Health fortnightly in paper form, on diskette or electronically and manually entered into the NNDSS. From 2004, NNDSS has received daily electronic uploads of standardized case notification data from the electronic jurisdictional surveillance systems using a data acquisition system [Reference Miller4].
Data quality
Data completeness is summarized in Table 3. Indigenous status was complete for 44% of all notifications (jurisdictional range 19–87%) and >75% in three jurisdictions (NT, South Australia and Western Australia). For the 17 priority diseases assessed, Indigenous status was reported for 68% of cases (jurisdictional range 42–92%). Vaccination data were reported for 62% (jurisdictional range 32–100%) of relevant cases overall. Country of acquisition was reported for 24% of cases for diseases that are ‘often travel associated’. Completeness of reporting improved for most data fields; however, onset date completeness dropped from 92% to 51% between the earliest and latest periods.
Table 3. Data completeness by sub-period, National Notifiable Diseases Surveillance System – Australia, 1991–2011

Data complete for 97·6–100% of cases for the following fields: age, confirmation status, disease, jurisdiction, notification received date, postcode of residence, sex, and organism.
* Completeness assessed for relevant subset of notified cases.
Laboratory diagnosis methods were reported for 65% of all notified cases (jurisdictional range 0–89%), with completeness increasing over the study period. The proportion of cases diagnosed using PCR increased over each sub-period [1% (1991–1997), 16% (1998–2007), and 49% (2005–2011)] but remained stable for serology (14%, 16%, 13%) and culture (22%, 19%, 19%) (Fig. 1 b). The median annual number of cases diagnosed using PCR increased from 492 (1991–1997) to 74 119 (2005–2011). Of cases diagnosed by PCR, 3·5% were also tested using serology and 3·0% using culture.
Testing practices were analysed for 756 434 (31%) cases. Of these, ‘reason for diagnostic test’ was complete in 89%, with ⩾95% of campylobacteriosis, influenza, pertussis, Ross River virus infection and salmonellosis cases diagnosed because of clinical presentation. In comparison, 78–80% of notified cases of chlamydial infection, gonococcal infection, hepatitis B and hepatitis C were reported as diagnosed through clinical presentation. The reported proportion of cases detected through clinical presentation also differed between Indigenous and non-Indigenous cases (52% vs. 90%).
Data validity
Reported age at onset was <0 years for four cases and >110 years for 36 cases. A spike of 1381 cases aged 99 years likely indicates data entry errors (unknown age was coded as 999). Onset, specimen collection, and notification dates were complete in 62–83% cases. When reported, these dates fell outside the study period for 0·06–0·20% of cases. We identified a discrepancy between the study data extract and NNDSS data published online in data from the NT in 1994: 7267 cases were included in the study dataset compared to 4776 cases reported online. This discrepancy was caused by a change to the ‘notification ID’ used by the NT in 2010/2011, resulting in some existing notifications from 1994 appearing again as new notifications; the error was noted and corrected after the study dataset was extracted in 2012.
Timeliness
Median time to notification [calculated for 1 509 073 (62%) cases] was 8 days [interquartile range (IQR) 4–17 days] for all diseases, decreasing from 11 days (IQR 6–21 days) in the earliest period to 5 days (IQR 3–11 days) in the latest period albeit with jurisdictional variability (Fig. 2). Median time to notification was shortest for hydatid infection, influenza, invasive meningococcal disease, rotavirus, and varicella infection (3 days) and longest for leprosy (31 days), tuberculosis (59 days), and CJD (99 days), potentially reflecting subacute disease onset and diagnostic challenges for these diseases.

Fig. 2. Time (in days) from disease onset to notification received by period and disease group, Australia 1991–2011.
DISCUSSION
During its first 21 years of operation, Australia's NNDSS expanded markedly in terms of number of notifiable diseases and data fields included (indicating system flexibility), as well as marked increases in annual case notifications. NNDSS performance improved over that time, evidenced by better data completeness and timeliness. The increase in notification numbers in the latest period appear partly attributable to improved case ascertainment resulting from changing diagnostic methods (e.g. adoption of PCR), more frequent testing, and a shift from manual clinical notification towards automatic laboratory notification. Our results will help inform interpretation of NNDSS data, including observed changes in notification incidence for selected diseases [Reference Gibney19].
When compared to the CDNA's stated goals for national infectious diseases surveillance [10], NNDSS data can be used to describe the epidemiology of diseases that occur infrequently at state and territory levels, and meet international reporting requirements. The system's capacity to support quarantine activities and effectively coordinate response to national or multi-jurisdictional outbreaks is dependent on notification timeliness, which improved on two levels during the study period. First, the time from disease onset to jurisdictional notification reduced. Second, data uploads from jurisdictions to NNDSS changed from fortnightly to daily. Data completeness likewise improved, which enhances the capacity of NNDSS to guide national policy development and resource allocation, and monitor the need for and impact of national disease control programs. Several factors, including the increased use of PCR testing, likely contributed to improved case ascertainment during the study period. This potentially limits the ability to identify national trends in the epidemiology of infectious diseases using NNDSS data.
The addition (and removal) of diseases and fields and ongoing case definition modifications indicates a flexible system. More recently, however, the system has demonstrated greater constancy, evidenced by fewer changes to the list of nationally notifiable diseases and data fields, and greater consistency between jurisdictions, evidenced by adoption of nationally agreed case definitions and development of the Series of National Guidelines (SoNGs) which promote nationally consistent responses to notifiable disease events [10, 17, 20].
Data completeness improved over the study period for all data fields except onset date. This reflects increasing reliance on notifications from laboratories rather than clinicians. While automated electronic laboratory notifications improve the completeness and timeliness of notifications [Reference Jansson, Arneborn and Ekdahl21–Reference Ward23], increased reliance on laboratory-only notifications could result in reduced data completeness and accuracy for certain clinical, demographic and risk factor fields including onset date and Indigenous status. Jurisdictions can contact the treating doctor and/or case patient and request further data such as onset date; however active follow-up of cases does not occur routinely for all diseases and is not feasible in the era of ELR with jurisdictions receiving tens of thousands of notifications per year. Jurisdictions must decide which diseases warrant active follow-up for public health action, including identification and management of susceptible contacts.
Indigenous Australians, who account for approximately 3% of Australia's population, continue to have worse health outcomes and shorter life expectancy than non-Indigenous Australians [6]. Improving identification in communicable disease reporting should contribute to better health for Indigenous Australians [24], with more accurate quantification of the differential burden of notifiable infectious diseases to inform development and evaluation of targeted policies. During the study period, the CDNA targets for completeness of Indigenous status reporting were not met, although completeness did improve. Additional strategies to improve Indigenous status identification in communicable disease reporting include legislation of mandatory reporting of Indigenous status; documentation of Indigenous status on pathology request forms; a non-defaulting, mandatory data item on Indigenous status in electronic health records; and data linkages with other health-related data sources [24–Reference McAnulty28]. In Victoria, linkage of hepatitis B, hepatitis C and gonococcal infection notification data with hospital datasets improved completeness of Indigenous status reporting from 38% to >99% and resulted in a two- to fourfold increase in notification incidence for these diseases among Indigenous Victorians [Reference Rowe and Cowie26]. Although the analysis of testing practices was limited to less than one third of notified cases due to incomplete data, it was notable that non-Indigenous cases were more often tested as a result of clinical presentation than Indigenous cases. This suggests that some of the excess notification incidence observed for Indigenous Australians [Reference Gibney8] might be a result of screening programmes in this high-risk population.
Completeness of vaccination history for relevant diseases improved during the study period, although missing data remained for 17% of cases in the most recent study period. The Australian Childhood Immunisation Register (ACIR) has recorded details of vaccinations received by children aged <7 years since 1996 [29]. Recently, ACIR records for around 2 million children were linked to notification datasets in Western Australia and NSW to evaluate and inform Australia's immunization programme [30]. Until such data linkage is routinely available throughout Australia, NNDSS must continue to strive for complete and accurate vaccination status data for notified VPD cases.
Country of acquisition provides useful information about the epidemiology of infectious diseases in destination countries, as well as disease risks for travellers to those destinations [Reference Ekdahl and Giesecke31]. It is also important to identify when diseases such as dengue are locally acquired to facilitate appropriate public health interventions. Country of acquisition was only collected for one quarter of cases for diseases defined as ‘often travel-associated’, although this would have improved with retrospective addition of data from two jurisdictions after extraction of study data in 2012. Another risk factor for many infectious diseases, country of birth, is not collected in NNDSS core data fields but could be used to identify at-risk groups requiring targeted interventions to diagnose and/or prevent infection. Country of birth, country of acquisition and postcode data from England's national surveillance system were used to identify large communities of south Asian heritage at particular risk for Plasmodium vivax malaria, specifically when visiting friends and relatives in India and Pakistan [Reference Broderick32]. Country of birth is collected in six of eight Australian jurisdictions [Reference Quinn33] and its addition to NNDSS could enhance the system without imposing significant additional work on notifiers or jurisdictional public health staff.
The system improvement allowing daily electronic data uploads to NNDSS is critical to support coordinated responses to national or multi-jurisdictional outbreaks. Following introduction of an internet-based communicable-disease reporting system in China in 2004, the mean length of time to report from county-level health facility to central level fell from 29 days to 1 day [Reference Ma, Yang and Shi34]. Our observed differences in time to notification between diseases reflect the acuteness of symptom onset; notification source and method also influence notification delay [Reference Ward23]. In Sweden, shorter notification delay was noted for laboratory compared to clinical notifications and electronic compared to paper notifications [Reference Jansson22], with subsequent discouragement of paper-based notification [Reference Rolfhamre35]. The US CDC aims to receive 80% of laboratory reports to public health agencies electronically by 2016 to improve timeliness [36]. Transition of all Australian jurisdictions to ELR would further improve notification timeliness.
The National Framework for Communicable Disease Control (2014) highlights fragmentation of data collection and incompatible data systems as barriers to effective national infectious diseases surveillance in Australia [5]. Several countries, including China, Germany, Ireland, the Netherlands, and Sweden have introduced electronic communicable disease surveillance systems that are consistent between the national and sub-national jurisdictions [Reference Ward23, Reference Ma, Yang and Shi34, Reference Rolfhamre35, Reference Brazil37, Reference Faensen38]. Sweden's integrated surveillance system receives almost all notifications electronically [Reference Rolfhamre35]. In contrast, some Australian jurisdictions manually entered all case notification data, which is time and resource intensive. Electronic notification from both clinicians and laboratories in Australia has potential to improve system simplicity, sensitivity, data completeness and timeliness. A nationally integrated system, which includes the same electronic platform and user interface across jurisdictions, would promote consistent collection and storage of notification data and contribute to a less fragmented system of national surveillance.
Evaluation of sensitivity, predictive value positive, and representativeness of NNDSS is beyond the scope of this study as such an evaluation would require additional data sources that provide the ‘true’ occurrence of disease in the community. These parameters vary markedly between different diseases. Data from the ECDC-funded Burden of Communicable Diseases in Europe (BCoDE) project suggest that case ascertainment for salmonellosis and campylobacteriosis in European countries are disease-, country-, age- and sex-specific [Reference Gibbons39]. It is likely that case ascertainment improved over the study period, including as a result of legislative changes mandating laboratory notification. Our data also suggest that case ascertainment improved over the study period through improved diagnostic tests (particularly NAT) and an increase in testing. Other Australian studies have attempted to quantify the effect of more frequent testing on increased notification rates for chlamydial infection, gonococcal infection, pertussis and influenza [Reference Cretikos40–Reference Kelly43].
In summary, the NNDSS expanded and evolved over its first 21 years, demonstrating flexibility along with improvements in data quality and notification timeliness. Data linkage strategies designed to improve completeness of Indigenous status and vaccination status should be explored to optimise planning and assessment of public health interventions. An increasing proportion of notified cases were diagnosed by PCR, and NNDSS will need to continue to accommodate evolving laboratory diagnostics and testing practices, including whole genome sequencing and antibiotic resistance data, to support optimal public health prevention and control activities. International experience supports the benefits and feasibility of an electronic communicable disease surveillance system that is consistent between the national and sub-national jurisdictions, as well as electronic reporting from laboratories and clinicians. Our findings support the National Framework for Communicable Disease Control's recommendations for an integrated platform that enables real-time assessment of potential outbreaks, automatic electronic laboratory reporting of notifiable diseases to jurisdictional and federal health departments, and formalized linkages with existing data to assure optimised prevention and control of communicable diseases [5].
ACKNOWLEDGEMENTS
The Communicable Diseases Network Australia provided the data to the project team as well as a steering committee that oversaw the project progress and approved publication of this manuscript. The data on which this study is based is the work of many people across Australia. The authors acknowledge the contributions of public health laboratories, state and territory communicable disease control units, public health units and the Office of Health Protection.
K.G., A.C. and K.L. received NHMRC funding. K.G. received a Faculty of Medicine, Nursing and Health Sciences, Monash University scholarship.
DECLARATION OF INTEREST
All authors report no conflicts of interest that influenced writing of this paper. K. Gibney received the NHMRC Gustav Nossal Postgraduate Scholarship sponsored by CSL in 2012. This award is peer reviewed through the standard NHMRC peer review process; CSL does not play any part in the selection of the awardee. K. Leder has received travel support to attend international travel medicine conferences from Sanofi and GSK, which is unrelated to this manuscript.


