


Introduction
Infectious disease outbreaks pose a significant threat to human health. The frequency of such outbreaks is thought to have increased over the past decade. For example, quickly after an epidemic of Ebola virus affected Guinea, Sierra Leone, and Liberia in 2013–2016 [1], chikungunya virus (CHIKV) caused an extensive international epidemic in the Americas and beyond, and was quickly followed by Zika virus (ZIKV) emergence. To date, there have been more than 500 000 confirmed or probable cases of ZIKV but the true number of cases remains unknown [Reference Faria2]. Yellow fever (YF), a vaccine-preventable disease, recently posed major public health problems. In 2015–2016, the largest YF outbreak since the 1980s was observed in Angola and the Democratic Republic of the Congo, causing 962 confirmed cases and 393 deaths [Reference Kraemer3]. YF also poses an ongoing public health risk to large, urban and under-vaccinated populations in the coastal areas of southern Brazil, a country that successfully eradicated YF in the 1950s and 1960s [Reference Kraemer3–Reference Soper5]. Examples of other emerging pathogens that have caused international health security concerns include the severe acute respiratory syndrome (SARS) virus and the Middle East Respiratory Syndrome Coronavirus (MERS-Cov) [Reference Brockmann and Helbing6–Reference Khan9]. This list extends to other pathogens such as influenza, Nipah and henipaviral diseases, and Lassa fever [Reference Friedrich10]. These examples show the continued risks that infectious diseases pose and highlight the challenges of large international outbreaks to epidemic planning and response.
During emerging infectious disease outbreaks, empirical information and mathematical modelling techniques are now commonly used to characterise and predict the spatio-temporal dynamics of the spread of pathogens. Such analyses may help policymakers to evaluate the threat to public health, determine the resources required to reduce disease burden, and guide disease surveillance efforts and the deployment of interventions.
In the last decade, our ability to perform such assessments has been improved by advances in a number of disciplines, including digital disease surveillance [Reference Brownstein, Freifeld and Madoff11], environmental modelling [Reference Pigott12, Reference Pigott13], genomics [Reference Gardy and Loman14] and mathematical modelling [Reference Heesterbeek15]. For example, environmental variables such as rainfall and precipitation [Reference Pigott13, Reference Bhatt16–Reference Shearer22] can be used to better understand the landscape within which the disease may be transmitted, and detailed transmission data from a small sampled population can be extrapolated to larger, un-surveyed areas [Reference Perkins23]. Attempts have been made to illustrate the spatial structure of epidemics mainly using human movement data [Reference Rocklöv24–Reference Kraemer27], to provide mechanistic insights in how the disease may disperse locally [Reference Kraemer3, Reference Johansson28, Reference Cauchemez29] or how effective reactive vaccination campaigns may be [Reference Garske30–Reference Shearer32]. There are continued efforts to reconstruct epidemic dynamics using information derived from pathogen genomic data, which contain unique information about the history of transmission [Reference Faria2, Reference Grubaugh33–Reference Dudas35]. Although each of these disciplines has an established relationship to disease prevention and control, the benefits of integrating them into a unified framework have yet to be fully achieved.
Here we describe the common applications and models used to predict acute viral diseases and discuss the current challenges and limitations. We then outline the advantages of integrating disparate data sources to advance our understanding of epidemic spread. We discuss how such research has been used in recent outbreaks and outline shortcomings that may be addressed in the future.
Reconstruction of transmission pathways using genomic data
Phylogenetic and phylodynamic tools are increasingly being used to infer a range of outbreak properties [Reference Grenfell36]. Common spatio-temporal analyses of pathogen genomes focus on mapping and predicting virus lineage exchange among locations, with the underlying aim of reconstructing the pathways of disease introduction and spread, albeit at a coarse spatial resolution, and often retrospectively [Reference Faria2, Reference Lemey8, Reference Grubaugh33, Reference Dudas35, Reference Pybus, Tatem and Lemey37, Reference Faria38]. An additional feature that can be inferred from genomic data is the timing of individual founder introductions [Reference Lemey39]. Blue arrows in Fig. 1 indicate the time when the first report was published inferring the likely geographic origin of four major international infectious disease outbreaks. Phylogenetic tools can help to characterise the number of introductions that lead to disease transmission in a new location [Reference Faria41], quantify the risk of cross-species transmission [Reference Dudas42], and infer ecological drivers of transmission [Reference Dellicour, Rose and Pybus43, Reference Dellicour44]. Genome-derived estimates have been compared qualitatively to those from epidemiological data, but formal model-based integration of both data sources are rare [Reference Cauchemez45, Reference Fraser46]. In principle, pairing genomic information with epidemiological inference should enable us to quantify the number of cases missed in each location and help to estimate parameters such as the basic reproductive number and doubling time of the epidemic, as done for ZIKV at the tail end of the epidemic (Fig. 1a) [Reference Fraser46–Reference Stadler48]. A common limitation when genetic data are used is the absence of a rigorous and formal sampling scheme. In many instances, genomic sampling is affected by convenience and expedience and may not reflect underlying incidence, although this can be improved post-hoc in large data sets via sub-sampling using, for example continuous phylogenetic inference [Reference Bromham49–Reference Dellicour51]. Strong sampling biases may affect estimates of the arrival time of a pathogen and its pathways of dissemination among locations [Reference Grubaugh33].
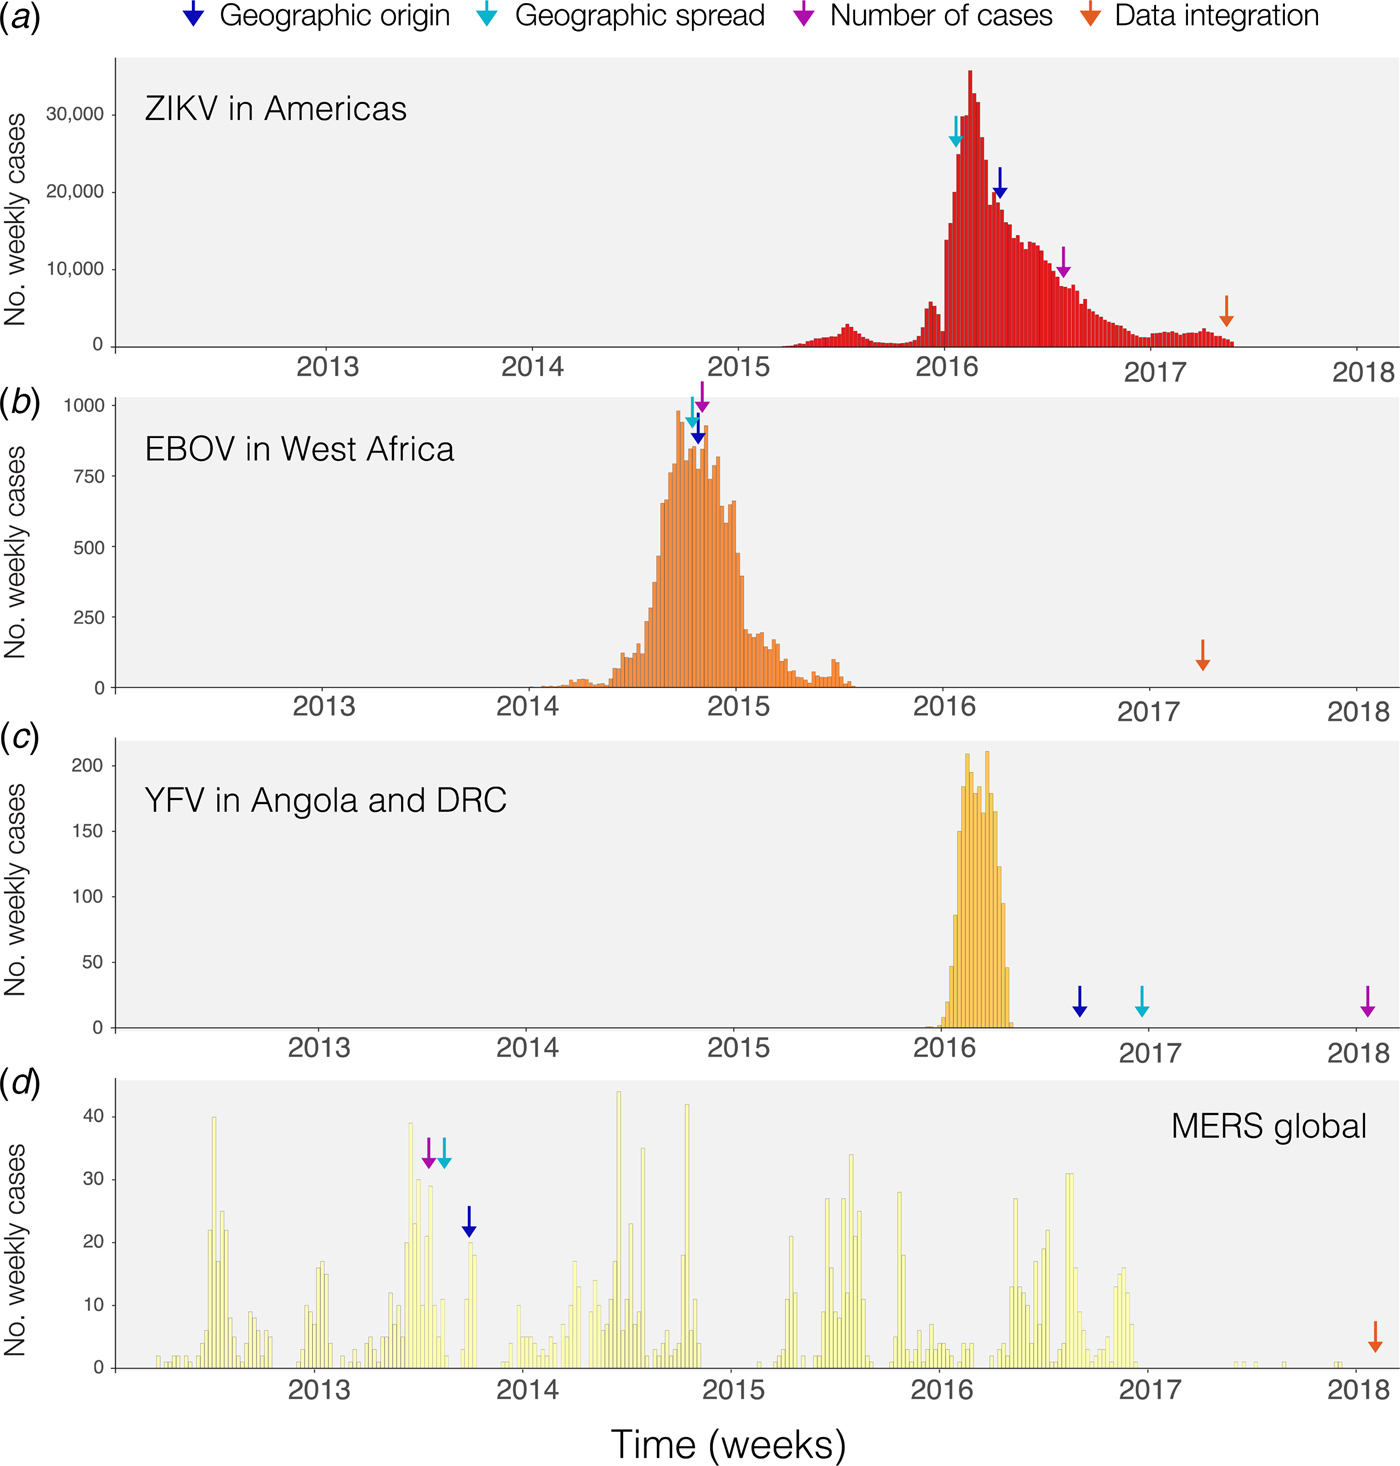
Fig. 1. Timing of publications addressing key questions during outbreaks. Blue shows the first peer-reviewed publication identifying the geographic origin of the outbreak, green shows the date predictions about geographic spread are published, purple shows the date when predictions of numbers of cases are made and red indicates the date when work on the integration of geographic, genomic and epidemiological data was published. (a) Shows weekly cases of the 2014–2017 Zika virus epidemic in the Americas using data from [Reference Grubaugh33, Reference Faria38] and the Pan American Health Organization (PAHO) available from https://github.com/andersen-lab/Zika-cases-PAHO. (b) Shows weekly cases from the West African Ebola epidemic published by the World Health Organization (WHO). (c) Shows weekly cases of the 2015–2016 Yellow fever epidemic in Angola and the Democratic Republic of Congo, published by WHO [40]. (d) Shows weekly cases from 2012 to 2017 Middle Eastern Respiratory Syndrome outbreak available from https://github.com/rambaut/MERS-Cases.
Prediction of disease spread using spatial information
Static disease mapping is a powerful tool to visualise and defines the landscape within which transmission occurs, based on ecological drivers of transmission [Reference Kraemer17, Reference Nsoesie18, Reference Shearer22]. When combined with global data on human travel and mobility, it can be used to understand the global dynamic risk surface of infectious disease, especially when there are strong ecological determinants of transmission, as there are for the vector-borne diseases Zika, dengue, chikungunya and YF [Reference Kraemer27, Reference Bogoch52]. Publication of reports that estimate geographic spread for the diseases in Fig. 1 are indicated by green arrows. The global epidemic history of Zika, for example, remains poorly understood. The challenge to accurately reconstruct the epidemic pathway of the virus is further complicated by its relatively unspecific clinical presentation. This may explain why the initial studies that aimed to understand the geographic origin of the Zika epidemic in the Americas were published relatively late into the epidemic (>1 year, Fig. 1a). For the other major outbreaks highlighted in Fig. 1, estimates of the geographic origin were documented between 6 and 8 months after the first reports of human cases (Fig. 1b–d; Table 1). However, given the underlying ecological determinants of transmission that restrict the reproduction of the virus in the mosquito vector species, large areas can be excluded from the risk of local virus transmission. When overlaying information on the reported presence of Zika cases vs. the underlying ecological risk map, surveillance gaps may be identified [Reference Messina19, Reference Kraemer27]. Areas where there is a mismatch in the predicted presence and reported presence (i.e. cases detected) should be targeted for active surveillance.
Table 1. Key dates and publications describing the geographic origin and spread of four major international outbreaks prediction of the expected number of cases, and integration of geographical, epidemiological and genetic data

The spatial spread process of new pathogens, however, is not only determined by the underlying ecological determinants in each location but also by the dynamic nature of importation, often driven by human movements [Reference Kraemer, Bisanzio and Reiner61]. Spatial models that take into account the patterns of human spread and mobility may, therefore, improve our ability to characterise and anticipate spatial expansion. Different models have been proposed to predict the geographic spread of epidemics but rarely have they been used in real time during the course of an epidemic [Reference Kraemer3, Reference Kramer62] (Fig. 1). For example, during the YF outbreak in Angola and the Democratic Republic of the Congo, estimates of geographic spread to provinces outside Luanda, the capital of Angola, were published >6 months after the last cases were reported (Fig. 1c). Such information could guide public health institutions to decide where and when to implement surveillance and control programs [Reference Kraemer27]. More work, however, is needed to dynamically map the spread of infectious diseases and to extract meaningful and interpretable quantities for public health practitioners.
Characterising disease dynamics and transmission clusters
In parallel to these efforts to model the spread of pathogens at a meta-population level (e.g. between cities, regions, countries or continents), we also need to better understand transmission dynamics at a much more granular level and assess the characteristics of the inter-human transmission. While historically, the potential for inter-human transmission has often been summarised with a single statistic; the reproduction number R (i.e. the average number of secondary infections generated by a case). However, it has long been recognised that it is also essential to assess heterogeneities in individual R values, since the presence of super-spreading events may have a major impact on the risk of emergence and our ability to control outbreaks [Reference Lloyd-Smith63]. This was exemplified in a large MERS-CoV outbreak in South Korea in 2015 in which only a small number of cases were responsible for the majority of infections [Reference Su64, Reference Cho65]. Other factors that may drive the spatial differences in the reproductive number are ecological (population density, climatic factors, or others) and can now be readily incorporated in transmission models [Reference Kraemer66].
Ideally, these assessments should be performed on detailed data documenting chains of transmission, as such data can provide precise quantification of the transmission potential and the impact of targeted interventions in different settings and over time, and allow testing specific hypotheses about the transmission process (e.g. what is the contribution of re-introductions to the overall dynamic?) [Reference Faye67]. However, such data are rarely available as it is difficult to identify the source of infection for most pathogens. As a result, sophisticated statistical techniques are often required to reconstruct chains of transmission and estimate transmission parameters from more limited data that may include: (i) in the context of zoonoses, the size of human clusters [Reference Ferguson68–Reference Blumberg, Funk and Pulliam70] or the proportion of surveillance cases that reported a contact with the natural reservoir [Reference Cauchemez71], (ii) the growth rate in the case count [Reference Wallinga and Lipsitch72–Reference Cauchemez75], (iii) partial data on chains of transmission [Reference Agua-Agum76], or (iv) outbreak data where the timing of symptom onsets and location of cases are recorded in small communities such as households [Reference Cauchemez77–Reference Tsang80], schools [Reference Cauchemez81] or villages [Reference Salje82]. In cases of high-density sampling, genomic data can help to reconstruct transmission chains [Reference Poon83].
Disease outbreak modelling
Mechanistic models of infectious disease dynamics can be used to make predictions about the future course of an outbreak within a given location [Reference Chretien, Riley and George84]. Increasingly, such models are being used in real time, such that predictions are updated every time a new data point becomes available [Reference Andronico85, Reference Camacho86]. Some other applications track pathogen evolution over time as data become available [Reference Hadfield87]. However, the perceived ability of such models to successfully or unsuccessfully make ‘correct’ predictions can generate considerable controversy [Reference Rivers88, Reference Meltzer89]. There are few studies that systematically investigate forecasting accuracy and its relationship to the length of time that is being predicted and to the quantity and quality of data available [Reference Held, Meyer and Bracher90, Reference Lowe91]. Other examples are forecasting challenges for ongoing epidemics such as CHIKV in the Americas (https://www.darpa.mil/news-events/2014-08-15), EVD in West Africa [Reference Viboud92] and seasonal influenza [Reference Andronico85, Reference Biggerstaff93], designed and initiated by funding agencies and public health governments. This is an important area for future research.
Integrating data sources to better characterise infectious disease dynamics
There are clear benefits to combining information from different data sources in order to better predict viral epidemic spread. Previous work most commonly presents estimates from different sources side-by-side, for example, estimates of the epidemic reproductive number derived from genomic vs. epidemiological data [Reference Fraser46]. Such comparisons are important to assess the consistency of data sources and may help to derive new hypotheses. Spurred by technological innovation such as portable sequencing using the MinION device (Oxford Nanopore Technologies, Oxford, UK) [Reference Quick94] and by interdisciplinary collaborations during disease outbreaks, researchers have started to work to combine three types of transmission data: spatial, genomic and epidemiological which have now been published for three of the four major outbreaks we considered here (Fig. 1, red arrows) [Reference Grubaugh33, Reference Faria38, Reference Faria41].
For example, such interdisciplinary work helped to identify the introduction of Zika into the Americas [Reference Faria2], investigated the main drivers of transmission of ZIKV through climatic suitability of its mosquito vectors [Reference Bogoch25] and tried to extrapolate how many people had been infected with the virus [Reference Perkins23, Reference Viboud92, Reference Biggerstaff93]. In the context of phylogenetic analyses, environmental and other spatial data may be helpful in reconstructing the drivers of transmission and spread using, for example, information on the reservoir or host movements [Reference Dudas35, Reference Thézé95]. In turn, phylogenetic information may complement epidemiological analysis by providing more evidence on the transmission routes that are common in an outbreak [Reference Baele96]. This may be particularly useful for diseases that have a highly structured transmission dynamic, such as MERS or SARS, where a small number of people are responsible for the majority of secondary cases [Reference Lloyd-Smith63, Reference Cauchemez97], transmission from the animal reservoir is frequent, or importation drives locally observed epidemics [Reference Grubaugh33]. One common assumption in many epidemiological models is that it is equally likely for people to meet and infect others living in the same location and that population immunity is proportional to the demographic structure [Reference Anderson and May98]. Hence, observed cases are often assumed to arise from other cases that are reported locally as long as they are consistent with the generation time of the disease. However, a well-connected location can, in principle, accrue a large number of incident cases through recurring introductions from elsewhere, rather than via local transmission [Reference Grubaugh33]. These results can have large implications for surveillance and control, as different competing strategies (e.g. limiting importations or eradicating the disease locally) may be considered. While analytical approaches of various degrees of complexity have been proposed to probabilistically reconstruct transmission trees from incomplete outbreak data [Reference Wallinga and Teunis73, Reference Cauchemez81, Reference Cauchemez97], contact tracing, which can be very labour intensive [Reference Faye67], remains a gold standard information source. This may allow us to is to determine the true distribution of cluster sizes (i.e. the number of subsequent cases resulting from each introduction) but is often only available for a small number of locations. However, using genomic data can help refine the understanding of heterogeneity in transmission but such framework does not yet allow to exactly quantify the fraction of observed cases that are attributable to local transmission versus introduction from elsewhere, or to determine how many importations are responsible for the local incidence, despite its crucial importance for eradication campaigns [Reference Dudas42, Reference Lau100, Reference Churcher101]. In the context of the Zika outbreak in Florida, combining genomic data from the outbreak with epidemiological analysis revealed that the outbreak was driven by a large number of introductions rather than by persistent local transmission. In the recent yellow fever outbreak in southern Brazil, linking epidemiological, spatial and genomic data and techniques could provide insights into the transmission potential and risk of urban transmission [Reference Faria102]. One dataset and analysis alone would have not been strong enough to make such conclusions [Reference Grubaugh33].
Inferences about epidemic processes made using mathematical models rely on a number of assumptions. Geographic modelling approaches, mostly informed by spatial ecology, attempt to fill gaps where no data has been observed, hence inferences may be uncertain, as the underlying ecological process may be poorly understood and dynamical aspects of the invasion process are ignored. These deficiencies can be ameliorated, in part, by adding virus genome data that contain information about past transmission and invasion patterns [Reference Messina103]. However, due to incomplete and poor sampling (as discussed above), genomic data alone may provide an incomplete picture of the timing of viral introduction and spread among locations. This, in turn, can be supported by the addition of epidemiological time series of reported cases and serological information about population immunity [Reference Metcalf, Ferrari and Grenfell104, Reference Metcalf105]. Despite this, building a joint inference framework that combines all available data sources and which characterises observation and sampling processes correctly is a daunting task. However, we are entering a period where the data for this task are becoming available in a timely fashion but need to ensure that results are communicated as soon as they are generated in order to avoid delays. Initial successes have already led to important advancements in epidemic control and should progress to a tool-kit for guiding public health, hopefully available in real time for future epidemics.
Author ORCIDs
M. U. G. Kraemer http://orcid.org/0000-0001-8838-7147
Acknowledgements
MUGK is supported by The Branco Weiss Fellowship – Society in Science, administered by the ETH Zurich and acknowledges funding from a Training Grant from the National Institute of Child Health and Human Development (T32HD040128) and the National Library of Medicine of the National Institutes of Health (R01LM010812, R01LM011965). OGP acknowledges support from the Oxford Martin School. SC acknowledges financial support from the Investissement d'Avenir program, the Laboratoire d'Excellence Integrative Biology of Emerging Infectious Diseases program (Grant ANR-10-LABX-62-IBEID), the Models of Infectious Disease Agent Study of the National Institute of General Medical Sciences, the AXA Research Fund. NRF is supported by a Sir Henry Dale Fellowship (204311/Z/16/Z), internal GCRF grant 005073 and John Fell Fund grant 005166. SF was supported by a Wellcome Trust Senior Research Fellowship in Basic Biomedical Science (210758/Z/18/Z).


 Open access