


Introduction
Increasingly, cross-sectional serosurveillance is being used to estimate the fraction of the population previously infected with severe acute respiratory syndrome coronavirus 2 (SARS-CoV-2). Representative seroepidemiological studies reveal the immune landscape of the population, and compared to the use of data based on viral detection, they can provide more accurate insights into the infection fatality rate, the amplitude of transmission in different populations, and highlight disparities in infection rates without typical health-seeking behaviour biases [Reference Bryant1]. Further, such population-level surveys, when coupled with statistical and/or mechanistic models, could be used to estimate the probability and timing of future waves of disease, measure the impact of interventions such as physical distancing or vaccination, and in later stages, confirm the absence of transmission [Reference Patel2]. However, current knowledge of the kinetics of antibody responses to SARS-CoV-2 infection is insufficient to fully realise the array of use-cases for data from population-level seroepidemiological studies. For those designing serosurveys, the choice of antibody assays can be daunting given the number of available tests that target different antigens and isotypes. The aim of this study was to provide new evidence to highlight the best types of antibody biomarkers for estimation of seroprevalence and time-since-SARS-CoV-2 infection, and whether a combination of antibody biomarkers could improve such estimations.
Methods
Data sources
We identified studies in the literature or on preprint servers that measured multiple (>3) antibody responses at varying time points greater than a median of 50 days after PCR-confirmed SARS-CoV-2 infection [Reference Dan3–Reference Whitcombe7]. We used no inclusion/exclusion criteria based on case symptoms nor C t values. We chose this cut off to optimise the capture of data during the period of antibody decay post-infection, considering the potential range of post-infection time points in population-based serosurveys. Data that were not publicly available were obtained on request from study authors. Antibody responses examined included IgG, IgM and IgA responses against spike (S), receptor-binding domain (RBD) and nucleocapsid (N) antigens as determined by ELISA or multiplex bead assays. For each serologic measurement, we extracted the time between the date of serologic sample collection and either date of symptom onset or the date of PCR confirmation (preferred if available), which was termed ‘time since infection.’ For subjects with antibody response measurements at more than one time point, only the last time point was used. Given the lack of a gold standard for specific antibody responses, we do not explicitly account for test performance in antibody detection. We assume that all immunoassays have 100% specificity for detecting recent infection and their decay over time since infections are reflected through decreased sensitivity.
Outcomes and predictor variables
We explored how individual, and combinations of, antibody measurements could identify those who were infected with SARS-CoV-2 and, if infected, their time since the last infection. Using antibody biomarkers measured at different time points post-infection and those collected before the SARS-CoV-2 pandemic, we evaluated the importance and performance of IgG, IgM and IgA antibody isotypes against the nucleocapsid (N), the spike surface protein (S) and RBD antigens in (1) identifying previously infected individuals and (2) their time since infection. We only used binding antibody biomarkers and excluded neutralising antibody results due to the complexity of the assay and variability in methodology.
Model development
We used random forest models to both determine the order of importance of biomarkers and to make our final predictions (1000 random trees, 3 biomarkers per split). Due to the highly correlated nature of the biomarkers, we measured importance using the conditional permutation importance algorithm [Reference Strobl8], which measures the importance of each biomarker conditioned on other associated biomarkers in the model. We used this order of importance to train and test various sized sets of antibody response predictors. We fit the models for each study separately, using the cforest and party packages, and measured importance using the permimp package, in RBD [Reference Strobl8, Reference Strobl9].
Model comparison
In order to assess the predictive performance of each model, we used repeated 5-fold cross-validation (CV) with 100 iterations, where each iteration contained screening (variable importance) and model-fitting steps. Within the cross-validation, we considered predictor sets of sizes 1, 2 or 3 variables. We developed reduced compact models with a maximum of three predictor antibody responses to make our models more applicable to public health practice. We also investigated the performance of the full model in all datasets with available biomarker variables to understand the upper limit. Using this process, we developed two independent models: (1) a model to identify PCR-confirmed infections using biomarkers and (2) a model to estimate time since infection among those previously infected. For the first model, we used PCR confirmed cases and pre-pandemic controls to train a random forest model and assessed performance using the cross-validated area under the curve (cvAUC) [Reference LeDell, Maya and van der Laan10]. Within each iteration of cross-validation, we compared model ROC curves using a permutation test with the function roc.test. We then summarised the P-values across iterations to compare model performance [Reference Venkatraman and Begg11]. For the second model, we used only confirmed cases to train a random forest model for estimating time-since infection and assessed performance using cross-validated mean absolute error (MAE), the mean of the absolute differences of the predictions from the true time since infection.
Results
We extracted and analysed data on PCR-confirmed SARS-CoV-2 infections from five separate studies, with a total of 834 subjects (Table 1). Of the five studies, four of them used enzyme immunoassays, while three of them used Luminex bead array methods. Except for one study (Peluso et al.), all assays were laboratory-developed and not commercial assays. Among a total of 834 subjects, the median time from infection to serologic sampling was 76 (IQR 51–98) days, the median age was 49 (IQR 33–60) years, and the proportion of males was 46.4%. Among the 5 studies, the proportion of patients with severe disease or those who were hospitalised ranged from 7% to 24%.
Table 1. Summary of the characteristics of datasets used in this analysis, with cross-validated AUC (95% CI) from classifying the previous infection on four of the published datasets
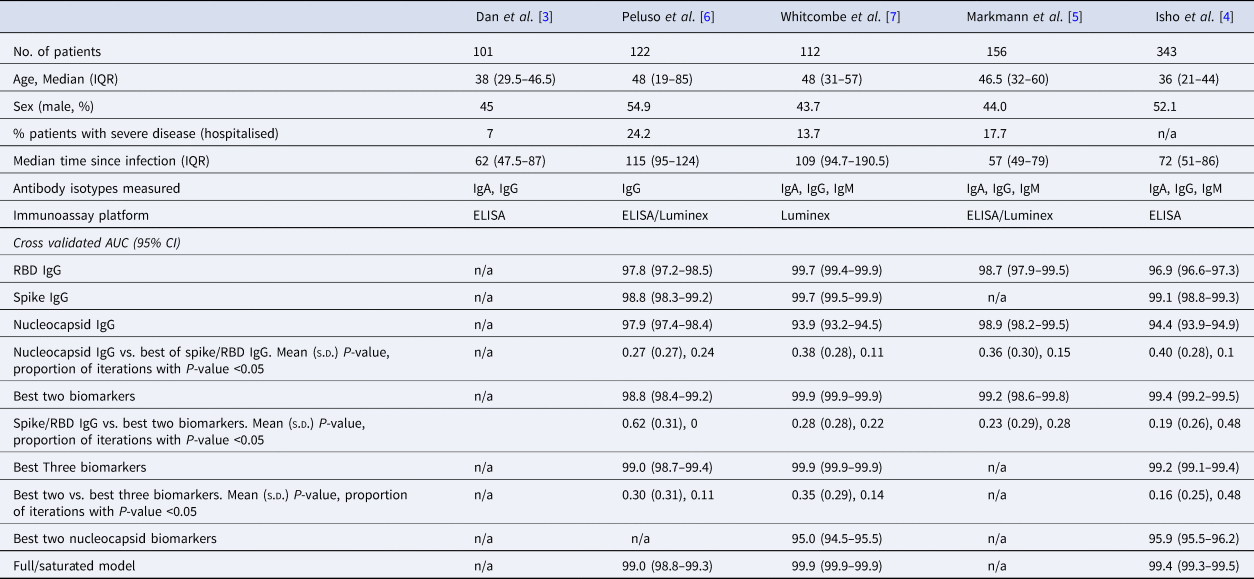
The rows with row-name starting with ‘Best’ include a screening step in which the biomarkers are ordered by importance for classification (ever-infected) using the random forest conditional permutation algorithm and only the top biomarkers from that iteration are used when training the model.
A single antibody biomarker sufficiently identifies the previous infection
We first explored the classification performance of single antibody and isotype thresholds in identifying infection using four of the five datasets with pre-pandemic control data available. We show that across all studies, a single RBD or spike IgG biomarker performs similarly to the combination of the best two biomarkers in identifying prior infection (Spike/RBD IgG vs. Best Two biomarkers, mean P-value: 0.19–0.62; the proportion of iterations with P-value <0.05: 0 to 0.48; Table 1). The addition of a third biomarker did not increase discriminatory performance (Best Two vs. Best Three biomarkers, mean P-value 0.16–0.30; the proportion of iterations with P-value <0.05: 0.11–0.48) in any of the studies examined and further addition of biomarkers resulted in no additional performance benefit (P > 0.05 for all studies).
Two antibody biomarkers are better than one for prediction of time-since-infection
Next, we explored the performance of single vs. multiple biomarker thresholds in predicting time-since-infection. In all five datasets, combining two antibody biomarkers performed better than the best single IgG for estimation of time-since-infection (Table 2). We found that in the four datasets where multiple antibody isotypes are measured, the best two antibody biomarkers included a combination of an IgG and an IgM (or IgA in the one dataset where IgM was not measured, Fig. 1). Addition of the third marker results in a marginal (within s.d.) increase in prediction performance in three of the five datasets (Table 2).
Table 2. Mean (standard deviation) of MAE from predicting time since infection from repeated cross-validation on five published datasets
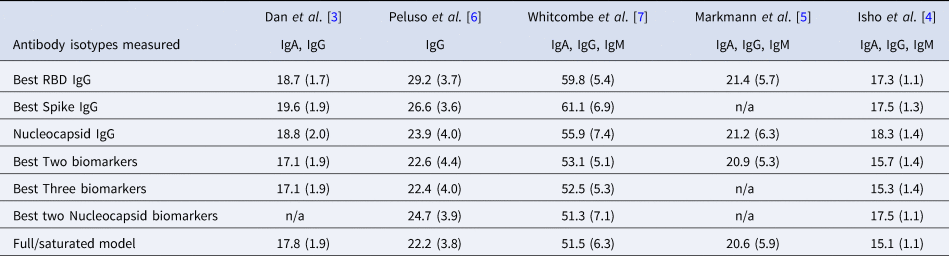
The rows with row-name starting with ‘Best’ include a screening step in which the biomarkers are ordered by importance for time-since-infection using the random forest conditional permutation algorithm and only the top biomarkers from that iteration are used when training the model (low MAE indicates better performance).
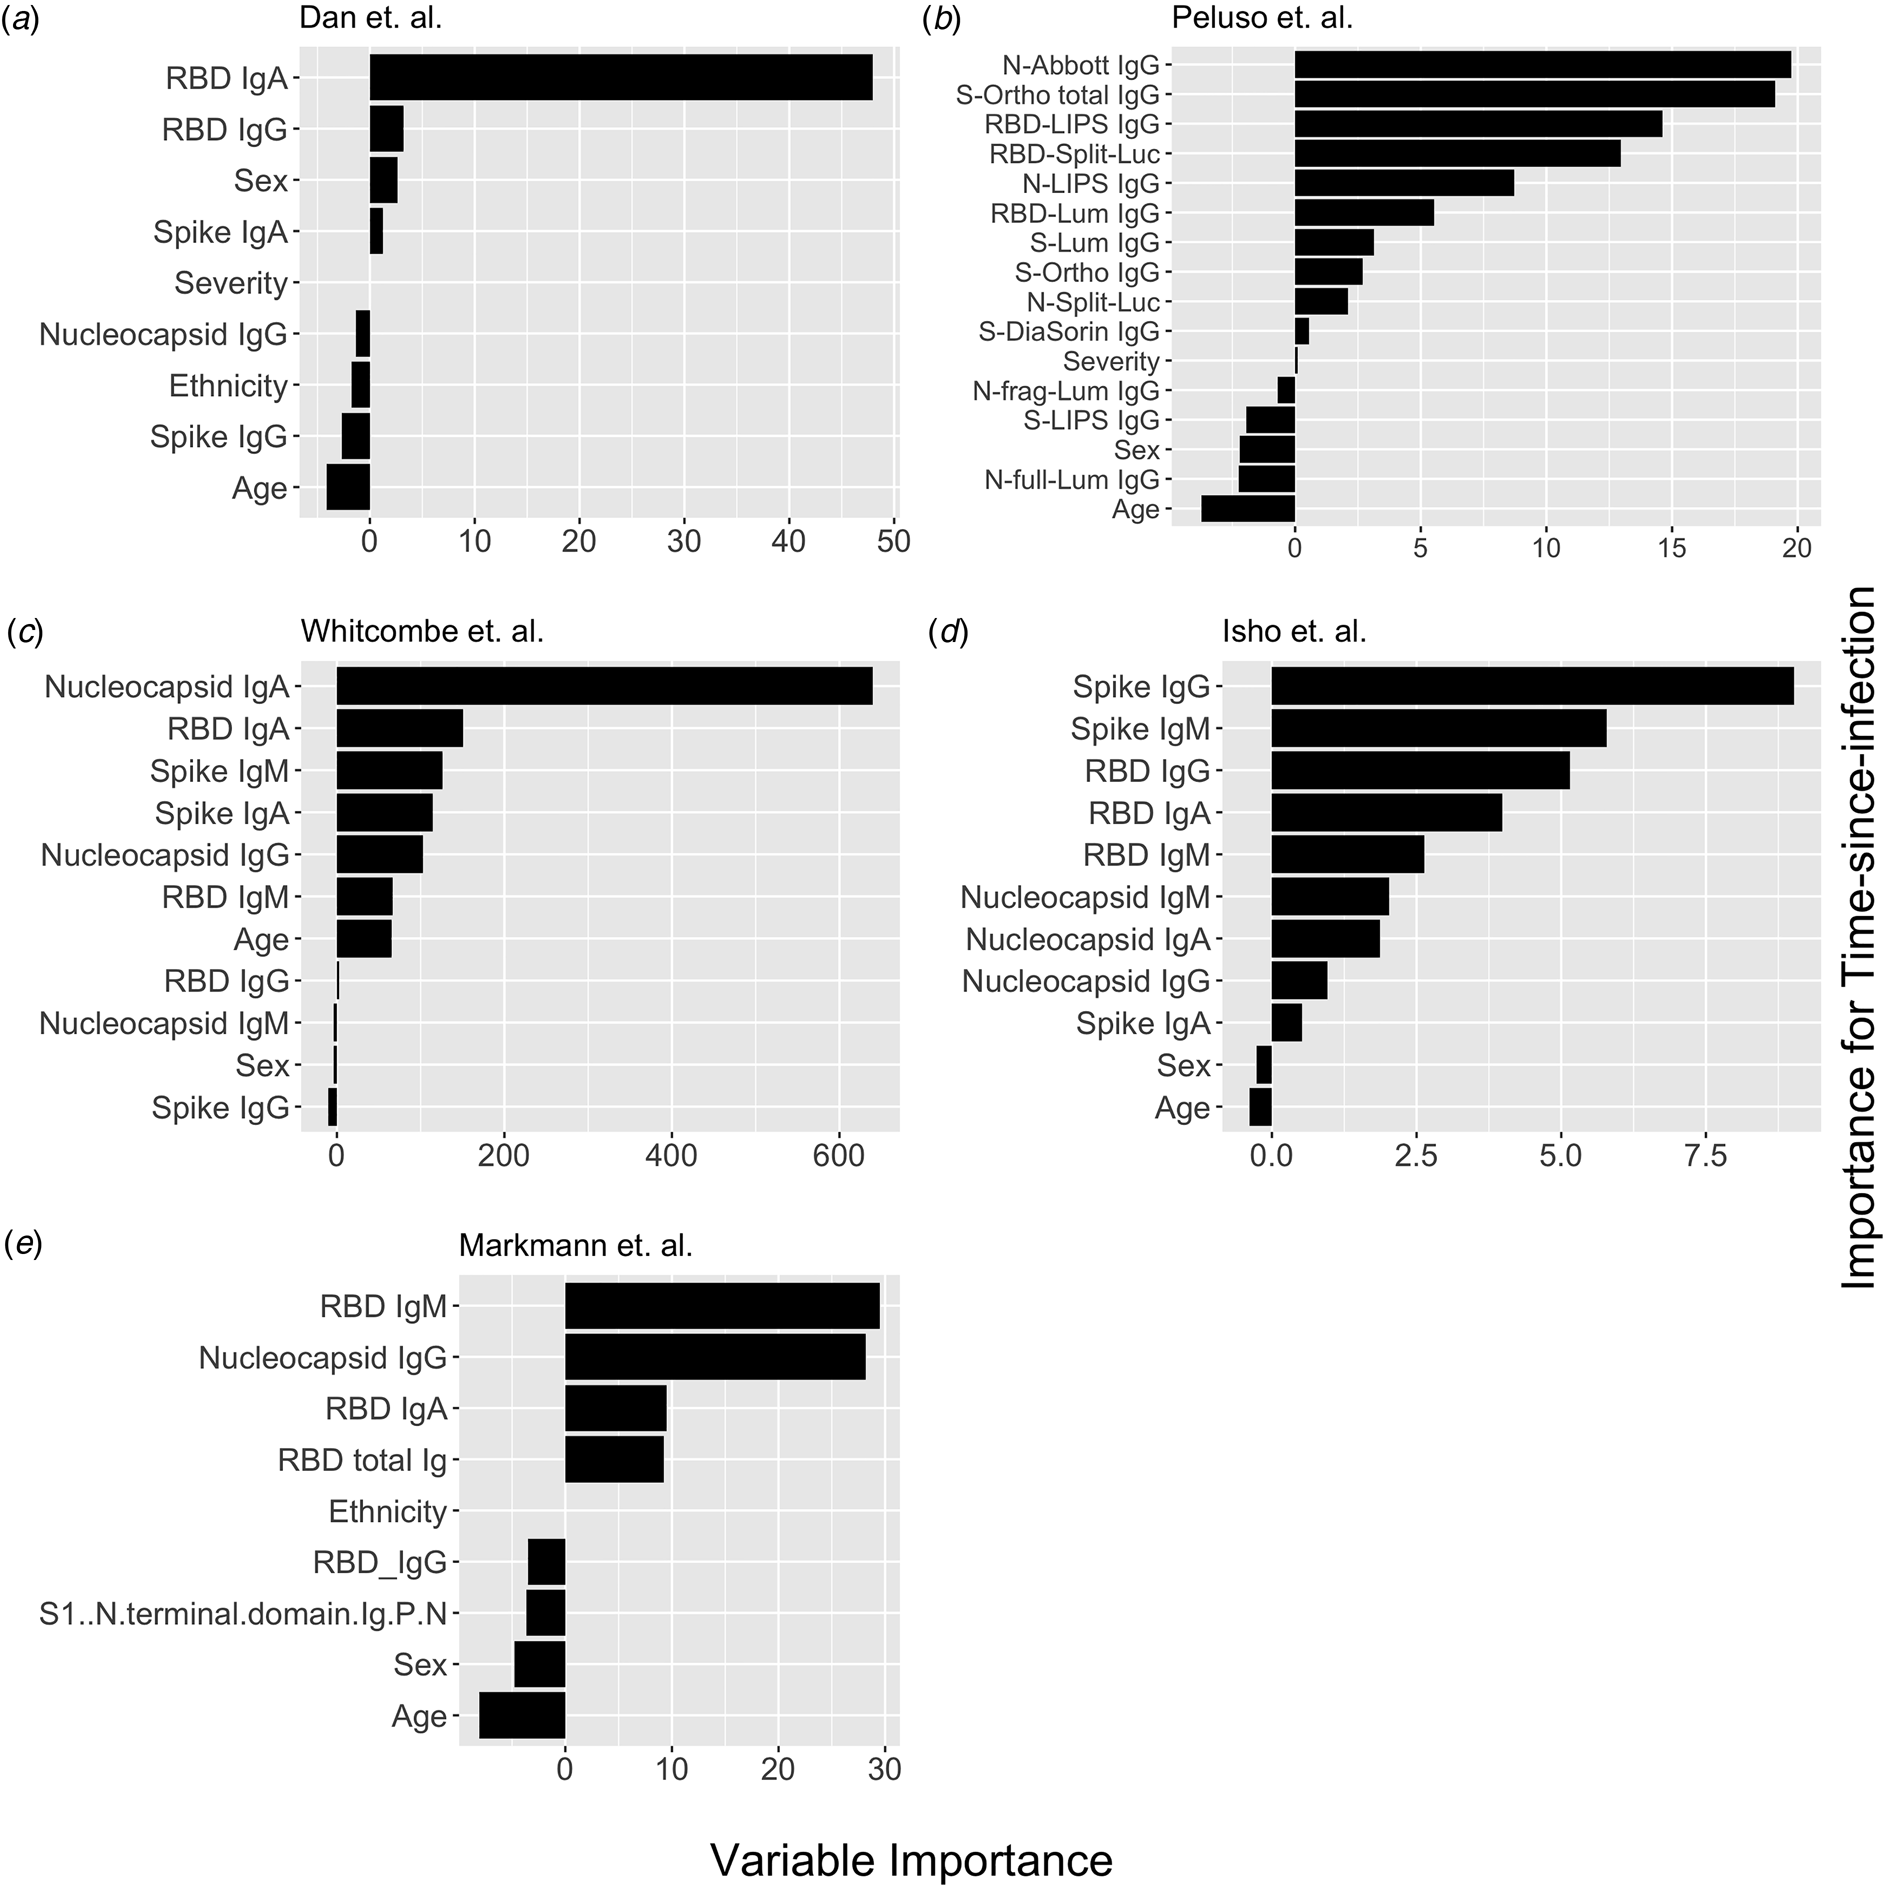
Fig. 1. Conditional permutation variable importance from random forest regression measured by mean decrease in accuracy. Negative importance indicates that the variables inclusion has decreased mean accuracy, probably due to overfitting or random error. Each column represents the order of importance of biomarkers in five datasets. In Peluso et al. dataset, S_Ortho_Ig and S_Ortho_IgG indicate total Ig and S IgG by Ortho Clinical Diagnostics VITROS kits; N_abbott indicate Abbot ARCHITECT (IgG); S_DiaSorin is Spike IgG by DiaSorin LIASON(IgG); Neu_Monogram is Monogram PhenoSense (neutralising antibodies); RBD_LIPS, S_LIPS, N_LIPS is IgG by Luciferase Immunoprecipitation System (LIPS); RBD_Split_Luc, N_Split_Lum, S_Lum, N.full_Lum, N.frag_Lum indicate IgG to respective antigens by Luminex assay.
Nucleocapsid antibody biomarkers are suboptimal for classification of the previous infection, but adequate for estimating time-since-infection
Given that all vaccines approved for use in the USA/EU at the time of writing induce only spike or RBD antibody responses, we examined the performance of nucleocapsid-only combinations of antibodies. For identification of the previous infection, nucleocapsid IgG performed statistically significantly worse than RBD/spike IgG in two of four studies examined. In the two studies where data were available, the combination of the two top nucleocapsid markers (IgG plus either IgM or IgA) improved discriminatory performance (Table 1). On the other hand, for predicting time-since-infection (Fig. 1), a combination of the two top nucleocapsid markers performed similar to, or better than, RBD or spike IgG alone (Table 2).
Discussion
The current COVID-19 pandemic is a major public health concern worldwide, and assessment of infection burden in populations is crucial towards efforts to mitigate its spread and inform policy and decision-making. Population-level serosurveillance has emerged to be a useful method to provide accurate estimates of disease burden, as when done under a representative sampling framework, is not subject to biases related to health-seeking behaviour or testing availability. However, there are limited studies to inform the choice and numbers of antibody biomarkers for SARS-CoV-2 serosurveillance. Here, we leverage antibody decay and differing time-varying sensitivity of various assays to build models using serologic data from five studies of individuals with confirmed SARS-CoV-2 infection, to examine which biomarker(s) are best for identifying prior infection and prediction of time-since-infection. Our results show that while Spike/RBD IgG alone are adequate for discrimination/classification of those who have been infected, combinations of antibody markers may be best for estimation of time-since-infection.
An important consideration in the design of serosurveys is the selection of the biomarker(s), with a goal of minimising cost while capturing enough information about infection, transmission or immunity. Population-level serosurveys are able to not only provide estimates for seroprevalence (proportion with circulating anti-SARS-CoV-2 antibodies), they also have the potential to provide data towards estimating the time-since-infection, which could help with accurate incidence estimation and tracking transmission changes on a population level. Our analysis, using MAE as a performance measure, suggests that a combination of antibodies are the best predictors of time-since-infection. For the majority of studies examined, we found using that using three or more biomarkers only performed slightly better than the use of only two biomarkers. In addition, we show that clinical-demographic factors such as age (and less so severity) were potentially important predictors that should be considered in model-building. Further studies are needed to assess the combined performance of both stages of this model by recreating the epidemic curve through estimation and comparing it to a known epidemic curve.
As COVID-19 vaccines are increasingly made available worldwide, a distinction of vaccine-induced immune responses from that elicited by natural infection is important in the design of seroepidemiologic studies. Identifying infections in vaccinated populations will help estimate the rate of spread. Unfortunately, the most widely used antibody markers for SARS-CoV-2 serosurveillance are the IgG to S or RBD, which is also the target of all currently approved vaccines in the US/EU. Thus, future serosurveillance efforts aimed at assessing infection attack rates may increasingly depend on the nucleocapsid antibody. Our analysis suggests that while nucleocapsid specific IgG alone is inferior to spike and RBD for classification of infection, combinations of N antibodies may improve performance. Notably, for estimation of time-since-infection, the best two N antibodies performed similarly or better than any single S or RBD antibody. Thus, monitoring nucleocapsid specific antibodies may be of utility in distinguishing infection-related antibodies from vaccine-induced antibody response.
A number of research questions and goals remain for SARS-CoV-2 seroepidemiology. First, our conclusions regarding the use of biomarkers for SARS-CoV-2 serosurveillance are based on internal cross-validation of models built using datasets featuring antibody responses for up to 200 days from the time of symptoms onset or diagnosis. Detailed characterisation of the kinetics of serologic responses through longitudinal cohort studies of infected persons of varying severity will enable the development of more tailored and precise statistical models of recent infection. Second, in addition to commercial platforms, standardisation of serosurvey reagents, such as through publicly available monoclonal antibody standards, and/or reference positive sera, will enable a broader application and validation of seroepidemiological analytical models. Third, the development of point-of-care antibody testing will enable serosurveillance to be better performed in more austere environments. The use of dried blood spots from finger pricks in low resources settings could reduce cost while obviating the need for cold-chain storage [Reference Whitcombe7]. Fourth, high-throughput multiplex platforms such as Luminex technology [Reference Rosado12] could enable the measurement of numerous SARS-CoV-2 serological markers alongside markers against other infectious pathogens of interest.
There were a number of limitations in this analysis. The lack of longitudinal immune responses and lack of detailed time-since-infection data may have led to larger error predicting time-since-infection. Our analysis was limited to studies of adults in high-income countries, and thus our results cannot be generalised to low- and middle-income countries, or to paediatric populations, and underscore the need for a better understanding of the kinetics of SARS-CoV-2 antibody responses across diverse populations. Despite this, our findings contribute towards informing the choice of antibody responses for seroepidemiological investigations of SARS-CoV-2.
Author contributions
M. S. B., A. S. A. and D. T. L. designed and directed the project. M. S. B. and B. J. B. contributed to data analysis. M. S. B. and D. T. L. wrote the paper. All authors discussed the results and commented on the manuscript.
Financial support
This work was supported in part by the National Institutes of Health (R01 AI135115 to D. T. L.), with funding in part from the National Center for Research Resources and the National Center for Advancing Translational Sciences of the National Institutes of Health, through Grant UL1TR002538 (formerly 5UL1TR001067-05, 8UL1TR000105 and UL1RR025764), and the NIH SeroNet Serocenter of Excellence Award (U54 CA260543).
Conflict of interest
All authors reported no conflicts of interest.
Data availability statement
All code and data are deposited at https://github.com/LeungLab/EstimateSeroprevalenceCovid.


 Open access