


A nutrition paradox exists such that children can be overweight or obese and still be deficient in vital nutrients needed for growth and development due to the overconsumption of poor-quality food( Reference Markovic and Natoli 1 ). For example, child Fe deficiency is linked to both cognitive and behavioural delays as well as obesity( Reference Nead, Halterman and Kaczorowski 2 ), and is an example of the ‘double burden’ of malnutrition from a vital micronutrient in coexistence with obesity( Reference French, Story and Jeffery 3 , Reference Jeffery and Utter 4 ). In the USA, obesity prevalence for children aged 2–5 years more than doubled between 1976 (5 %) and 2012 (14 %)( Reference Ogden, Carroll and Kit 5 ), and declined to 8 % in 2014( Reference Ogden, Carroll and Kit 6 ). The prevalence of obesity (14 %) in low-income children in Oklahoma( Reference Weedn, Ang and Zeman 7 ) is higher than the national average (8 %)( Reference Ogden, Carroll and Kit 5 , Reference Ogden, Carroll and Kit 6 ).
Fifty-six per cent of children of pre-school age (3–5 years) in the USA attend full- or part-time child care and children with full-time working mothers spend an average of 38 h/week in non-parent care( Reference West, Wright and Hausken 8 ). Pre-school children are at a critical stage for appropriate growth, cognitive development and establishment of healthy food preferences( Reference Skinner, Carruth and Wendy 9 ). However, dietary reports by caregivers reveal that the intake of US pre-school children fell short of the Dietary Guidelines for Americans for total (saturated and unsaturated) fat and vitamin E by 47 % and 37 %, respectively( Reference Butte, Fox and Briefel 10 ). Since child-care centres (CCC) serve as a primary social environment to the majority of children in the USA, they play a significant role in influencing eating behaviours in this nation’s young children.
Oklahoma state regulations and policies require that CCC menus provide nutritionally adequate meals fulfilling at least one-half to two-thirds of macronutrient and micronutrient RDA for children in full-day child care( 11 ). Few studies have both analysed and compared the nutrient content of CCC menus with Dietary Reference Intakes (DRI)( Reference Wu, Hertzler and Miller 12 – Reference Frampton, Sisson and Horm 14 ). DRI are determined by the Food and Nutrition Board of the Institute of Medicine as a cohesive estimation of nutrient intakes for Americans and include the Recommended Daily Allowance, Adequate Intake, Tolerable Upper Intake Level and Estimated Average Requirement( 15 ).
Most studies that have evaluated CCC menus based on the Food Guide Pyramid established by the US Department of Agriculture were published a decade or more ago( Reference Johnson, Guthrie and Smiciklas-Wright 16 , Reference Munoz and Krebs-Smith 17 ). A recent study reported that the lunch menu for children attending CCC did not meet the DRI for carbohydrate, dietary fibre, Fe, vitamin D and vitamin E( Reference Frampton, Sisson and Horm 14 ). Evaluation of CCC menus provides valuable insight into what is reportedly served to children over a larger area and more feasible than in-person visits. However, it does not provide information on food preparation methods or what was actually consumed, demonstrating the need for observational studies to expand upon CCC meals. An observational study in North Carolina found that children consumed only 13 %, 17 % and 21 % of whole grains, vegetables and fruits, respectively, in reference to the MyPyramid daily requirements( Reference Ball, Benjamin and Ward 18 ). A similar study in New York City reported that only 17 % of 3–4-year-old children met at least half of the MyPyramid requirements for vegetables and 58 % did not consume enough fruits( Reference Erinosho, Dixon and Young 19 ); consistent with a 1997 survey by the US Department of Agriculture that found 16 % of older children failed to meet any food group requirements for vegetables, grains, meats, beans or milk( Reference Munoz and Krebs-Smith 17 ). The above studies, in addition to the limited nutritional observations and CCC menu deficiencies in this state, support the need for observation of CCC lunches and dietary intake in Oklahoma CCC.
The purpose of the present study was to assess the energy, macronutrients (carbohydrate, protein and total fat) and micronutrients (Ca, Fe, Mg, Zn, vitamins A and E and folate) served to and consumed by children of pre-school age (3–5 years) in Oklahoma CCC during lunch and compare them with the RDA established in the DRI. Examining the macronutrient and micronutrient consumption among pre-school children attending CCC, especially in a geographic region of high overweight and obesity risk, is of significance to evaluate healthy eating practices. Discovering the nutrient intakes of children in Oklahoma CCC will assist in providing information on possible areas to improve CCC nutrition standards and, consequently, how health and early-care education professionals can influence those dietary changes.
Experimental methods
Study design
This was a cross-sectional, observational study conducted from 2011 to 2014. CCC were recruited via telephone from rosters of CCC maintained by the Department of Human Services and the Oklahoma Tribal Child Care Association. Seventy-six centres were contacted; twenty-five scheduled; twenty-nine were interested but not scheduled due to demands involved with ongoing observation; twenty-three were not interested or did not return recruitment telephone calls (Fig. 1). The observational design of the study permitted passive consent, meaning the procedure for lunch observations was completed unless a parent specifically requested his/her child not participate. This request was made for two children. There were 706 eligible children, of whom 415 were observed at lunch. Not all children could be observed due to the required observer:child ratio explained below. Demographic variables (sex, age and race) were obtained from 322 of the 415 children (78 % participation rate) whose parents signed a consent form and provided that voluntary information on a short survey. The study was conducted according to the guidelines articulated in the Declaration of Helsinki and under the approval of the University of Oklahoma Health Sciences Institutional Review Board.
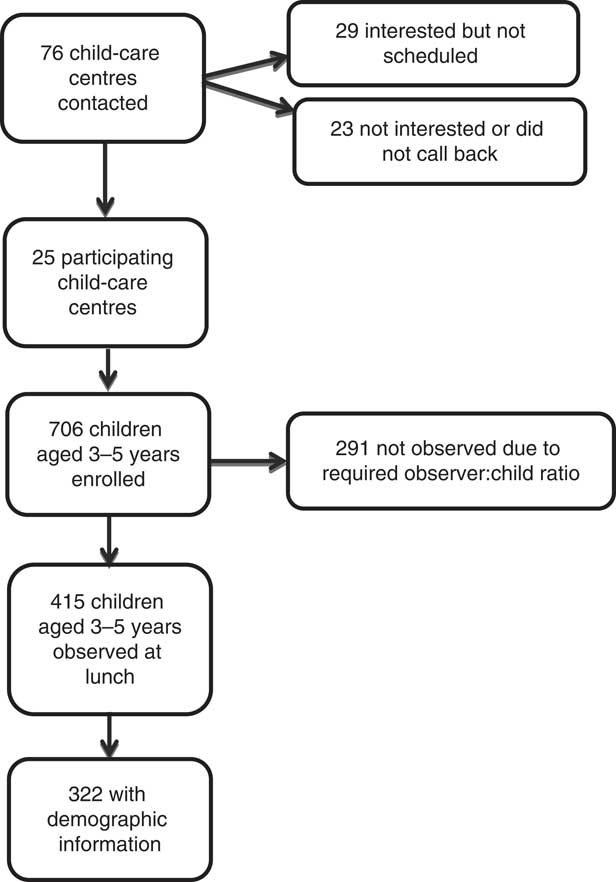
Fig. 1 Recruitment of children for participation
Dietary assessment
The Dietary Observation for Child Care (DOCC) form was used by trained researchers to assess all foods and beverages served to and consumed by pre-school children at lunch in CCC( Reference Ball, Benjamin and Ward 20 ). Per lunch period, one researcher observed three children( Reference Ball, Benjamin and Ward 20 ). Inter-rater reliability between researchers was high across twenty different foods (intra-class correlation coefficient=0·968, P<0·001). Two lunches were observed per child and averaged for analyses. Observation days were an average of 14·2 d apart. If two lunch observations were not possible (27 %; 111 of 415), a single observed lunch was used for analyses since there was no significant difference using a paired t test between day 1 and day 2 for children with both days (P≥0·05).
At the time of observation, the person responsible for CCC food preparation was interviewed for brands and types of food used, food preparation methods and recipes for mixed dishes. For example, if the lunch menu contained spaghetti, green beans and pineapple, the trained researcher would ask, but not limited to, the following questions: (i) ‘What brands of spaghetti noodle and sauce were prepared?’ (i.e. Great Value, General Mills, etc.); (ii) ‘What type of spaghetti noodle was served?’ (i.e. white, whole wheat, etc.); (iii) ‘Was there meat in the spaghetti sauce, if so, what kind?’ (i.e. if ground beef, what percentage of fat to meat); (iv) ‘Were the green beans fresh, frozen or canned?’; (v) ‘Were there additives applied during cooking of the green beans?’ (i.e. fats such as butter, sugar, salt, etc.); (vi) ‘Were the pineapples fresh, frozen or canned?’; (vii) ‘If canned, canned in its own juices or with added sugar?’.
FoodWorks® version 12 (The Nutrition Company, Long Valley, NJ, USA) nutrient analysis software (in conjunction with the US Department of Agriculture food database) was used to determine the nutrient content of lunches by entering foods used, food preparation methods and recipe information of foods served to and consumed by the children. Nutrients (and associated measuring units in accordance with the RDA incorporated in the DRI) included: kilocalories of energy; grams of protein and carbohydrate; percentage of total fat; milligrams of Ca, Fe, Mg and Zn; micrograms of vitamin A, vitamin E and folate. Previous literature that studied a single meal among children at CCC used one-half or one-third portions of dietary requirements as acceptable protocol( Reference Ball, Benjamin and Ward 18 ). To maintain consistency, the DRI for the above mentioned nutrient values was divided by three to represent one-third of the daily intake to be consumed during one of the three meals typically consumed in a day. Since the age range of the present study spanned 3–5-year-olds, all lunch data were compared with two age-based DRI categories: 1–3-year-olds and 4–8-year-olds( 15 , 21 ). Energy intake recommendations are based on the child’s level of physical activity( 15 , 21 ) and range from 5021 to 5858 kJ (1200 to 1400 kcal) for 3-year-olds and from 5021 to 6694 kJ (1200 to 1600 kcal) for 4–5-year-olds( 15 , 21 ).
The 2005 DRI base energy intake recommendations on a child’s physical activity level, also referred to as Estimated Energy Requirements (EER)( 15 , 22 ). The rounded medians of EER for 3-, 4- and 5-year-old girls are 5627 kJ (1345 kcal), 5941 kJ (1420 kcal) and 6276 kJ (1500 kcal), respectively. The rounded medians of EER for 3-, 4- and 5-year-old boys are 5858 kJ (1400 kcal), 6109 kJ (1460 kcal) and 6548 kJ (1565 kcal), respectively( 15 , 22 ). MyPlate provides a recommended range for energy intake, also based on the child’s physical activity level (3-year-olds at 5021–5858 kJ (1200–1400 kcal) and 4–5-year-olds at 5021–6694 kJ (1200–1600 kcal))( 21 ). Since the 2005 DRI and MyPlate energy recommendations fall well in line with one another, and base a young child’s energy intake on his or her physical activity level and age, this one-third range was used in all analyses: 3-year-olds at 1674–1954 kJ (400–467 kcal) and 4–5-year-olds at 1674–2230 kJ (400–533 kcal)( 21 ). Similar methods were used for total fat because a recommended range also exists( 15 , 21 , 22 ).
Statistical analysis
Means, standard deviations and frequencies were computed for demographic variables. Dietary data are presented for the entire sample while demographic data are presented for the smaller sample. Means, standard deviations and 95 % confidence intervals were computed for dietary outcomes. The one-third age-based DRI reference standards (1–3 years and 4–8 years)( 15 , 21 ) were compared with the 95 % confidence intervals to determine significance. If the DRI for a given nutrient was outside the 95 % confidence interval, the value was significantly different from the DRI. Nutrient values higher or lower than the recommendation were determined by examining the mean and DRI value. The proportion of children receiving insufficient, adequate or excessive energy was determined based on the one-third age-based DRI for kilocalorie ranges. Analyses were conducted in autumn 2014 with the statistical software package IBM SPSS Statistics version 19.
Results
From the twenty-five CCCs across Oklahoma, fourteen were located within Oklahoma City and Tulsa metropolitan areas, and eleven located in more rural communities. The average capacity of the CCC was eighty-seven children with a range between fifteen and 197. CCC were classified in the tiered star system that represents child-care quality and subsidy reimbursement status( 23 ). The majority (64 %) were categorized as a 2-star centre, three were 1-star and six were 3-star( 23 ). Four hundred and fifteen pre-school children participated in the lunch observation aspect of the study. Of the 322 participants for whom demographic data were collected, 53 % were male and the mean age was 3·8 (sd 0·7) years. Forty-two per cent of participants were White, 32 % were American Indian or Alaska Native, 17 % were African American or Black, 5 % were Hispanic or Latino and 4 % were Native Hawaiian, Pacific Islander or other. The majority of children (64 %) attended the Oklahoma City and Tulsa area (i.e. urban) CCC.
Macronutrients served compared with both age-based recommendations are shown in Table 1. On average, served energy and total fat met recommendations for both 1–3-year-olds and 4–8-year-olds. When examining the proportion of children served inadequate, sufficient or excessive energy compared with both DRI age ranges, 49 % were inadequate (for both), 19–29 % were adequate (1–3-year-olds and 4–8-year-olds, respectively) and 22–33 % exceeded (4–8-year-olds and 1–3-year-olds, respectively). Served protein and carbohydrate significantly exceeded the one-third of both age-based recommendations, by a mean of 16–18 g and 8 g more, respectively.
Table 1 Macronutrients served to 3–5-year-old children (n 415) for lunch in Oklahoma child-care centres, USA, 2011–2014
DRI, Dietary Reference Intake.
* DRI value represents one-third of the daily recommended intake value, to accurately compare with the lunch-time meal.
† Mean macronutrient content of foods served was significantly different (based on 95 % CI) from the 1–3-year-olds’ DRI.
‡ Mean macronutrient content of foods served was significantly different (based on 95 % CI) from the 4–8-year-olds’ DRI.
Macronutrients consumed compared with both age-based recommendations are shown in Table 2. Total fat consumed was within the recommended range for both age-based recommendations. On average, energy consumed was significantly lower than one-third of both age-based recommendations; children consumed between 368 and 925 kJ (88 and 221 kcal) too few. When examining the proportion of children consuming inadequate, sufficient and excessive energy compared with both DRI age ranges, 76 % were insufficient (both ages), 11–17 % were adequate (1–3-year-olds and 4–8-year-olds, respectively) and 7–13 % were excessive (4–8-year-olds and 1–3-year-olds, respectively). Carbohydrate consumed was inadequate by 6 g. Protein consumed was significantly higher than both age-based recommendations; children exceeded protein recommendations by 10–12 g.
Table 2 Macronutrients consumed by 3–5-year-old children (n 415) for lunch in Oklahoma child-care centres, USA, 2011–2014
DRI, Dietary Reference Intake.
* DRI value represents one-third of the daily recommended intake value, to accurately compare with the lunch-time meal.
† Mean macronutrient content of foods consumed was significantly different (based on 95 % CI) from the 1–3-year-olds’ DRI.
‡ Mean macronutrient content of foods consumed was significantly different (based on 95 % CI) from the 4–8-year-olds’ DRI.
Micronutrients served compared with both age-based recommendations are shown in Table 3. Served Zn exceeded recommendations for both the 1–3-year-olds and 4–8-year-olds. Served Ca met the 4–8-year-olds’ recommendation. Served vitamin E was significantly lower than one-third of the 1–3-year-olds’ recommendation; children were served a mean of 0·6 mg less. Served Ca, Fe, Mg, vitamin A and folate were significantly higher than one-third the recommendations for 1–3-year-olds; children were served a mean of 111·2 mg, 0·5 mg, 39·2 mg, 149·9 µg and 21·9 µg more, respectively. Served Fe and vitamin E were significantly lower than one-third the 4–8-year-olds’ recommendations; children were served a mean of 0·5 mg and 0·9 mg less, respectively. Served Mg, vitamin A and folate were significantly higher than one-third of the recommendations for 4–8-year-olds; children were served a mean of 22·6 mg, 116·6 µg and 5·2 µg more, respectively.
Table 3 Micronutrients served to 3–5-year-old children (n 415) for lunch in Oklahoma child-care centres, USA, 2011–2014
DRI, Dietary Reference Intake.
* DRI value represents one-third of the daily recommended intake value, to accurately compare with the lunch-time meal.
† Mean micronutrient content of foods served was significantly different (based on 95 % CI) from the 1–3-year-olds’ DRI.
‡ Mean micronutrient content of foods served was significantly different (based on 95 % CI) from the 4–8-year-olds’ DRI.
Micronutrients consumed compared with both age-based recommendations are shown in Table 4. Consumed Zn and folate were sufficient for the 1–3-year-olds according to recommendations. Consumed Fe and vitamin E were significantly lower than one-third of the 1–3-year-olds’ recommendations; children consumed a mean of 0·4 mg and 1·0 mg less, respectively. Consumed Ca, Mg and vitamin A were significantly higher than one-third of the recommendations for 1–3-year-olds; children consumed a mean of 26·1 mg more, 20·5 mg more and 55·0 µg more, respectively. Consumed Ca, Fe, Zn, vitamin E and folate were significantly lower than one-third of the values recommended for 4–8-year-olds; children consumed a mean of 73·9 mg, 1·4 mg, 1·0 mg less, 1·3 mg and 18·4 µg less, respectively. Consumed Mg and vitamin A were significantly higher than one-third of the 4–8-year-olds’ recommendations; children consumed a mean of 3·9 mg more and 21·7 µg more, respectively.
Table 4 Micronutrients consumed by 3–5-year-old children (n 415) for lunch in Oklahoma child-care centres, USA, 2011–2014
DRI. Dietary Reference Intake.
* DRI value represents one-third of the daily recommended intake value, to accurately compare with the lunch-time meal.
† Mean micronutrient content of foods consumed was significantly different (based on 95 % CI) from the 1–3-year-olds’ DRI.
‡ Mean micronutrient content of foods consumed was significantly different (based on 95 % CI) from the 4–8-year-olds’ DRI.
Discussion
With the majority of children of pre-school age in the USA attending full- or part-time child care( 24 ), CCC have a significant role regarding eating habits and providing nutritious food for young children. The current study determined macronutrient and micronutrient contents of lunches served to and consumed by pre-school children (3–5 years old) in CCC across the state of Oklahoma, and compared those values with age-based DRI. Protein served to all sampled children exceeded the DRI by up to 3·5 to 5 times. In fact, at the single lunch meal, children were served approximately 170 % and consumed up to 120 % of their recommended protein for the entire day. Even though the mean energy served was within acceptable ranges and the mean energy consumed was inadequate, some children were served (22–33 %) and consumed (7–13 %) excessive energy. Percentage total fat served and consumed was within acceptable ranges, although total fat consumed was at the very low end of the acceptable range for the 1–3-year-olds’ DRI. With the exception of Fe and vitamin E, micronutrients served were in adequate or excessive amounts. Moreover, consumption did not necessarily reflect what was served. For instance, adequate Ca, Zn and folate were served yet consumption was deficient when compared with the recommendation for 4–8-year-olds.
The comparison of what is both served to and consumed by pre-school children with the DRI has been sparsely reported( Reference Erinosho, Dixon and Young 19 , Reference Nicklas, Liu and Stuff 25 ). Typically, studies have assessed food served to( Reference Erinosho, Dixon and Young 19 , 26 ) or consumed by( Reference Nicklas, Liu and Stuff 25 , Reference Bollella, Spark and Boccia 27 – Reference Erinosho, Berrigan and Thompson 31 ) children of pre-school age, but not both( Reference Nicklas, Liu and Stuff 25 ). Older studies between 1997 and 1999 compared served lunches with RDA and found that children exceeded protein requirements but were below in energy( 26 ); similar to current findings. However, dietary intake was ascertained from parental reports( Reference Briley, Jastrow and Vickers 28 ) not an unbiased, trained researcher. Other parental reports showed that the nutrient intakes for pre-school children across the USA were below the RDA in vital micronutrients such as Fe and Zn( Reference Butte, Fox and Briefel 10 , Reference Briley, Jastrow and Vickers 28 ) and macronutrients such as fat( 26 ). An update to the older studies and inclusion of observed dietary intake rather than parental reports and menu analyses are needed to expand present literature. Some of the findings of the current study, albeit using a different methodological approach, support previous literature.
The Feeding Infants and Toddlers Study (FITS; 2002–2008) reported that 2–5-year-olds consumed a mean of 50 g protein/d ( Reference Butte, Fox and Briefel 10 ) which translates to 17 g/meal, similar to our findings of 16 g protein consumed at lunch by the sampled 3–5-year-old children. Given differences in methodology (use food recalls and FFQ rather than observation at child care) this supports the high protein intake of young children. Literature that discusses protein consumption is usually in reference to clinical manifestations (i.e. physiological functions such as sarcopenia)( Reference Fulgoni 32 ) and further exploration among younger children is warranted, especially if there are potential adverse effects of intake so much higher than recommendations and the sources of the high protein intake.
US children (2–18 years) had previously been reported to consume an extra 456 kJ/d (109 kcal/d) between 1989 and 2008( Reference Keast, Fulgoni and Nicklas 33 ), yet the present observational study found all children were served energy within age-based recommendations. Current findings of an average of 1305 kJ (312 kcal) consumed are similar to the average of 1418 kJ (339 kcal) consumed at Head Start centres in Texas( Reference Nicklas, Liu and Stuff 25 ), despite differences in measurement (observation v. digital photography, respectively). Despite sampled CCC serving the acceptable DRI range of energy, it may be of benefit to err on the lower end of the caloric recommendation to aid in obesity prevention efforts, especially if children are not physically active. Pate( Reference Pate 34 ) found that children are predominantly inactive while at child care. Conversely, if children are very active, they may require more nutrients and overall energy. Therefore, lunch-time eating behaviour may be of value for CCC to investigate to help individualize how much children consume; that is, serving style of ‘seconds’ to aid children determine whether they are still hungry( Reference Sisson, Campbell and May 35 ).
Vitamin A( 26 ), folate( Reference Bucholz, Desai and Rosenthal 30 ) and Fe( Reference Butte, Fox and Briefel 10 , Reference Bucholz, Desai and Rosenthal 30 ) were previously examined via parental reports and menu analysis, only as served, to be deficient. Our study found that served and consumed vitamin A conflicts with the previous reports as it exceeds both age-based DRI. Folate served was higher than both recommendations but intake was deficient compared with the 4–8-year-olds’ recommendation. The inconsistency in folate findings is noteworthy as it is needed for proper cellular function and deficiency can quickly lead to megaloblastic anaemia( Reference Bailey and Gregory 36 , Reference Suskind 37 ). Further, current results reveal Fe served was higher than the recommendation for 1–3-year-olds but deficient for the recommendation for 4–8-year-olds; intake was deficient compared with both DRI. As stated above, Fe served from prior studies was deficient( Reference Bollella, Spark and Boccia 27 , Reference Bucholz, Desai and Rosenthal 30 ) and of concern due to its relationship to cognitive development in young children( Reference Pollitt 38 , Reference Rivera, Hotz and Gonzalez-Cossio 39 ). However, a study with similar observational methodologies found that the micronutrient quality of meals (both lunch and afternoon snack) served to and consumed by children aged 1–12 years (with the majority being pre-school children) met one-third of 4–6-year-olds’ RDA for Fe( Reference Bollella, Spark and Boccia 27 ). Inconsistent findings regarding Fe intake could be due to inclusion of older children and hence higher recommended serving amounts in Bollella et al.’s study( Reference Bollella, Spark and Boccia 27 ). Many of these previous studies examining micronutrients were published over 5 years ago and used methodologies that rely on food reports rather than direct observation; further exemplifying the need for current observation-based studies to help understand what children are being served and consuming in CCC.
Strengths of the present study include that nutrient values were compared with DRI, allowing comparison with recommended nutrient standards( 15 ). Inclusion of both urban and rural Oklahoma CCC increases the generalizability of findings and representation of this population; although not all contacted CCCs, nor all children of each CCC, were interested in participation which may indicate some degree of selection bias. Additionally, the large sample size of children representing the entire state is one of the largest studies to date. Two observed lunch meals for the majority (90 %) of children enhances representation of regular consumption patterns and enhances the quality of the previous literature, which has predominantly relied on parental and CCC reported values. All researchers were rigorously trained and passed a practical examination. To physically weigh lunches would be infeasible; especially to ascertain the volume consumed by 415 involved participants and considering waste immediately discarded by teachers or children. To address potential researcher bias, teachers were instructed to continue regular classroom lunch practices. However, precise volume of food and details on preparation methods may have added error to the nutrient values calculated. Cooking staff may have altered lunch preparation during observation times; however this is considered unlikely, as menus were often prepared weeks in advance of the observational visits at lunch.
Conclusion
In conclusion, the present study demonstrated that macronutrients and micronutrients served to and consumed by children of pre-school age at CCC in the state of Oklahoma exceed some recommendations such as protein, and are deficient for other nutrients such as Fe and folate. On average, energy served and consumed was within desired ranges for these pre-schoolers, although at the higher end of the range and some children did exceed energy recommendations. Given that recommended energy intake ranges are based on energy expenditure and the high levels of sedentary behaviour at CCC( Reference Pate 34 ), even serving energy within recommendations may be contributing to the obesity epidemic if the energy expenditure side of the equation is not addressed at CCC. Additionally, while food quality and food groups contribute to energy intake( Reference Johnson, Guthrie and Smiciklas-Wright 16 , Reference Munoz and Krebs-Smith 17 ), these factors were not examined in the scope of the present study. But it is logical to presume that if children are fed foods high in quality (i.e. less Na, more fibrous options such as legumes and more fruit and vegetable variety) then they would consume higher nutrient profiles without exceeding energy needs. Future research should examine the role of energy intake, energy expenditure, overall quality of foods and the association with overweight and obesity( Reference Nicklas, Liu and Stuff 25 ).
Given that consumption did not necessarily reflect what was served, the importance of serving pre-schoolers foods that are nutrient dense with a variety of micronutrients and perhaps err on exceeding the recommendations to ensure adequate intake is underscored. It may be detrimental for CCC to focus on particular macronutrients and micronutrients, however, because that could lead to the exclusion of other foods. For example, if CCC were to focus on Ca and protein from milk, that may lead to inadequate intake of Fe and protein from food sources such as legumes. Future research is clearly needed to better understand the influence that peers and caregivers have on what foods are served to children, and then what they consume. Future studies and projects that can actually work with CCC to create and implement healthy eating education and programmes are another area of emphasis. Perhaps studying the quality of foods in comparison to their macronutrient and micronutrient compositions can aid the knowledge of future caregivers and CCC staff. Nutrition education of parents and CCC is essential to promote healthy growth and development. Public health nutritionists are in key roles to influence the level of nutrition knowledge of parents, CCC and policy makers, to ensure children of pre-school age are receiving the best nutrition possible.
Acknowledgements
Acknowledgements: The authors would like to extend their appreciation to all the participating CCC directors for taking the time to contribute to this research study. Financial support: This project was supported by the Gretchen Swanson Center for Nutrition and the Stephenson Cancer Center at the University of Oklahoma Health Sciences Center, as well as the University of Oklahoma Health Sciences Center, Department of Nutritional Sciences and the Infants, Toddlers, Twos and Threes Research Initiative of the University of Oklahoma. The funders had no role in the design, analysis or writing of this article. Conflict of interest: None. Authorship: Each author listed has seen and approved the contents of this manuscript and therefore takes full responsibility for this manuscript. Study design: S.B.S., R.A., D.M.H., J.E.C. and M.P.A. Data collection: A.H.R., S.B.S., R.A. and L.K.S. Analyses: A.H.R., S.B.S. and M.P.A. Interpretation: A.H.R., S.B.S., M.P.A. and D.M.H. Writing: A.H.R., S.B.S., D.M.H., J.E.C., M.P.A. and L.K.S. Ethics of human subject participation: This study was conducted according to the guidelines articulated in the Declaration of Helsinki and all procedures involving human participants were approved by the University of Oklahoma Health Sciences Institutional Review Board (16064 and 16217).


