


Currently, epidemiological studies recognise the influence of diet on the risk of different diseases such as CVD, diabetes, obesity or cancer(Reference Willett1). As an example, it has been proven that different eating patterns such as the Mediterranean diet(Reference Ferrer-García, Granell Vidal and Muñoz Izquierdo2) include the intake of high levels of specific compounds like polyphenols(Reference Visioli, Borsani and Galli3), which in turn are associated with different beneficial effects(Reference Finicelli, Squillaro and Di Cristo4). Polyphenols are a heterogeneous group of plant secondary metabolites with more than 8000 different compounds described, and many of them are associated with health benefits(Reference Kardum and Glibetic5). Phenolic compounds are divided into several subclasses: anthocyanins, flavanols, flavonones, flavones, flavonols, hydroxybenzoic acids, hydroxycinnamic acids, isoflavones, lignans, proanthocyanidins and stilbenes(Reference Manach, Williamson and Morand6).
Consequently, it is clear the importance of being able to calculate the amount of these compounds that are regularly ingested with the diet. The first step for the estimation of polyphenol intake is the use of a reliable method for food intake evaluation, such as 24-h diet recalls (24hR) or FFQ(Reference Probst, Guan and Kent7). The 24hR provide more detailed information than FFQ(Reference Rossi, Bassett and Sammán8); however, 24 h have some problems: (a) in order to be the representative of the usual intake, the information must be collected over several days; and (b) they are also more uncomfortable and take longer to fill than FFQ(Reference Pinto and Santos9). On the other hand, FFQ are usually the methodology of choice since they are cheaper and easier to apply(Reference Grosso, Stepaniak and Topor-Mądry10–Reference Zhang, He and Liu12). However, they are based on a fixed list of foods in which there is usually some items missing, more often than not they are commonly consumed products, and really important for polyphenol intake as in the case of spices.
Regardless of the methodology, once the dietary data have been collected, they should be transformed into polyphenol intake. Although there are several food databases available providing food phenolic content, in most investigations two are usually used: the United States Department of Agriculture (USDA) database(Reference Bhagwat, Haytowitz and Holden13) and Phenol-Explorer(Reference Neveu, Perez-Jiménez and Vos14,Reference Rothwell, Urpi-Sarda and Boto-Ordoñez15) . However, USDA database only has the values of flavonoids. Phenol-Explorer, on the other hand, has values for total polyphenol content as well as for each of the phenolic compounds and subclasses. Moreover, it also provides with information about retention factors for cooked or processed foods(Reference Neveu, Perez-Jiménez and Vos14–Reference Rothwell, Perez-Jimenez and Neveu16). Nowadays, Phenol-Explorer is the most complete and most widely used database in European countries(Reference Probst, Guan and Kent7,Reference Pinto and Santos9) .
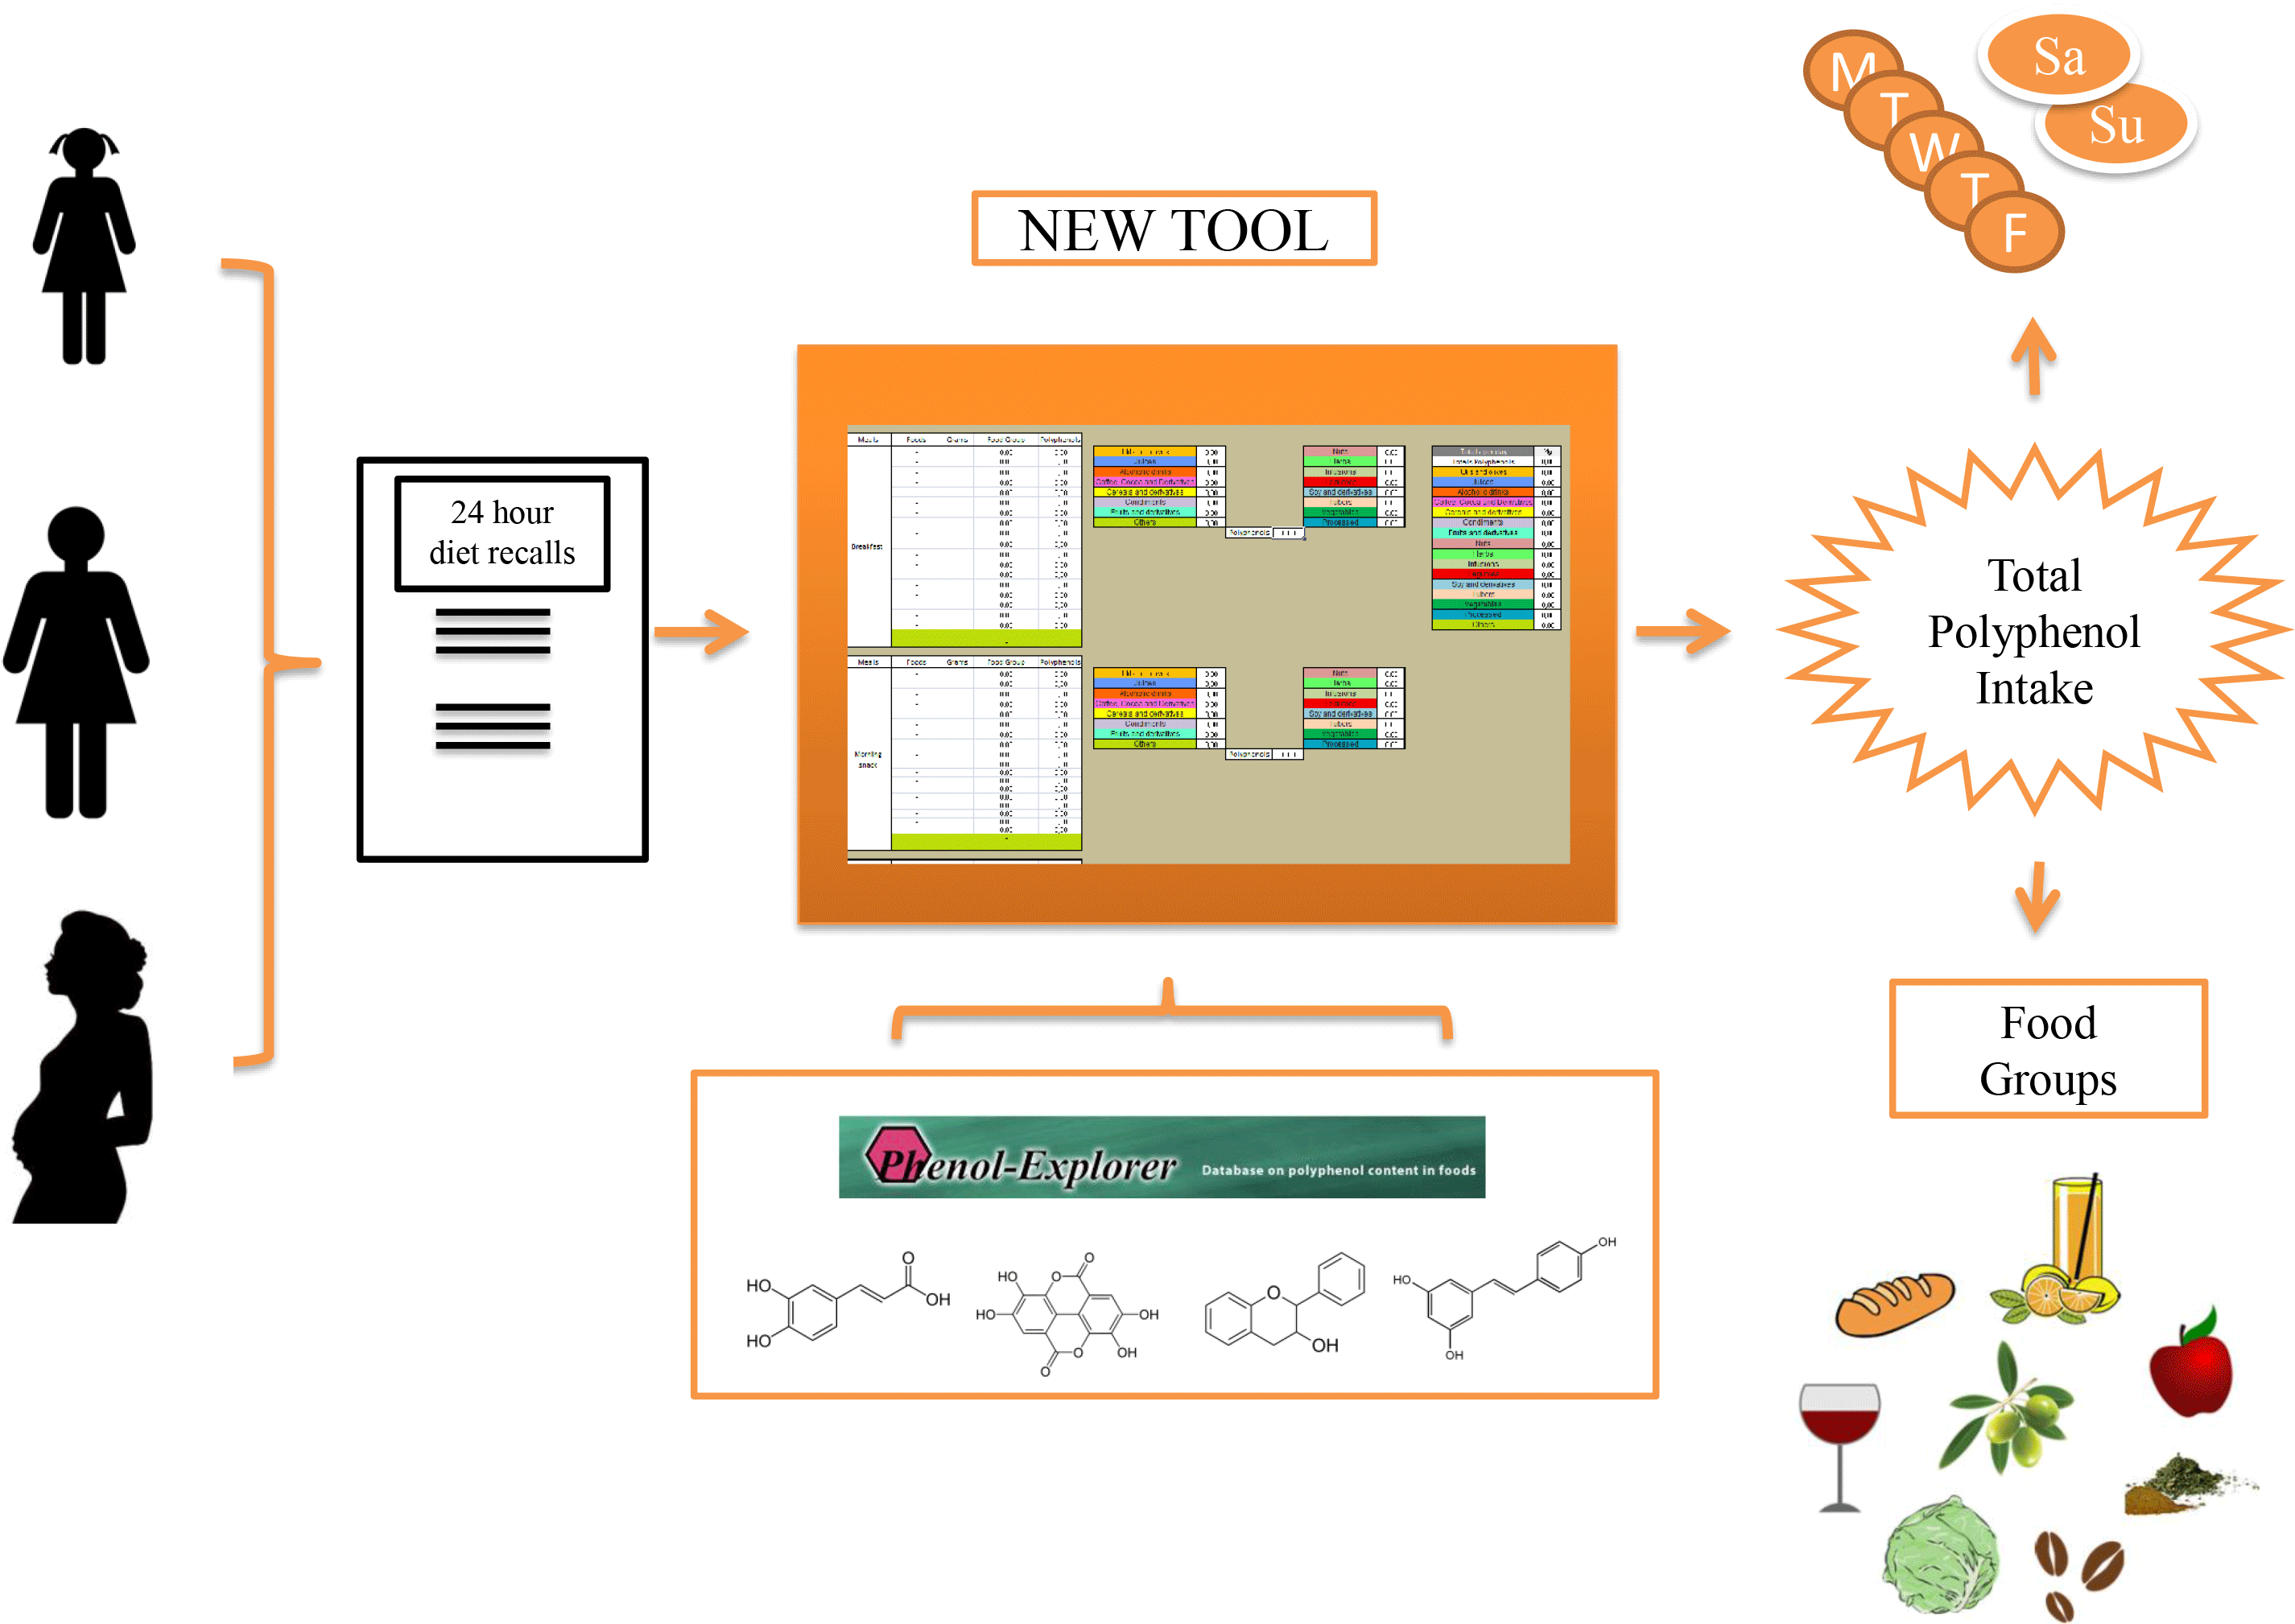
There is not a consensus about the methodology to gather dietary information, some studies use FFQ and others 24hR; using different food composition databases also produces inconsistent results along studies. In addition, there is not a protocol to calculate phenolic intake that states which data use as input (total phenolic content v. the sum of all phenolic subclasses available)(Reference Probst, Guan and Kent7). All these issues lead to a significant disagreement when it comes to calculate phenolic intake of a certain population, usually oscillating between 1 and 3 g/d(Reference Zamora-Ros, Cayssials and Jenab17,Reference Saura-Calixto, Serrano and Goni18) . These variations could be overcome if a standardised protocol existed. Therefore, the aim of the present manuscript is to describe an intuitive and user-friendly tool to facilitate the calculation of polyphenol intake that will be released as a spreadsheet freely available for other researchers in the field. This tool is the prototype on which a mobile application under development will be based, which will calculate in addition to the total intake of polyphenols, the intake of individual polyphenols, classes and subclasses.
Materials and methods
Tool development
The tool was created in a Microsoft Excel 2007® spreadsheet (Redmond, USA), which is attached as supplementary material (S1). The .xls format was chosen because most users find it accessible and easy to use. This format allows it to be used by different versions of Microsoft Excel or by other softwares such as Apache OpenOffice®. It was developed in two languages, Spanish and English (only the English version is attached as supplementary material, but the Spanish version can be sent upon request). The tool consists of twelve different spreadsheets and is password protected, to prevent formulas from being modified by mistake, which could generate calculation errors.
The first spreadsheet contains a description of the tool and the bibliography used(Reference Neveu, Perez-Jiménez and Vos14–Reference Rothwell, Perez-Jimenez and Neveu16). Next seven spreadsheets represent each day of the week, with the possibility to choose among all the available foods. The daily intake is divided into six different meals: breakfast, mid-morning snack, lunch, mid-afternoon snack, dinner and a wild card for ‘in between hours’ intakes. Within each meal, up to eighteen different food items can be added. Additionally, there are two empty slots (marked in green), in case the subject wants to enter values of any specific foodstuff, such as recipes, supplements or other that are not included in the tool. In order to obtain the phenolic intake, the user only has to select the consumed food and the ingested amount. The tool will show total polyphenol intake provided by the specific food, by the complete meal, per day, and per group of food. Spreadsheets 10 to 12 collect all the values, calculating the means and the standard deviations of the total polyphenol intake by week, and by weekdays or weekends, always arranged by food groups. Finally, the last spreadsheet is an open table so that up to thirty-two participants can be entered allowing to calculate the weekly average intake of a population, giving also the possibility of classifying participants by gender.
Foods included in the tool
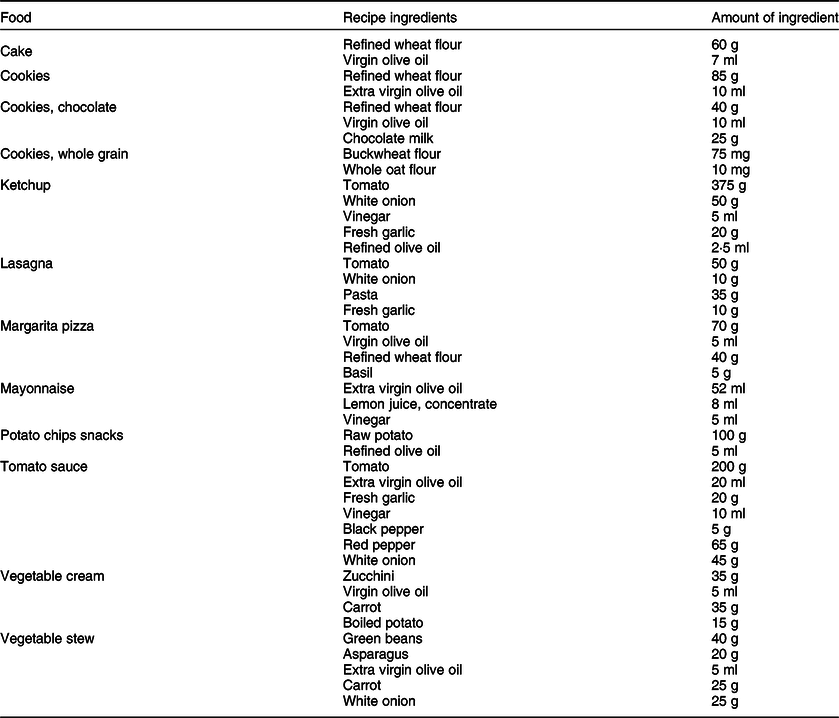
Total polyphenol content of 302 foods was recorded. These values were extracted from the Phenol-Explorer database. The goal was to have as many foods as possible. Therefore, foods that had total polyphenol values were added and the tool was complemented with sixty additional food items without total polyphenol value. Their total phenolic content value was obtained by summing the different polyphenol families provided by the Phenol-Explorer database. The retention factors of most foods have not been taken into account, only in specific cases (such as boiled rice or potato chips) where information was verified. Foods were classified into sixteen groups: oils and olives (9), juices (13), alcoholic drinks (15), coffee, cocoa and derivatives (8), cereals and derivatives (23), condiments (20), fruits and derivatives (70), nuts (16), herbs (18), infusions (10), legumes (13), soya and derivatives (14), tubers (4), vegetables (56), processed foods (12), and others (1). All the foods corresponding to these groups are detailed in the tool. The group called ‘others’ is an empty slot that allows the user to enter additional items. Moreover, twelve foods that were classified as ‘processed’ were added. These foods were introduced since they are commonly consumed by the Spanish population(Reference Grosso, Stepaniak and Topor-Mądry10,Reference Menal-Puey and Marques-Lopes19) . Table 1 shows the foods that have been classified as processed, as well as their ingredients. Only those ingredients that contribute to the phenolic intake have been shown. The recipes have been elaborated following a Mediterranean pattern. Therefore, virgin or extra virgin olive oil is the main fat source. If other refined vegetable oils are to be used, they have to be introduced in the tool and substitute of olive oil.
Table 1 Processed foods with the ingredients used for the estimation of polyphenols
Population test
In order to verify the usefulness of the tool, food consumption data were collected from a total of ninety participants from different population groups within the framework of the European project Stance4Health (https://www.stance4health.com). Specifically, thirty adult women, thirty school-age girls and thirty pregnant women participated (September–October 2020). Girls were recruited from two schools in the metropolitan area of Granada with equal socio-economic conditions whose ages ranged from 10 to 11 years. Pregnant women were part of a cohort from the Clinical Hospital of Granada and their ages were between 22 and 35 years. The other thirty women were students in the University of Granada; their ages were between 19 and 28 years. Food intake was recorded for seven consecutive days with the tool, which has a format equivalent to 24hR. The questionnaires were completed with the help of an interviewer trained in nutrition and dietetics. Portion sizes were estimated by the interviewer using food photographs as models. All the data were recorded to guarantee the personal data protection law. The study was approved by the ethics committee of the Universidad de Granada No. 1080/CEIH/2020 and followed the ethical guidelines of the Declaration of Helsinki. All the participants signed an informed consent before starting the study (in the case of girls, their parents filled the informed questionnaire document).
Data analysis
Statistical data were analysed with the SPSS 22.0 statistics package. Means and standard deviations were determined for the total daily polyphenol consumption, as well as the weekly intake. The differences between groups were measured by means ANOVA, and a Bonferroni post hoc test was used. The level of significance was established at P < 0·05. The contribution per food group to the daily polyphenol intake was estimated. It was also taken into account if the food was consumed during the week or during the weekend, along with the daily time of the meal.
Results
Total polyphenol intake of the ninety participants showed an average of 1790 ± 629 mg/d. If the population is classified according to the three different groups, some differences were found, as shown in Table 2. The highest polyphenol consumption was observed in pregnant women, with an intake of 2064 mg/d, while in girls the consumption was the lowest with an intake of 1541 mg/d. However, no significant differences were found (P > 0·05) between both groups. Total polyphenol consumption was lower during the weekend in all three population groups compared. Nevertheless, no significant differences were found between weekend and weekdays phenolic intake.
Table 2 Mean and standard deviation of total daily polyphenol intake (mg/d) divided by population group and by distribution in the weekday and weekend (n 90)

Figure 1 shows the distribution of total polyphenol intake in each of the daily meals. It should be noted that lunch is the meal with the highest intake of polyphenols except in children, where breakfast showed the largest contribution. On the contrary, the food with the lowest contribution was the mid-morning snack.

Fig. 1 Distribution of the total polyphenol intake (mg/d) in each of the six daily meals divided by population group: breakfast, mid-morning snack, lunch, mid-afternoon snack, dinner and between hours intakes
Figure 2 shows the distribution of total polyphenol intake by food groups. It can be seen how the contribution of each food category to total phenolic intake changes depending on the age. In adult women, most polyphenols are provided by three groups: coffee, cocoa and derivatives, providing about 23 % of total phenolic intake; fruits and derivatives contributing with 18 % and legumes providing another 18 %. In girls, coffee, cocoa and derivatives doubled its contribution up to 47 %, whereas fruits and derivatives provided 16 % of the total amount of polyphenols, followed by legumes, with 13 %. In the case of pregnant women, statistically significant differences (P < 0·05) were obtained for several food groups: the contribution of coffee, cocoa and derivatives decreased, being legumes (with 35 %) and fruits and derivatives (with 22 % contribution) the main providers of polyphenols in the pregnant women diet. The following two groups that provided also a significant contribution of polyphenols were vegetables and cereals and derivatives, with 9 % and 8 %, respectively.

Fig. 2 Distribution of the total polyphenol intake (mg/d) classified into fifteen food groups for each of the three population groups: oils and olives, juices, alcoholic drinks, coffee, cocoa and derivatives, cereals and derivatives, condiments, fruits and derivatives, nuts, herbs, infusions, legumes, soya and derivatives, tubers, vegetables and processed foods. *Statistically significant differences between groups (P < 0·05)
Discussion
This paper describes the development of a useful and accurate tool to calculate total polyphenol intake from dietary records. In order to achieve an accurate estimation of polyphenol intake, it is of great importance to consider all the foods ingested. Total phenolic content of foods was gathered from Phenol-Explorer database, since it is the most detailed database and it is also widely used among nutrition professionals(Reference Grosso, Stepaniak and Topor-Mądry10,Reference Hoge, Guillaume and Donneau20) . In most foods, total polyphenol content was obtained via the Folin–Ciocalteu method. Although this is not the best analytical assay to measure total polyphenol content (due to interferences with other substances), these values were used since they can be found for a large amount of foods on Phenol-Explorer database. In a previous study, the research group validated a new method to measure the excretion of polyphenols and it was compared with the intake of total polyphenols(Reference Hinojosa-Nogueira, Muros and Rufián-Henares21). For this reason, the calculation of total polyphenols intake could be the best way to estimate the total polyphenols of the diet, and not only those from the sum of the families of phenolic compounds, since in many cases it would cause data loss.
Different types of dietary questionnaires are used to estimate polyphenol content(Reference Grosso, Stepaniak and Topor-Mądry10,Reference Hoge, Guillaume and Donneau20,Reference Wisnuwardani, De Henauw and Androutsos22) . In this sense, the tool was developed on the basis of the 24hR to obtain more complete nutritional information. Although the use of retention and yield factors should be advisable, it was not possible for all the foods included in the tool due to different reasons: (i) cooking methods are often not recorded in dietary questionnaires and (ii) retention factors for total polyphenols in certain foods are sometimes not reported in the Phenol-Explorer database. For these reasons, we have considered appropriate to use retention factors just for those foods where the cooking method applied is clear and are properly described in the Phenol-Explorer database, as this could otherwise add further confusion errors to the results.
As average, total polyphenol intake measured with the tool was 1790 ± 629 mg/d, which is in line with other previously published papers. For example, Hoge et al. estimated total polyphenol intake from a FFQ and compared such results with those obtained from a 3-d dietary record. Their results ranged from 1204 to 2271 mg/d(Reference Hoge, Guillaume and Donneau20). On the other hand, Grosso et al. studied the polyphenol intake of Krakow population (Poland), finding a mean intake of 1756 ± 695 mg/d(Reference Grosso, Stepaniak and Topor-Mądry10). They used Phenol-Explorer as database, whereas food intake records came from FFQ. Polyphenol intake has also been studied in female populations, specifically in several European countries(Reference Zamora-Ros, Cayssials and Jenab17). The intake values obtained ranged between 653 and 1552 mg of polyphenols/d, being the Danish population the one with the highest intake. Regarding the Spanish population, it should be highlighted a study where extractable and non-extractable polyphenols were considered(Reference Saura-Calixto, Serrano and Goni18). This study showed a polyphenol intake higher (2591–3016 mg/d) than those reported by other studies(Reference Grosso, Stepaniak and Topor-Mądry10,Reference Rothausen, Matthiessen and Hoppe23) . Saura-Calixto and Goñi obtained a daily polyphenol intake of 1171 mg for the Spanish population(Reference Saura-Calixto and Goñi24). However, in this case, they calculated food consumption via national food consumption databases.
One of the applications to use the developed tool is the possibility of estimating total polyphenols in different types of populations. There are few studies in children, one of the most important in Europe is the one developed in the HELENA study, that estimated the dietary intake of polyphenols in adolescents(Reference Wisnuwardani, De Henauw and Androutsos22). However, the results obtained in the HELENA study cannot be compared with those reported in this paper since they used the sum of families of polyphenols, not total polyphenols. Another of the target populations were pregnant women, since there are studies that suggest that a high intake of polyphenols during pregnancy can lead to complications for the fetus(Reference Zielinsky and Busato25,Reference Zielinsky, Piccoli and Manica26) .
In the case of the contribution of different food groups to the daily polyphenols intake, the values found in this study are similar to those reported in other papers: coffee and chocolate, fruits and vegetables were the main contributors of total polyphenols intake(Reference Grosso, Stepaniak and Topor-Mądry10,Reference Nascimento-Souza, de Paiva and Pérez-Jiménez27) . The consumption of legumes has decreased in the Spanish population in recent years(Reference Partearroyo, Samaniego-Vaesken and Ruiz28). Nevertheless, legumes were also an important provider or phenolic compounds, with very similar values to those of fruits and vegetables(Reference Godos, Rapisarda and Marventano29). When we compared the intake of polyphenols during weekends to that of weekdays, it was clear that during the weekend the intake decreased. The reason behind could be a lower intake of legumes, fruits and vegetables during the weekend. Similarly, in other studies, the weekend intake of rye bread, fruits and vegetables were smaller(Reference Rothausen, Matthiessen and Hoppe23) which also resulted in a lower polyphenol intake. Regarding the hours of the meals, the main polyphenol intake was achieved during lunch, meal that usually provides the highest energetic intake. It should be noted that at early ages, the highest intake of polyphenols is obtained at breakfast. This may be due to a high consumption of chocolate and cocoa in the breakfasts of the children(Reference Ruiz, Ávila and Valero30) and also to the use of different oils to prepare bread toasts(Reference Marfil, Giménez and Martínez31). In some cases, the food groups may need to be separated in different ways. The tool automatically classifies each food into one of the food groups. However, the tool allows the user to enter foods manually which enables the user to change certain foods to another food group.
The increased need to precisely calculate the intake of total polyphenols from the diet, as is the case of pregnancy, gives importance to having this tool, which would help other researchers to easily obtain reproducible data. An example will be the use of this tool within the European project Stance4Health. The tool can be useful for small clinical trials, but it is not useful for large epidemiological studies. For this reason, an APP (an application program that can be downloaded onto a mobile phone to allow a personalised nutrition service) is under development based on the experience of this tool. In addition, the possibility of obtaining individual polyphenols will be introduced. The diet and intake of polyphenols of children and adults from different European countries will be evaluated with these new tools.
Conclusions
In summary, this tool has demonstrated to be extremely useful to calculate the total polyphenol intake from commonly used dietary records in a simple, fast and accurate way. Results achieved with the tool have been compared to several other studies, reaching always very similar conclusions, aside from the inevitable variations related to dietary records collection. However, the tool has certain limitations: (i) not all foods are included, but in this case, empty slots are available to include new foods at will; and (ii) the tool was built to include all 7 weekdays in the calculations, so that if there is interest in only specific days, calculations between different days would have to be done manually. In view of the results, it can be concluded that the use of this tool could facilitate the estimation of total polyphenol intake in different populations in a precise and reproducible way.
Acknowledgements
Acknowledgements: This work will be a part of the doctoral thesis of Daniel Hinojosa-Nogueira conducted within the context of the ‘Program of Nutrition and Food Sciences’ at the University of Granada. The authors also would like to thank Francisco Ríos Jiménez for the help and advice while preparing the tool. Financial support: This work was supported by the European Research Commission (Research Executive Agency) under the research project Stance4Health under Grant (Contract Nº 816303) and by the ‘Plan propio de Investigación y Transferencia’ of the University of Granada under the programme ‘Intensificación de la Investigación, modalidad B’ granted to José A. Rufián-Henares. Conflict of interest: The authors report no conflict of interest. Authorship: The authors responsibilities were as follows: conceptualisation: J.A.R.H. and S.P.C.; methodology: D.H., S.P. and I.G.; tool creation: D.H.; validation: D.H. and S.P.; formal analysis: D.H. and I.G.; writing original draft preparation: D.H. and S.P.; writing review and editing: J.A.R.H. and S.P.C.; project administration: S.P.C.; and funding acquisition: J.A.R.H. All authors read and approved the final manuscript. Ethics of human subject participation: This study was conducted according to the guidelines laid down in the Declaration of Helsinki and all procedures involving research study participants were approved by the Ethics Committee of the University of Granada. Written informed consent was obtained from all participants or from the legally responsible persons.
Supplementary material
For supplementary material accompanying this paper visit https://doi.org/10.1017/S136898002100183X


 Open access