


NOMENCLATURE
Abbreviations
- CFD
computational fluid dynamics
- GTRS
Generic TiltRotor Simulation
- RoE
rotors-on-empennage
- RoW
rotors-on-wing
- TARA
Tiltrotor AeRomechanics Analysis
- VPM
vortex particle method
- WoE
wing-on-empennage
- WoR
wing-on-rotors
Greek symbols
 $\alpha$
angle-of-attack [rad]
- $\beta_s, \: \beta_c$
lateral and longitudinal gimbal tilt angles [rad]
- $\delta$
fore/aft pilot stick position
- $\varepsilon$
downwash angle at the empennage [rad]
- $\zeta$
normalised downstream distance from the rotor hub
- $\eta$
elevator deflection [rad]
- $\theta$
fuselage pitch attitude [rad]
- $\theta_0, \: \theta_s$
collective and longitudinal cyclic pitches [rad]
- $\lambda_0, \: \lambda_s, \: \lambda_c$
wake degrees of freedom
- $\mu, \: \lambda$
rotor advance and inflow ratios
- $\xi_f/\xi$
flap/flaperon settings
- $\rho$
air density [kg/m3]
- $\sigma$
rotor solidity
- $\tau$
rotor tilt angle [rad]
- $\upsilon_0$
mean induced velocity component [m/s]
- $\upsilon_{RoE}$
induced velocity multiplier
- $\Omega$
rotor speed [rad/s]


Roman symbols
- b
number of blades
- $C_T$
thrust coefficient
$=T/\rho (\pi R)^2(\Omega R)^2$- $C_P$
power coefficient
$=P/\rho (\pi R)^2(\Omega R)^3$- g
acceleration due to gravity [m/s2]
- $i_0$
setting angle [rad]
- I
flapwise moment of inertia of a single blade [kg m2]
- $I_{yy}$
moment of inertia in pitch [kg m2]
- K
hub spring stiffness [N m/rad]
- m
aircraft mass [kg]
- M
body pitching moment [N m]
- $M_c, \: M_s$
aerodynamic pitch and roll moments on the rotor disc [N m]
- q
body pitch velocity [rad/s]
- $\mathcal{Q}$
dynamic pressure [Pa]
- $\mathcal{Q}_{RoE},\: \mathcal{Q}_{RoW}$
dynamic pressure multipliers
- $R, \: \mathcal{R}$
rotor and rotor wake radii [m]
- Re
Reynolds number
- $u,\:w$
body forward and vertical translational velocities [m/s]
- $V_\infty$
true airspeed [m/s]
- $x, \: y, \: z$
Cartesian position components [m]
- $X,\: Z$
body forward and vertical forces [N]


Subscripts
- E
denotes the empennage
- F
denotes the fuselage
- R
denotes the rotors
- T
denotes the tailplane
- W
denotes the wing
1.0 INTRODUCTION
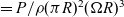
Conventional tiltrotor aircraft employ a lateral-tandem configuration with a pair of counter-rotating rotors mounted at either wingtip. The rotational degree of freedom possessed by the rotors amalgamates the usefulness and efficiencies of conventional rotorcraft and turboprop aircraft into a single flight vehicle. These types of aircraft are, therefore, capable of fulfilling a diverse range of missions in both the commercial and military sectors. The flight envelope of tiltrotor aircraft contains an additional dimension that arises due to the tilt degree of freedom. When presented through the airspeed and rotor tilt angle variables, the flight envelope is termed the conversion corridor. This corridor represents the safe transition from rotor-borne to wing-borne flight where the aircraft switches from helicopter to aeroplane mode. This corridor effectively maps the viable trim region within the performance constraints of the aircraft. The conversion corridor of the Bell XV-15 is shown in Fig. 1 and illustrates the airspeed boundaries as a function of the rotor tilt.
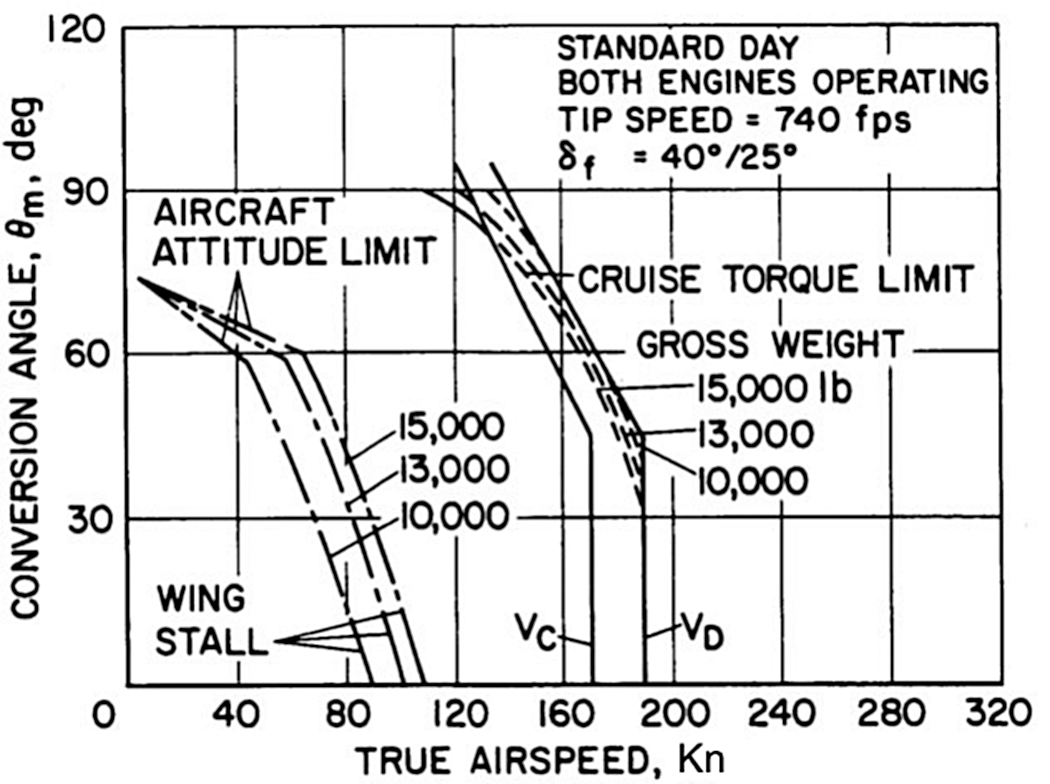
Figure 1. Typical conversion corridor of tiltrotor aircraft showing the min-speed and max-speed boundaries as a function of forward speed, rotor tilt and weight. Image from Maisel(Reference Maisel1).
The lateral-tandem configuration of tiltrotor aircraft introduces several important aerodynamic interactions between the rotors and airframe components that can significantly affect the flight behaviour and performance(Reference Soohoo, Morino, Noll and Ham2-Reference McVeigh, Grauer and Paisley4). Understanding both the interaction mechanisms and their effects is important for several reasons: accurately predicting trim behaviour and performance, design of new tiltrotor aircraft, establishing flight procedures, pilot training and real-time simulation and handling and control qualities. The simulation effort during the development of the XV-15 was proven to be a valuable tool that complemented multiple aspects of the project(Reference Churchill and Dugan5). Tiltrotor interaction phenomena are exhibited at different operating conditions through the flight envelope and depend on factors such as airspeed, angle-of-attack, angle-of-sideslip, rotor incidence and thrust requirements. This work investigates the different interaction phenomena and their influences at different operating conditions. These interactions can be classified into four categories: rotors-on-wing (RoW), wing-on-rotors (WoR), rotors-on-empennage (RoE) and wing-on-empennage (WoE). This research focusses on the effects of the RoW, RoE and WoE interactions. The WoR interaction arises primarily towards aeroplane mode where the rotor operates in the upwash field of the lifting wing. This has been shown to increase the in-plane forces of the rotor and consequently increase the total drag of the aircraft and change the pitching moment(Reference McVeigh, Grauer and Paisley4,Reference Tran, Lim, Nunez, Wissink and Bowen-Davies6) . However, these changes are relatively small and have not been included in the present work. Several aeromechanics models of tiltrotor aircraft exist in literature that have been used for real-time simulations(Reference Rosenstein, McVeigh and Mollenkof7-Reference Ferguson9), flight dynamics investigations(Reference McVicar and Bradley10-Reference Juhasz13) and operational procedure studies(Reference Diaz, Mouterde and Desopper14). However, these models have not included a consistent representation of the aforementioned interactions, nor studied their influences on the predicted behaviour and performance.
The RoW interaction arises from the proximity between the rotor and wing components and is exhibited largely in hover and at rotor tilts nearer aeroplane mode. In between these conditions, the freestream skews the rotor wakes away from the wing and the interaction is small(Reference Tran, Lim, Nunez, Wissink and Bowen-Davies6). The RoW interaction is dominant in hover due to the orientation of the rotor downwashes relative to the wing. The immersion of the wing in the rotor wakes generates a significant vertical drag, or download, on the airframe. Early theoretical predictions of tiltrotor download were found to underpredict the experimentally observed values(Reference Marr, Sambell and Neal15,Reference Marr, Ford and Ferguson16) . These experimental studies indicated the download was in the region of 10–15% of the rotor thrust and thus created an appreciable limitation to the useful payload that can be carried vertically(Reference Felker17). The complexity of this phenomenon has prompted continued experimental investigations to understand the physics of the interaction mechanisms and potential solutions to minimise the imposed performance penalties(Reference Wilson, Mineck and Freeman18-Reference Maisel, Laub and McCroskey23). As the rotors are tilted towards aeroplane mode, the incidence of the rotors reimmerses portions of the wing in the rotor wakes. At these operating conditions, the velocities induced by the rotor thrusts are substantially smaller than in hovering flight, and therefore, the RoW interaction has a reduced effect on performance. The swirl component of the rotor wakes can improve the performance of the wing through the introduced upwash velocity(Reference McVeigh, Grauer and Paisley4), and recent CFD simulations have shown mutual and harmonic interactions between the rotor and wing in aeroplane mode(Reference Lim24).
The prediction of the airframe download is complex and better suited to physics-rich methods due to the three-dimensional flowfield of the problem: the interaction of the rotor wakes generates a large region of three-dimensionally unsteady, vortical and separated flow on the underside of the wing. CFD simulations in hover, such as Tran et al.(Reference Tran, Lim, Nunez, Wissink and Bowen-Davies6) and Potsdam and Strawn(Reference Potsdam and Strawn25) have shown good predictive capabilities, but their computational cost generally detracts from their implementation at the initial stages of design and in reduced-order analyses. Other numerical models that have shown good performance predictions are potential flow and lower-order actuator disc CFD models(Reference Quackenbush, Whitehouse, Danilov and Solomon26,Reference Quackenbush, Whitehouse, Danilov and Silbaugh27) , but their computational cost over a large-domain investigation can be prohibitive.
In forward flight, the vortex wake of the lifting wing is convected downstream towards the empennage. The vorticity in the wing wake is known to induce a downwash at the tailplane that has a significant influence on the vehicle pitching moment. For conventional fixed-wing configurations, this downwash is proportional to the lift coefficient of the wing(Reference Houghton and Carpenter28). For tiltrotor aircraft, this lift coefficient may be higher due to the effects of the flap/flaperon settings used to alleviate the rotor download in hover and improve the wing lift capability at low speed. Forward flight also causes the rotor wakes to convect downstream, with early experimental studies showing the rolled-up tip vortices inducing a net upwash on the tailplane(Reference Marr, Sambell and Neal15). This interaction is contrary to conventional helicopters whose tailplane operates largely in the downwash of the main rotor(Reference Bramwell, Done and Balmford29,Reference Padfield30) . Furthermore, the dynamic pressure at the tailplane was found to be approximately double that of the freestream at certain operating points(Reference Marr, Sambell and Neal15,Reference Marr, Ford and Ferguson16,Reference Wilson, Mineck and Freeman18) . The interaction of the rotor wakes at the tailplane resulted in undesirable handling qualities such as stick reversal and pitch-up with sideslip. Accurately predicting the complex interaction between the WoE and RoE has been successfully undertaken with high-fidelity VPM and CFD solvers(Reference Tran, Lim, Nunez, Wissink and Bowen-Davies6,Reference He and Zhao31-Reference Tran and Lim33) . Unfortunately, these investigations have not led to a sufficient suite of reduced-order models in the public domain to predict such effects for generic aircraft configuration.
This work investigates the influence of the aforementioned aerodynamic interactions on the predicted trim behaviour and aircraft performance in longitudinal flight and is developed from previous works by the authors(Reference Appleton, Filippone and Bojdo34,Reference Appleton, Filippone and Bojdo35) using the early tiltrotor simulation model of Harendra et al.(Reference Harendra, Joglekar, Gaffey and Marr8). The interactions are considered both singularly and collectively to emphasise their individual effects and dominance when combined into a single flight simulation model. An in-house aeromechanics program, TARA (Tiltrotor AeRomechanics Analysis), developed at the University of Manchester was used to perform the simulations. The tiltrotor aeroplane modelled in this research was the Bell XV-15 owing to the large volume of experimental, configurational and aerodynamic data published in literature. The reference data used in this work are derived from the Generic TiltRotor Simulation (GTRS) model for the XV-15, a validated aeromechanics model(Reference Ferguson9,Reference Ferguson36) . The implemented interaction models are derived semi-empirically to correlate simplified theory with experimental data over a wide range of operating points. These models can be updated with experimental and/or numerical data to reflect different aircraft designs and configurations.
2.0 AEROMECHANICS MODEL
The aeromechanics analysis was undertaken using TARA, an in-house reduced-order aeromechanics code. The code allows for generic tiltrotor configurations to be implemented through user-defined component data. The component files contain the configuration, geometry, aerodynamic, control and interaction data that are processed by TARA. In the absence of publicly available data for different tiltrotor configurations, the aeromechanics model of the XV-15 was largely derived from the GTRS data(Reference Ferguson9). The calculation of the aerodynamic loads in TARA uses strip theory for all the components except the fuselage. These loads are modelled as point loads acting at a user-defined centre of pressure. The fuselage aerodynamic model is not described here and was taken directly from Ferguson(Reference Ferguson9). TARA contains a main flight mechanics module that calls aerodynamic modules for each component class. The flight mechanics module attempts to trim the aircraft at a supplied operating point. Each operating point is defined by the following parameters: (1) airspeed, (2) flight path angle, (3) shaft angle, (4) altitude, (5) mass, (6) inertia in pitch, (7) cg position, (8) flap/flaperon setting and (9) rotor speed. For the case of longitudinally symmetric flight considered here, only a single rotor was modelled with the net forces and moments augmented to reflect the symmetry of the problem. Figure 2 shows an overview of the aeromechanics model implemented in TARA: red boxes indicate the flight mechanics module; blue boxes indicate the aerodynamic modules. The trim solution is attempted using a Newton–Raphson scheme with a variable damping factor to efficiently solve for the trim quantities. The Newton–Raphson scheme is coupled into a periodic shooting scheme to find the periodic solution of the rotor state variables.
Figure 2. Overview of the aeromechanics model implemented in TARA. The input data are contained in the aeroplane model and operating point files. The unknown trim quantities are the fuselage pitch attitude  $\theta$, collective pitch
  $\theta_0$ and fore/aft pilot stick position
  $\delta$.
2.1 Flight mechanics module
The flight mechanics module of TARA is a rigid-body representation of the equations of motion derived in a conventional body-fixed coordinate system(Reference Bramwell, Done and Balmford29,Reference Padfield30) . The flight mechanics module implements an inverse simulation to determine the fuselage orientation and control inputs required to hold a given operating point. The control system for tiltrotor aircraft contains both rotary-wing and fixed-wing controls that are engaged depending on the operating condition. The trim equations initially present an under-determined system of equations with the longitudinal cyclic pitch and elevator deflection as pitch moment controls. The exact control strategy is a design choice and uniquely determines the aircraft trim solution. Additionally, the tilt angle of the rotors can also be viewed as a trim control; however, in this work, the tilt angle was specified in the operating point file. The unknown trim quantities for the present simulation were the fuselage pitch  $\theta$, the collective pitch of the rotors
  $\theta_0$ and the fore/aft pilot stick position
  $\delta$. The pilot stick position was introduced to close the under-determined trim equations and uniquely define the rotary-wing longitudinal cyclic and fixed-wing elevator deflection. The fuselage pitch attitude and rotor tilt angle are defined as shown in Fig. 3.
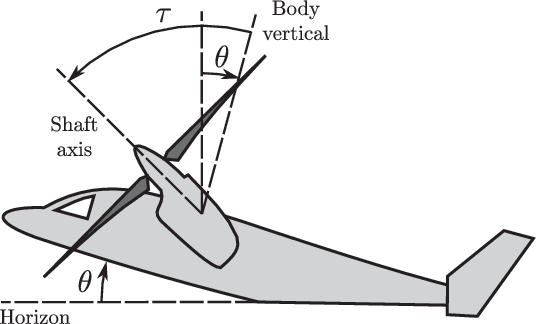
Figure 3. Definitions of the fuselage pitch angle and rotor tilt angle.
This work investigates the longitudinal trim behaviour of the aircraft, which is satisfied by the following system of equations:
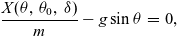 \begin{eqnarray} \dfrac{X(\theta, \: \theta_0, \: \delta)}{m} - g\sin\theta &=& 0, \end{eqnarray}
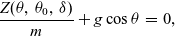 \begin{eqnarray} \dfrac{Z(\theta, \: \theta_0, \: \delta)}{m} + g\cos\theta &=& 0, \end{eqnarray}
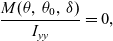 \begin{align} \dfrac{M(\theta, \: \theta_0, \: \delta)}{I_{yy}} = 0,\end{align}
where X and Z are the body forces, M is the body pitching moment, m is the aircraft mass, g is the acceleration due to gravity and  $I_{yy}$ is the aircraft moment of inertia in pitch. The mass and moment of inertia in pitch are supplied in the operating point file. The aerodynamic contributions to the X, Z and M loads are calculated from the aerodynamic modules for each component type, i.e.:
 \begin{equation} X = X_F + X_R + X_W + X_E, \end{equation}
where the subscripts F, R, W and E denote the fuselage, rotors, wing and empennage. The RoW, RoE and WoE models implemented in TARA are order specific due to the necessity of certain aerodynamic parameters. The order of component analysis is consistent with Equation (4), as illustrated in Fig. 4.
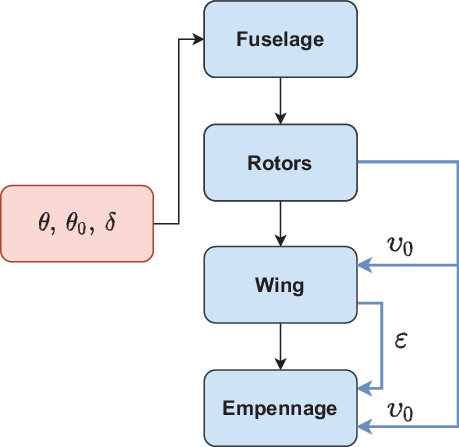
Figure 4. Sequence of aerodynamic modules called by the main flight mechanics module within TARA. The required data in both the wing and empennage modules are the mean rotor-induced velocity  $\upsilon_0$ and the wing downwash angle
  $\varepsilon$.
The longitudinal trim solution is obtained by determining the fuselage orientation and the control inputs required to give zero translational and rotational accelerations. To close the system of equations, the fuselage pitch control variables are expressed parametrically through the normalised fore/aft pilot stick position  $\delta$. The normalised fore/aft stick position at full fwd and full aft are quantified by
  $\delta = 1$ and
  $\delta = -1$. In this work, the control system was made consistent with the GTRS model such that the longitudinal cyclic pitch and elevator deflection angle,
  $\theta_s$ and
  $\eta$, are linearly related to the stick position:
 \begin{align}
\theta_s(\delta,\tau) & = - 10^{\circ} \: \delta \cos\tau - 1.5^{\circ} (1 - \cos\tau), \end{align}
\begin{align}
\theta_s(\delta,\tau) & = - 10^{\circ} \: \delta \cos\tau - 1.5^{\circ} (1 - \cos\tau), \end{align}
 \begin{align}
\eta(\delta) & = 20^{\circ} \: \delta,\end{align}
\begin{align}
\eta(\delta) & = 20^{\circ} \: \delta,\end{align}
where  $\tau$ is the rotor tilt angle.
2.2 Rotor module
The rotor module introduces a time dependency of the rotor loads that are coupled to both the wake and rotor dynamics. Both the wake and rotor dynamics are represented by nonlinear state-space models. The state-space representation is coupled into the trim solution to enforce periodicity in the state variables. The wake dynamics are modelled using the three-state dynamic inflow theory of Peters and HaQuang(Reference Peters and HaQuang37). The wake degrees of freedom are the mean, lateral and longitudinal induced inflow variations  $\lambda_0$,
  $\lambda_{s}$ and
  $\lambda_{c}$. The time dependency of the wake degrees of freedom are related to the instantaneous aerodynamic thrust, roll moment and pitch moment on the rotor disc.
The rotorhead of the XV-15 is gimballed through a universal joint that reorientates the rotor speed normal to the tip-path plane(Reference Padfield30). Consequently, there is no centrifugal moment tending to restore the blades to the plane of rotation. The universal joint was modelled as a homokinetic (constant velocity) joint that preserved the rotor speed through the joint. The 2/rev fluctuations in rotor speed introduced by the universal joint as the tip-path plane tilts were neglected since the gimbal tilt angles, and hence amplitude of the 2/rev fluctuations, are small. The orientation of the tip-path plane is dependent on the balance of aerodynamic, inertial and spring moments from all blades such that the disc tilts as a single rigid-body structure. The gimbal states, comprising the longitudinal and lateral tilt angles and their respective rates, were time-dependent quantities that were governed by second-order differential equations:
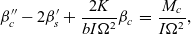 \begin{eqnarray} \beta_c'' - 2\beta_s' + \dfrac{2K}{bI\Omega^2}\beta_c &=& \dfrac{M_c}{I\Omega^2}, \end{eqnarray}
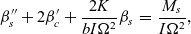 \begin{eqnarray} \beta_s'' + 2\beta_c' + \dfrac{2K}{bI\Omega^2}\beta_s &=& \dfrac{M_s}{I\Omega^2},\end{eqnarray}
where  $\beta_c$ is the longitudinal tilt angle,
  $\beta_s$ is the lateral tilt angle, K is the hub spring stiffness, b is the number of blades, I is the flapwise moment of inertia of a single blade,
  $M_c$ and
  $M_s$ are the multi-blade aerodynamic pitch and roll moments and the prime denotes the derivative with respect to dimensionless time (azimuth angle
  $\psi$). The steady-state solution of the rotor loads was obtained using a periodic shooting method to solve the periodicity requirement of the wake and gimbal states:
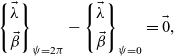 \begin{equation} \begin{Bmatrix} \vec{\lambda} \\[5pt]
\vec{\beta} \end{Bmatrix}_{\psi=2\pi} - \begin{Bmatrix} \vec{\lambda} \\[5pt]
\vec{\beta} \end{Bmatrix}_{\psi=0} = \vec{0},\end{equation}
\begin{equation} \begin{Bmatrix} \vec{\lambda} \\[5pt]
\vec{\beta} \end{Bmatrix}_{\psi=2\pi} - \begin{Bmatrix} \vec{\lambda} \\[5pt]
\vec{\beta} \end{Bmatrix}_{\psi=0} = \vec{0},\end{equation}
where  $\vec{\lambda} = \{ \lambda_0, \: \lambda_{s}, \: \lambda_{c} \}^T$ is the vector of induced inflow states and
  $\vec{\beta} = \{ \beta_c, \: \beta_c', \: \beta_s, \: \beta_s' \}^T$ is the vector of gimbal states. The rotor states were integrated in time using a third-order Runge–Kutta scheme over 24 equally spaced time steps.
The rotor loads at each time step are calculated from the spanwise integration of the blade section loads. The steady rotor loads were then found by averaging the time-dependent loads over a rotor revolution. The geometric twist and chord distributions of the blades were taken from Harris(Reference Harris38). The blade section aerodynamic data were derived from similar aerofoil sections whose polar data were taken from Abbott et al.(Reference Abbott, von Doenhoff and Stivers39) at a Reynolds number of  ${\rm Re} = 3 \times 10^6$. The aerodynamic data was compressibility-corrected using the model of Filippone(Reference Filippone40) and Reynolds-corrected using the scaling law in Johnson(Reference Johnson41) with an exponent of 1/5. A tip loss factor of 0.97 is implemented that sets the lift and induced-drag outboard of this span to zero; the profile drag is retained. Furthermore, a 15% increase in the induced power is applied to account for nonuniform induced inflow losses while using the linear inflow model. The steady forces and moments on the hub are rotated through the rotor tilt angle into the body-fixed axes for substitution into the flight mechanics module. The interaction parameters outputted from the rotor module are the mean induced velocity
  $\upsilon_0 = \lambda_0 \Omega R$ and wake skew angle
  $\chi$:
 \begin{equation} \chi = \text{atan} \frac{\mu}{\lambda},\end{equation}
where  $\mu$ and
  $\lambda$ are the advance and inflow ratios of the rotor.
2.3 Wing and nacelle module
The RoW interaction is modelled using a semi-empirical geometry-based method, similar to that in the GTRS model. The expected download is obtained by correlating the mean induced velocity of the rotors (corrected for the downstream contraction) and the drag coefficient of the wing(Reference Ferguson36). Whilst this method does not capture the complex force and moment distributions induced by the RoW interaction along the span, it can capture the bulk effects necessary for improved performance and trim predictions. Accurately predicting this phenomenon is still an active area of research both numerically and experimentally. The RoW interaction is modelled by projecting a contracted cylindrical streamtube along the wake centreline as shown in Fig. 5. This type of reduced-order method has been applied successfully elsewhere in aeromechanics analyses when computing rotor-induced interactions(Reference Harendra, Joglekar, Gaffey and Marr8,Reference Ferguson9,Reference Bramwell, Done and Balmford29,Reference Padfield30) . All the wing sections whose quarter-chord locations are bounded within the projected wake then accrue the downstream-weighted component of the mean induced velocity superimposed on the freestream. The centreline of the rotor wake is determined from the skew angle of the wake at the disc,  $\chi$. The impingement velocity of the rotor wake at the wing is a user-defined value relating to the rotor-induced velocity at the disc. In this work, a value consistent with the GTRS model was used: 1.60 times the calculated mean induced velocity
  $\upsilon_0$. The geometrical condition for a wing section to be immersed in the rotor wake was then
 \begin{equation} \left( x + z\tan\chi \right)^2 + y^2 \leq \mathcal{R}^2 \quad \chi \neq 90^{\circ}, \end{equation}
where x, y and z are the position components of the wing section relative to the hub and  $\mathcal{R}$ is the contracted wake radius. The implementation of Equation (11) assumes that the wake remains as a rigid cylinder from the disc plane infinitely far downstream. The radius of the contracted wake at the wing was approximated from the continuity equation(Reference Dreier42):
 \begin{equation} \mathcal{R} = R \sqrt{ \dfrac{ \sqrt{1 + \zeta^2} }{ \zeta + \sqrt{1 + \zeta^2} } },\end{equation}
where  $\zeta$ is the downstream distance from the rotor hub, normalised by the rotor radius. To a first-order approximation, this distance was taken to be that from the rotor hub to the pivot location. The wake radius used in the current study was
  $\mathcal{R} = 0.861 R$.
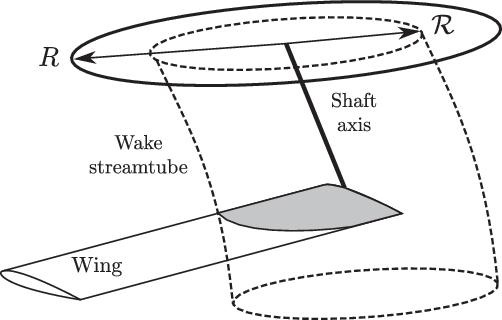
Figure 5. Rotors-on-wing download interaction using the projected streamtube model. The immersed portion of the wing is illustrated in grey.
The aerodynamic forces and moments generated by each wing section are then determined from the freestream velocity and, where necessary, the superposition of the wake velocity. The velocity components account for geometrical aspects of the wing (dihedral, sweep and twist) and are used to determine the section angle-of-attack and Mach number. These quantities are then used to interpolate a lookup table of compressible aerodynamic data at the flap/flaperon setting and rotor tilt angle specified in the operating point file. The drag force and pitching moment of the nacelles are also computed in this module using the GTRS model(Reference Ferguson9). The nacelle drag is interpolated from a user-defined lookup table. The wing section loads are integrated along the span and transformed with the nacelle loads into the body-fixed axes.
2.4 Empennage module
The effect of the rotor wakes at the tailplane was determined experimentally by analysing pitching moment data at tail-on and tail-off conditions(Reference Marr, Sambell and Neal15,Reference Marr, Ford and Ferguson16,Reference Wilson, Mineck and Freeman18) . These data were used to formulate an empirical reduced-order model that could be used to simulate the effect of the rotors-on-tailplane interaction in aeromechanics investigations. In the GTRS model of the XV-15, the empirical data are a function of the airspeed  $V_\infty$, fuselage angle-of-attack
  $\alpha_F$ and rotor tilt angle
  $\tau$ and are used to augment the tailplane angle-of-attack and dynamic pressure. Unfortunately, a large database of empirical and/or numerical data for different configurations and operating conditions is not available to approximate the RoE interaction for tiltrotor aircraft. As such, the modelling strategy implemented for the GTRS model of the XV-15 was also implemented in this work. In addition to the RoE interaction, a WoE interaction is also introduced through the presence of the lifting wing. This interaction induces a downwash at the tailplane acting to reduce the angle-of-attack and may also change the dynamic pressure at the empennage.
The RoE and WoE interactions are modelled from user-supplied lookup tables. The RoE interaction is a function of airspeed, fuselage angle-of-attack and rotor tilt and operates on the mean induced velocity component of the rotors and freestream dynamic pressure. The WoE interaction is a function of flap/flaperon setting, fuselage angle-of-attack and rotor tilt and gives the mean downwash at the tailplane. A separate lookup table is required for each flap/flaperon setting. All the correction factors are linearly interpolated from supplied lookup tables. The RoE and WoE interaction data were taken from the GTRS model of the XV-15(Reference Ferguson9) since this is the reference aircraft used here. For generality, however, these lookup tables can be populated from experimental or numerical simulations to represent different tiltrotor aircraft and/or empennage configurations. The tailplane angle-of-attack and dynamic pressure,  $\alpha_T$ and
  $\mathcal{Q}_T$, are calculated from
 \begin{align}
\alpha_T & = i_0 + \text{atan}\left(\frac{w + w_i}{u + u_i}\right) - \varepsilon, \end{align}
\begin{align}
\alpha_T & = i_0 + \text{atan}\left(\frac{w + w_i}{u + u_i}\right) - \varepsilon, \end{align}
 \begin{align}
\mathcal{Q}_T & = \mathcal{Q}_{WoE} \: \mathcal{Q}_{RoE} \: \mathcal{Q}_\infty,\end{align}
\begin{align}
\mathcal{Q}_T & = \mathcal{Q}_{WoE} \: \mathcal{Q}_{RoE} \: \mathcal{Q}_\infty,\end{align}
where  $i_0$ is the tailplane setting angle (set to
  $i_0 = 0\ {\rm deg}$ in the present study), u and w are the body velocity components,
  $u_i$ and
  $w_i$ are the rotor-induced interaction velocity components,
  $\varepsilon \equiv \varepsilon(\xi_f/\xi, \: \alpha_F, \: \tau ) $ is the downwash angle,
  $\mathcal{Q}_{RoE} \equiv \mathcal{Q}_{RoE}(V_\infty, \: \alpha_F, \: \tau) $ is the RoE dynamic pressure correction factor and
  $\mathcal{Q}_{WoE}$ is the WoE dynamic pressure correction factor (set to
  $\mathcal{Q}_{WoE} = 1$ in the present study). The rotor interaction velocity components are calculated from
 \begin{eqnarray} u_i &=& \phantom{-} \left( \upsilon_{RoE} \, \upsilon_0 \right) \sin\tau, \end{eqnarray}
 \begin{eqnarray} w_i &=& - \left( \upsilon_{RoE} \, \upsilon_0 \right) \cos\tau,\end{eqnarray}
where  $\upsilon_{RoE} \equiv \upsilon_{RoE}(V_\infty, \: \alpha_F, \: \tau)$ is the RoE induced velocity correction factor and
  $\upsilon_0$ is the mean induced velocity at the disc. The flow schematic at a tailplane section is shown in Fig. 6. The aerodynamic loads of the fins are computed without any interaction considerations as they make only a small contribution to the aircraft loads in longitudinal flight. The empennage angle-of-attack is then used to interpolate the lift, drag and pitching moment coefficients at the corresponding Mach number and control input. Finally, the empennage loads are then transformed into body-fixed axes.
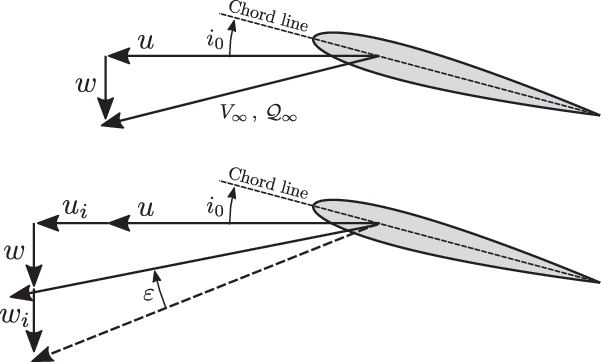
Figure 6. Flow schematic of a tailplane aerofoil section. The top figure shows the freestream flow components used to calculate the dynamic pressure. The bottom figure shows the interaction velocity components and flow angles used to calculate the angle-of-attack.
3.0 RESULTS AND DISCUSSION
The operating parameters of the XV-15 were taken from the trim data of the GTRS model(Reference Ferguson36) and are summarised in Table 1. The vehicle centre of gravity, given for helicopter mode, is at the aft limit and is displaced with the forward tilt of the rotors. Trim maps for the XV-15 aircraft were simulated for five cases:
(1) Isolated components with no interactions
(2) Isolated components with RoW interaction only
(3) Isolated components with RoE interaction only
(4) Isolated components with WoE interaction only
(5) Isolated components with RoW, RoE and WoE interactions collectively
Table 1 Summary of the XV-15 operating parameters
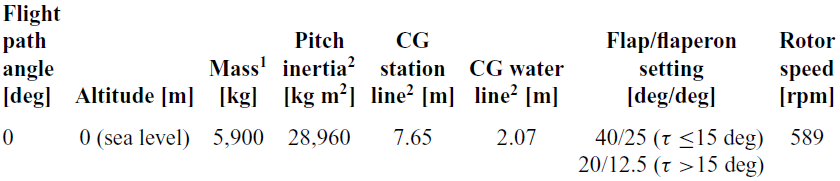
1Aircraft mass at design gross weight.
2Referenced to the aircraft at design gross weight, aft cg setting and with the rotors vertical (helicopter mode). These parameters are updated in the code as functions of the rotor tilt angle, detailed in Ferguson(Reference Ferguson9).
The trim maps were simulated over a rectangular grid of airspeeds and rotor tilt angles. The airspeed domain was simulated from hover to 300 kn forward speed at 5 kn intervals. The rotor tilt angle domain was simulated from helicopter mode ( $\tau = 0\ {\rm deg}$) to aeroplane mode (
 $\tau = 90\ {\rm deg}$) at 15 deg intervals. The truncation of each trim map into a conversion corridor was determined by imposing two performance constraints on the trim point: the required power did not exceed the installed power
  $P_{max}$ and the amplitude of the gimbal tilt did not exceed the tilt limit
  $\beta_{max}$(Reference Maisel1,Reference Ferguson9) :
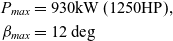 \begin{align*} P_{max} &= 930{\rm kW} \: (1250{\rm HP}), \\ \beta_{max} &= 12\ {\rm deg} \end{align*}
where the gimbal tilt amplitude is given by
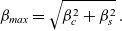 \begin{equation} \beta_{max} = \sqrt{\beta_c^2 + \beta_s^2} \,.\end{equation}
The predicted conversion boundaries were accurate to within the simulated airspeed interval of 5 kn. The predicted conversion corridors were also compared with the literature corridor of the XV-15 presented by Maisel et al.(Reference Maisel, Giulianetti and Dugan43). However, the aircraft configuration and trim constraints used to determine this conversion corridor were not presented, and therefore, it serves only as a reference corridor. The predicted trim behaviour and aircraft performance were compared with the GTRS results(Reference Ferguson36) for validation of TARA and to assess the interactional effects between the aircraft components. In the absence of available flight test data, the GTRS data remain the only source of trim and performance data for tiltrotor aircraft in the public domain. It is recognised, however, that the GTRS data are only a mathematical model but have shown good validation to proprietary flight test data(Reference Ferguson36). The published corridor boundaries and GTRS trim points are shown in Fig. 7 and highlight some discrepancies at both the min-speed and max-speed boundaries.
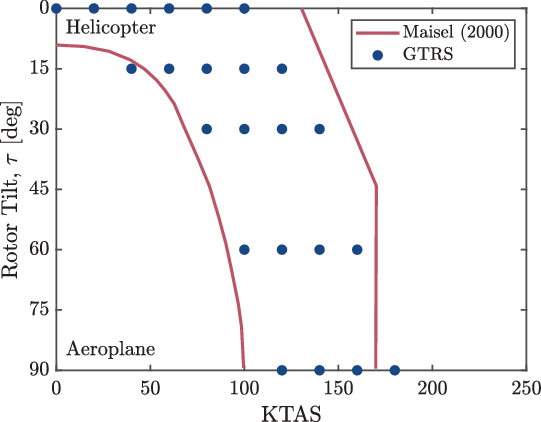
Figure 7. Published conversion corridor of the XV-15 aircraft from Maisel et al.(Reference Maisel, Giulianetti and Dugan43) and the GTRS trim points from Ferguson(Reference Ferguson36).
The predicted trimmed pitch attitude through the conversion corridor is shown in Fig. 8. The predicted trim attitudes showed overall good agreement with the GTRS points. The RoW interaction was found to have a small influence on the pitch attitude up to approximately 50 kn forward speed, past which the rotor wakes were convected over the wing. As the forward speed increased beyond 100 kn, the incidence angle of the rotors and their proximity to the wing reimmersed the outboard wing sections in the rotor wakes. A small increase in pitch attitude was found due to the rotor downwashes, and therefore lower angles-of-attack, of the immersed wing sections. The effects of the RoE and WoE interactions at the tailplane were opposing: the RoE induced an upwash; the WoE interaction induced a downwash. From the pitch curves in Fig. 8(b) and (c), the empennage forces had a significant effect on the trimmed pitch attitude at lower forward speeds up to approximately 120 kn. The RoE upwash at the tailplane tended the trimmed pitch attitude more nose-down, particularly around 50 kn. This behaviour was expected since the interaction model was correlated to experimental data(Reference Marr, Sambell and Neal15,Reference Wilson, Mineck and Freeman18) . On the other hand, the WoE downwash resulted in a more nose-up pitch attitude. The strong coupling of the empennage interactions to the fuselage pitch attitude at low forward speeds was due to the control moments being provided by the rotor thrusts. At these low forward speeds, the aircraft lift was derived largely from the rotor thrusts, and therefore, tilting the thrust vectors to provide the trim moment was reacted with a change in fuselage attitude since the rotor tilt angle was fixed.
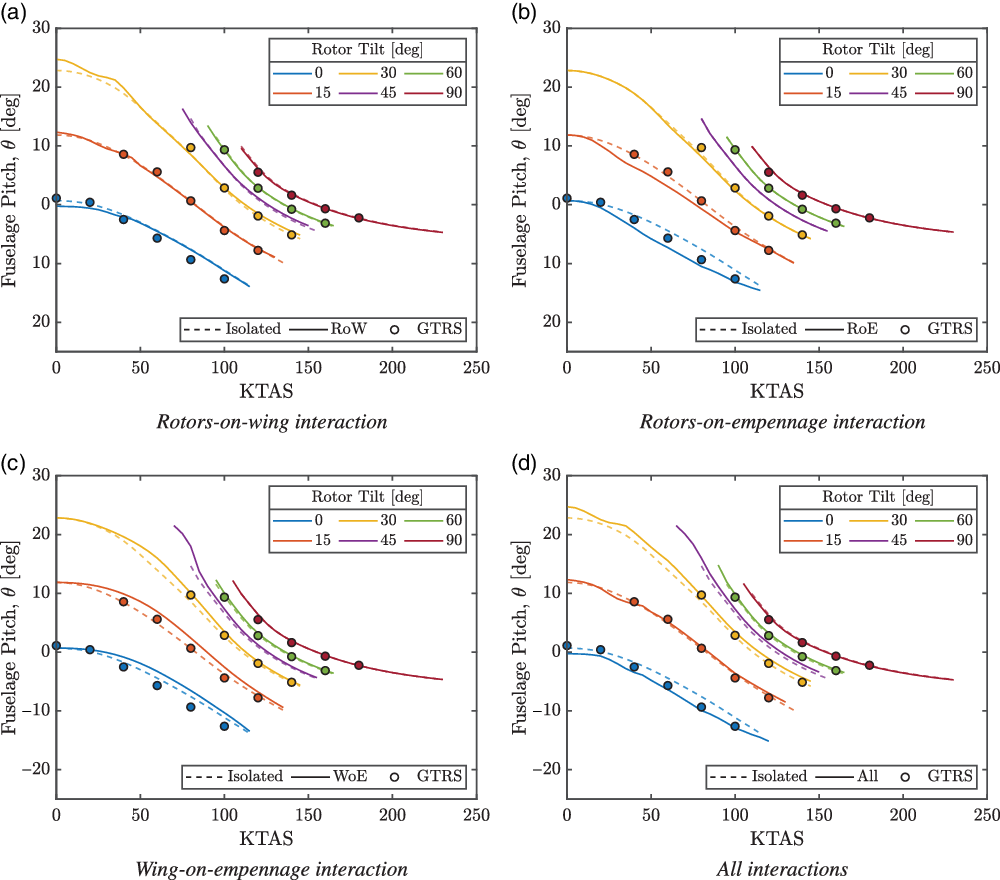
Figure 8. Trimmed pitch attitude through the conversion corridor. GTRS trim points from Ferguson(Reference Ferguson36).
As the rotors were tilted towards aeroplane mode, the fuselage attitude opposed the rotor tilt and pitched more nose-up. This reactive pitching behaviour helped reorientate the rotor thrust vectors against the aircraft weight to provide the required lift. As the fuselage pitched nose-up against the forward tilt of the rotors, the downwash at the tailplane was increased due to the increased lift coefficient of the wing. The downwash angles at the tailplane through the conversion corridor are shown in Fig. 9 and indicate the large downwashes towards helicopter mode. These were a result of the flap/flaperon settings used to alleviate the wing download in hover. The large downwash angles at the tailplane reduced the lift and resulted in an increased nose-up moment compared with the no-interaction case. The reduced nose-down moment was recovered by an increased forward tilt of the gimbal (and thrust vector) and, consequently, an increased nose-up pitch attitude. After a rotor tilt of 45 deg, the fuselage pitch attitude was negligibly affected by all the considered interactions, both singularly and collectively. Figure 8(d) shows that the RoE interaction was dominant in helicopter mode, but as the rotors were tilted forwards, the WoE interaction became dominant as evidenced by the increased nose-up fuselage attitude. The cause of this was due to the reactive behaviour of the pitch against the rotor tilt, which caused large nose-up attitudes and, therefore, large downwash angles.
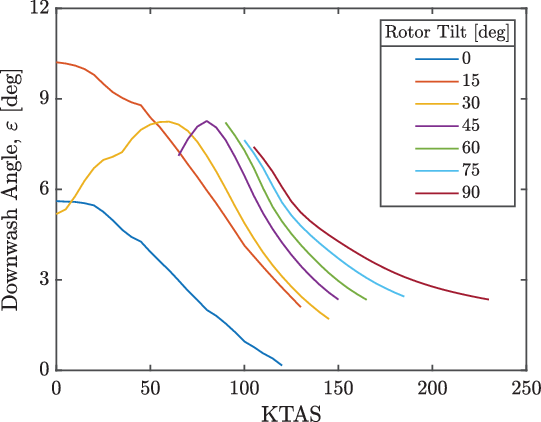
Figure 9. Downwash angle at the tailplane through the conversion corridor considering all the interactions.
The predicted longitudinal tilt angles of the gimbal are shown in Fig. 10. The considered interactions were found to have a significant effect throughout the conversion corridor, except for in aeroplane mode. The latter was due to the washout of the cyclic control in aeroplane mode. The tilt of the gimbal was affected by the rotor incidence, cyclic input and thrust setting and, therefore, influenced by all the considered interactions. When all interactions were accounted for, the correlation of the gimbal angles with the GTRS data agreed well. However, the amplitude of the gimbal tilt was predicted more aft, and this was likely attributable to differences in predicted rotor incidence, stick position and required thrust.
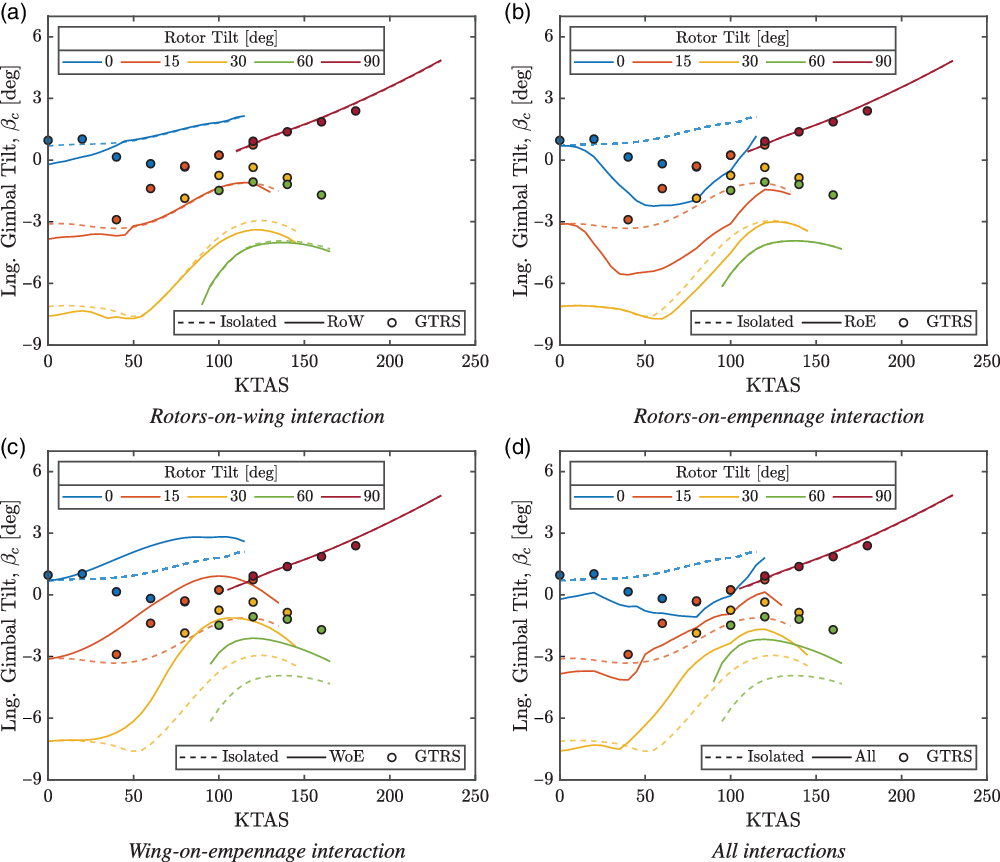
Figure 10. Longitudinal gimbal tilt angle through the conversion corridor. GTRS trim points from Ferguson(Reference Ferguson36).
The trimmed stick position through the conversion corridor is shown in Fig. 11. The stick position for the isolated component case was found to be predicted more forwards towards helicopter mode and more aft towards aeroplane mode compared with the GTRS data. The stick curves exhibited typical trends of rotary-wing and fixed-wing aircraft in helicopter and aeroplane mode, respectively. The effect of the RoW interaction, shown in Fig. 11(a), on the stick position was small due to the position offset of the exerted download force at the simulated cg setting. A larger influence would be expected for larger cg offsets. The forward stick position was found to be a constraining parameter in helicopter mode at the max-speed boundary for all the considered interaction cases. Similarly, for the interaction cases not including the WoE interaction, the aft position of the stick was found to be near the aft limit towards aeroplane mode.
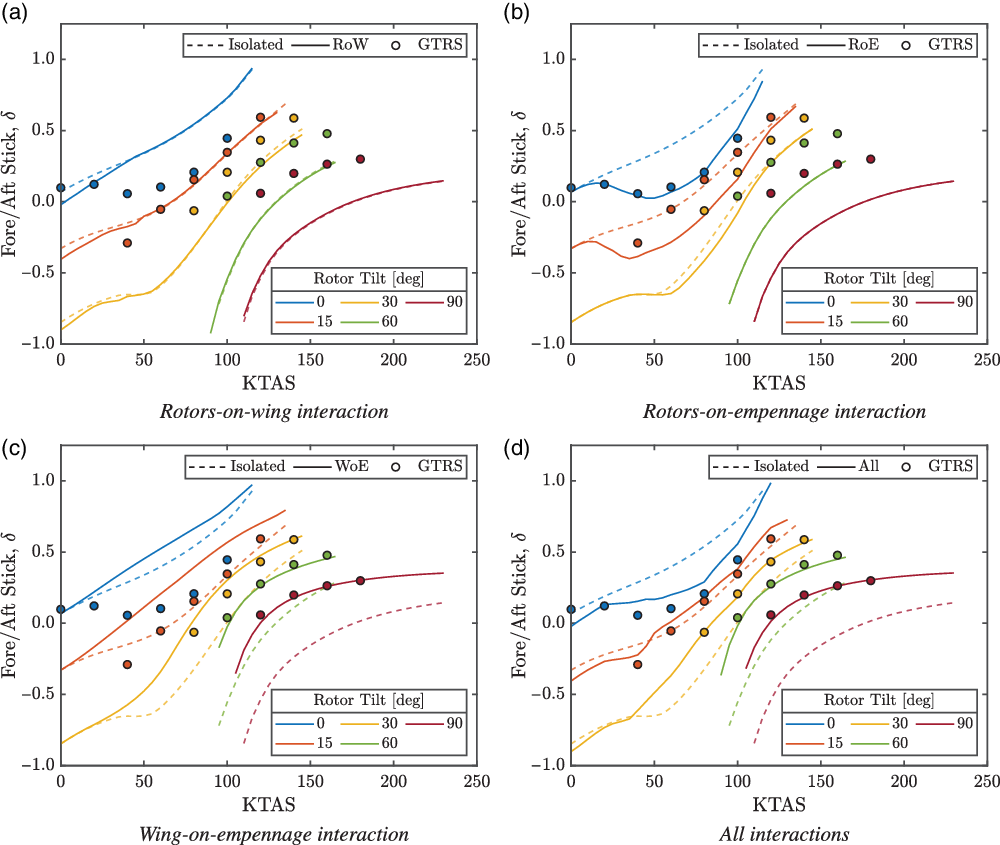
Figure 11. Trimmed stick position through the conversion corridor. GTRS trim points from Ferguson(Reference Ferguson36).
The WoE interaction was found to migrate the stick position more forwards compared with the isolated component case due to the reduced tailplane angle-of-attack for a given stick position. This increased control margin available was the reason for the large fuselage pitch attitude, beyond the wing stall angle-of-attack, at the low-speed boundary at 45 deg rotor tilt in Fig. 8(c) and (d). At this condition, the rotor thrusts were used to provide the required lift force. The reversal of the stick gradient with respect to the airspeed demonstrated in experimental studies(Reference Marr, Sambell and Neal15,Reference Marr, Ford and Ferguson16,Reference Wilson, Mineck and Freeman18) was found only for the RoE case. When the RoE upwash was combined with the WoE downwash, a stick reversal was not found, but a shallow gradient was still present around 50 kn in helicopter mode. The stick reversal was modelled semi-empirically by correcting the rotor-induced velocity component, and therefore, the absence of the stick reversal could be due to differences between the rotor models. Additionally, the RoE interaction model in the GTRS model was calibrated to give the expected stick reversal and would likely need recalibrating to the rotor model implemented in TARA. The opposing effects of the RoE and WoE interactions and their couplings to the pitch attitude at low speed, therefore, require that both interactions should be included to accurately predict the trim behaviour. Furthermore, due to the large flap/flaperon settings required to alleviate the hover download and the reactive behaviour of the fuselage pitch with forward rotor tilt, the WoE downwash is significant even in helicopter mode at low forward speeds.
The largest effect on trim behaviour was found from the WoE and RoE interactions in both helicopter mode (pitch and stick considerations) and aeroplane mode (stick considerations). These types of interactions would likely be present for conventional tiltrotor aircraft throughout the operating domain due to the freestream convection of the respective wakes. Therefore, the design of the empennage for tiltrotor aircraft is an important consideration, and its configuration can be used to modify the impact and occurrence of the WoE and RoE interactions, i.e. the H-tail, V-tail and T-tail configurations seen on today’s tiltrotor aircraft. Furthermore, the hybrid control strategy between the rotary-wing and fixed-wing control will also couple into the empennage design. These considerations can then be used to optimise aspects of flight procedures, handling qualities and aircraft performance.
The steady rotor thrust through the conversion corridor is shown in Fig. 12. The required thrust was found to decrease steadily from helicopter mode to aeroplane mode due to the increasing wing lift. The RoE and WoE interactions had a fairly small influence on the required thrust overall but did affect the predicted performance more towards helicopter mode as shown in Fig. 12(b) and (c). This was caused by the coupling between the fuselage pitch, wing lift and empennage interaction. Figure 12(a) shows that the RoW interaction had the largest influence on the required thrust due to the large download forces exerted in hover. This quickly reduced with forward speed, and the rotor wakes were predicted to be off the wing by 50 kn. The RoW interaction was also found to increase the rotor thrusts at both higher forward speeds and increased rotor tilt angles towards aeroplane mode. This was a consequence of the reduced lift from the wing sections immersed in the rotor downwash velocity that was compensated for by the increased rotor thrust.
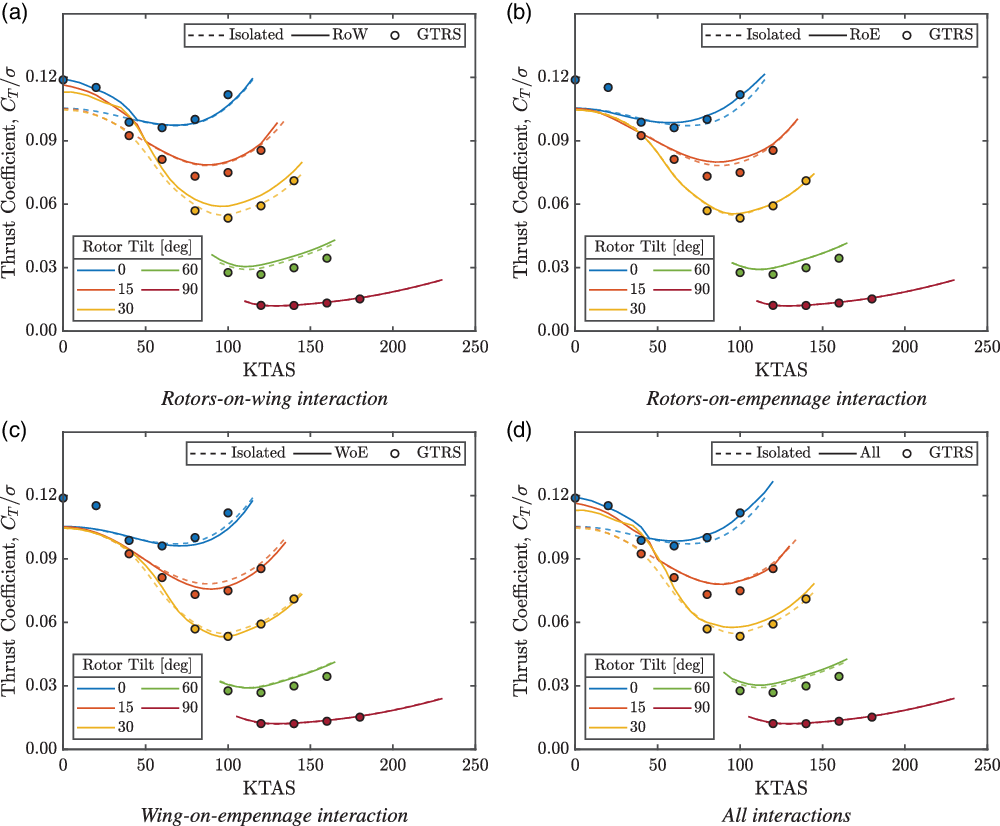
Figure 12. Rotor thrust through the conversion corridor. GTRS trim points from Ferguson(Reference Ferguson36).
The steady rotor power through the conversion corridor is shown in Fig. 13. The predicted power correlated well to the GTRS model but was found to be generally slightly underpredicted. This could be attributed to several implicitly related inaccuracies within the rotor model: aerodynamic data, linear induced inflow distribution, prescribed tip loss and induced power correction factors. The rotor power was, however, found to be largely overpredicted towards higher airspeeds for 60 deg rotor tilt. From Fig. 13, the corridor was power-limited at all rotor tilt angles other than helicopter mode. The changes in predicted power follow similarly to the thrust changes in Fig. 12 and show that the largest increase in power was due to the RoW interaction. The increased power was easily accommodated at the sea-level conditions simulated here but was completely undesirable. The RoE and WoE interactions produced small changes to the predicted power consistent with the change in required thrust from Fig. 12.
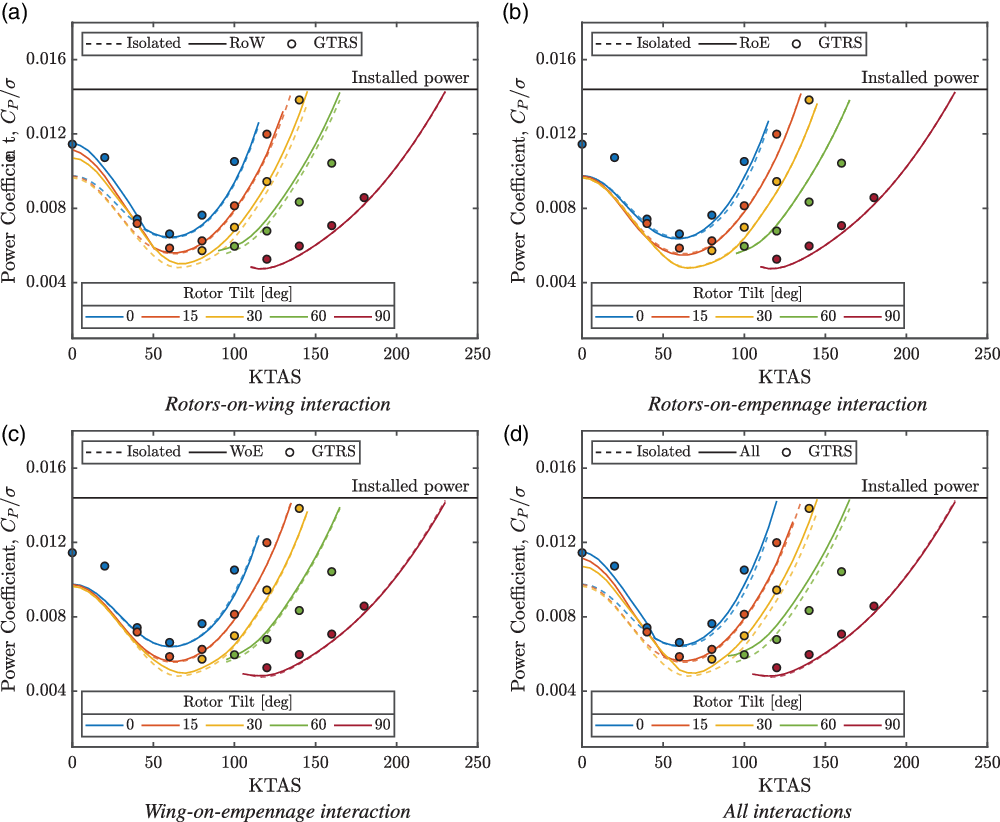
Figure 13. Rotor power through the conversion corridor. GTRS trim points from Ferguson(Reference Ferguson36).
The predicted conversion corridors for the isolated components and all interaction cases are shown in Fig. 14. The corridor for the isolated components case is illustrated by the dashed black lines, and the published corridor boundaries from Maisel(Reference Maisel, Giulianetti and Dugan43) are shown in red. The predicted conversion corridor accounting for all the interactions is illustrated by the filled green region. The predicted boundaries broadly agree with the published corridor. However, hovering flight was overpredicted compared with the reference corridor and was viable through rotor tilts up to 30 deg. This discrepancy was likely caused by the absence of any constraint for the fuselage pitch attitude, which, from the reactive behaviour of the pitch against the rotor tilt, can be of comparable size to the rotor tilt angle in hover. From the reference corridor, a pitch-up attitude constraint of approximately 10–15 deg could be inferred, and these values are consistent for a similar tiltwing configuration aircraft(Reference Nannoni, Giancamilli and Cicale44). The max-speed boundary was underpredicted from helicopter mode to 60 deg rotor tilt and was then overpredicted. The vertical line emanating from the reference corridor at 170 kn was imposed by the flap/flaperon deflections and structural considerations(Reference Maisel1). Such constraints were not considered in the performance constraints imposed here, and therefore, the observed discrepancy is attributable to this. The discrepancy at the max-speed boundary towards helicopter mode compared with the published corridor could be due to differences in the flap/flaperon settings. A clean wing configuration would have reduced the required power and, therefore, increased the max-speed boundary.
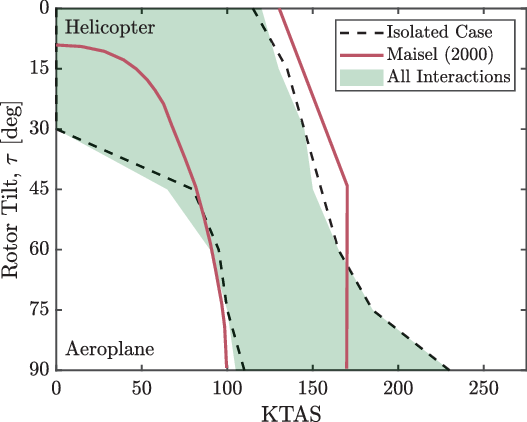
Figure 14. Predicted conversion corridors compared with the isolated (baseline) case and the published XV-15 corridor(Reference Maisel, Giulianetti and Dugan43).
The max-speed boundary was typically power-limited at all rotor tilt angles for all the interaction cases. The considered interactions had a small effect on the predicted power, and therefore, the max-speed boundary was negligibly affected by any of the interaction cases. The min-speed boundary was constrained largely by the wing stall and, in some cases, by the aft stick position towards aeroplane mode. The inclusion of the WoE interaction migrated the stick position forwards, removing this constraint and marginally improving the min-speed boundary.
4.0 CONCLUSIONS
The influence of interactional aerodynamics on the conversion corridor of tiltrotor aircraft has been investigated. An in-house aeromechanics code, TARA, was used to build the XV-15 model and was configured to the GTRS data(Reference Ferguson9). The numerical code consisted of a suite of aerodynamic modules called by a main flight mechanics module to trim the aeroplane model. TARA was used to investigate the effects of the RoW, RoE and WoE interactions on the predicted trim behaviour, aircraft performance and conversion corridor boundaries both singularly and collectively. The RoW interaction was characterised by a download on the airframe arising from the rotor downwashes on the wing. On the other hand, the RoE and WoE interactions resulted from the vortical wakes of the rotors and wing inducing both an upwash and downwash on the tailplane. The max-speed boundary of the conversion corridor was found to be insensitive to the included interactions, both singularly and collectively. This was due to the small impact on the aircraft performance that the interactions had at high speed. The WoE interaction was found to marginally improve the min-speed boundary due to the more-forwards stick position compared with the baseline case created by the smaller nose-up moment from the tailplane.
The empennage interaction had a significant effect on the aircraft trim behaviour throughout the conversion corridor. In helicopter mode, the RoE interaction was the dominant interaction and tended the pitch trim nose-down due to the coupling between the pitch and gimbal tilt. As the rotors were tilted forwards, the pitch behaviour reacted to the tilt and pitched the fuselage more nose-up. The WoE downwash then became dominant due to the increased wing angle-of-attack and was compounded by the large flap/flaperon deflections used to alleviate the download. The empennage interaction affected both the pitch attitude and stick position throughout the conversion corridor. Therefore, the design of the empennage is an important consideration for tiltrotor aircraft, and its size, position, configuration and control strategy could significantly affect the impact and occurrence of the aerodynamic interactions on the trim behaviour. Finally, the accurate prediction of the trim, performance and conversion boundaries should include all the interactions between the rotors and airframe components. The inclusion of the WoE had the largest effect on the predicted trim, but including this interaction singularly will bias the trim predictions more nose-up. Furthermore, the stick reversal caused by the RoE interaction would not be predicted, which could influence the stability of the trim points at lower forwards speed nearer helicopter mode.
ACKNOWLEDGEMENTS
The Aircraft Research Association (ARA) is thanked for supporting the first author on his doctoral degree programme. This work originated from the UK Vertical Lift Network through the project Methods and Experiments for Rotorcraft (MENtOR: EPSRC Grant EP/S010092/1).


 Open access