


1. Introduction
There have been a lot of analytical, experimental and numerical studies on shock wave reflections and transitions in the steady, pseudo-steady and unsteady frameworks over many years to understand the characteristic changes in the flow field (Ben-Dor Reference Ben-Dor2007). In the steady case, the supersonic flow with a constant velocity moves over stationary bodies, creating shock waves and their reflections on a reflecting surface/flow interface. In a pseudo-steady flow, a shock wave of constant velocity moves over the reflecting surfaces, which consists of straight elements, to form reflections and refractions. In a pseudo-steady flow, the shock structures, in general, exhibit self-similarity.
Unsteady flow, on the other hand, deals with either a planar shock wave moving over a curved surface, a curved shock wave moving over a planar surface or a curved shock wave moving over a curved surface. Both the shock wave velocity and the incidence angle of the shock wave vary continuously as the shock wave traverses over the reflecting surface in an unsteady flow. In such cases, the unsteady shock wave motion manifests transition from one type of reflection to the other depending on the shock wave Mach number and the geometry of the reflecting surface. Self-similarity is not generally observed in unsteady reflections.
There are many analytical models, although not conclusive, to predict the shock wave structures and its transitions in unsteady flows. There are many experimental studies also in unsteady flows to understand the characteristic change in the planar shock wave structures when it moves over either concave or convex surfaces or a curved shock wave that moves over planar surfaces.
In general, shock wave transitions refer to the transition from Mach reflection (MR) to regular reflection (RR) or vice versa ( $\textrm {RR}\rightarrow \textrm {MR}$). Planar shock waves moving over cylindrical surfaces, however, encounter multiple shock wave transitions due to the continually changing surface angles. The monograph by Ben-Dor (Reference Ben-Dor2007) explains the earlier studies on unsteady shock wave reflections over curved surfaces and corresponding shock wave transitions. Significant among them are the elaborate experimental studies on shock waves moving over concave and convex surfaces by Takayama & Sasaki (Reference Takayama and Sasaki1983) for different surface radii and initial wedge angles. The shock wave reflections observed over a concave or a convex surface can be an RR, a double Mach reflection (DMR), a transitional Mach reflection (TMR) or a single Mach reflection (SMR or MR) depending on the initial wedge angle of the reflecting surface and the incident shock Mach number (
 $M_{s}$). Their experiments identified that
  $\textrm {MR}\rightarrow \textrm {RR}$ transition occurs over a concave surface through intermediate reflections, TMR and DMR, respectively. On a convex surface, on the other hand, an RR undergoes a transition to an MR through intermediate reflections such as DMR and TMR, respectively. These shock wave reflections were found to depend mainly on the incident shock wave Mach number, the curvature of the cylindrical surface and the initial wedge angle of the reflecting surface.
Later studies were mainly focused on understanding the  $\textrm {MR}\rightarrow \textrm {RR}$ transition on a concave surface and the
  $\textrm {RR}\rightarrow \textrm {MR}$ transition on a convex surface and predicting the criteria for these transitions. Numerous experiments and computational studies have been carried out since then to understand the non-stationary shock wave behaviour over curved surfaces. Understanding the
  $\textrm {MR}\leftrightarrow \textrm {RR}$ transition and deriving transition models in unsteady flows have been a significant field of interest among researchers for many years. The difficulty in predicting the exact transition criteria in unsteady flow fields was the main reason behind this. The first transition model was developed by Itoh, Okazaki & Itaya (Reference Itoh, Okazaki and Itaya1981) for concave and convex surfaces to predict the
  $\textrm {MR}\rightarrow \textrm {RR}$ and
  $\textrm {RR}\rightarrow \textrm {MR}$ transition angles, respectively. Later, Ben-Dor & Takayama (Reference Ben-Dor and Takayama1985) derived a simpler model to find out the transition angles for the
  $\textrm {MR}\rightarrow \textrm {RR}$ transition on a concave surface but failed to account for the radius of curvature of the cylindrical wedge, which also is an influencing parameter. Many studies later predicted the shock wave transition in the unsteady reflection regime. Skews & Kleine (Reference Skews and Kleine2010) carried out experiments on convex circular surface with small radii to investigate the
  $\textrm {RR}\rightarrow \textrm {MR}$ transition. They observed an early
  $\textrm {RR}\rightarrow \textrm {MR}$ transition in the experiments compared with the transition angle for sonic conditions on plane surfaces. High resolution computational studies were carried out by Hakkaki-fard & Timofeev (Reference Hakkaki-fard and Timofeev2012) and introduced three different techniques to determine the
  $\textrm {RR}\rightarrow \textrm {MR}$ transition criteria over a convex cylindrical surface. Two of the techniques showed the transition criteria agreed very well with the sonic criteria obtained from the two-shock theory. A study on shock wave interaction with convex cylindrical surfaces was also conducted by Sun et al. (Reference Sun, Yada, Jagadeesh, Onodera, Ogawa and Takayama2003) over rotating cylinders and it was found that the rotation of the cylinder had no significant effect on the
  $\textrm {RR}\leftrightarrow \textrm {MR}$ transition. The
  $\textrm {RR}\rightarrow \textrm {MR}$ transition along with the rate of growth of the Mach stem over convex surfaces was further studied by Geva, Ram & Sadot (Reference Geva, Ram and Sadot2018) using high resolution experiments and computation. They observed that the shock wave transition in unsteady flows is also influenced by the rotation of the reflected shock wave about the point of reflection, which makes it different from the pseudo-steady transition. Recently, Wang & Zhai (Reference Wang and Zhai2020) studied the unsteady
  $\textrm {RR}\rightarrow \textrm {MR}$ shock transitions over convex and straight wedges when planar and curved shocks move over them. Irrespective of the effect of unsteady flow and shock intensity, it is found that the inviscid shock transition over a convex wedge can be predicted by pseudo-steady transition criteria. Even with such extensive research, a good transition model remains a debatable question in the transient flow.
Along with the  $\textrm {MR}\leftrightarrow \textrm {RR}$ transition studies, the possibility of shock wave focussing over circular surfaces was also investigated on concave surfaces. It was found that the varying shock wave Mach number and surface depth of the reflectors characterized the shock wave reflection pattern and focussing (Izumi, Aso & Nishida Reference Izumi, Aso and Nishida1994). Skews & Kleine (Reference Skews and Kleine2007) also conducted shock wave focussing studies on concave cavities, the development and interaction of shear layers and development of Kelvin–Helmholtz (K–H) instability in the flow. The study of shock reflections over multiple reflectors by Ben-Dor, Dewey & Takayama (Reference Ben-Dor, Dewey and Takayama1987) using compressive and expansive double wedges found the existence of seven types of reflection combinations over the surface. A similar study on curved surface using a double concave reflector by Soni et al. (Reference Soni, Hadjadj, Chaudhuri and Ben-Dor2017) investigated the shock reflection and transitions in the first and second reflectors under different geometric parameters and identified an unusual shock transition pattern for the first time. Based on the three-shock theory and the shock reflection over a double wedge, the trajectory of the triple point over a concave cylindrical wedge was theoretically predicted by Yuan et al. (Reference Yuan, Zhou, Mi and Ng2020).
The features of the shock wave reflection structures in unsteady reflections are relatively well observed, and reasonable conclusions have been drawn. However, the unsteady scenarios, such as the movement of planar shock waves in complex geometries involving concave or convex surfaces or a combination of both, have been hardly studied. For example, it would be intriguing to see how an RR transitions to an MR or vice versa on these complex geometries. A coupled convex circular arc followed by a straight surface oriented at  $45^\circ$ was used at different radii by Skews & Blitterswijk (Reference Skews and Blitterswijk2011) to experimentally study the transition phenomenon. A surface information propagation study was also conducted to check how a flow responds to surfaces of different curvatures and slopes combined. It was observed that the shock wave takes a finite time to adjust to the changing boundary conditions.
Geva, Ram & Sadot (Reference Geva, Ram and Sadot2013) conducted an experimental study on a coupled concave–convex surface of equal radii, to find the  $\textrm {MR}\rightarrow \textrm {RR}$ transition criterion on the concave surface followed by
  $\textrm {RR}\rightarrow \textrm {MR}$ transition on the convex surface. Ram, Geva & Sadot (Reference Ram, Geva and Sadot2015) carried out a similar experimental study on the
  $\textrm {RR}\rightarrow \textrm {MR}$ transition on the convex surface followed by
  $\textrm {MR}\rightarrow \textrm {RR}$ transition on the concave surface using a coupled convex–concave geometry. Both these studies investigated the non-stationary shock wave transitions when a planar shock wave traverses up a coupled concave–convex and a convex–concave surface of equal radii. In the coupled geometry, the initial transition is the same as that in a concave or convex surface. In the second half of the geometry, a secondary reflection is formed at the foot of the primary reflection. Along a similar line, it would be interesting to see how the shock wave structures change, if a scenario is thought of where the moving shock wave ramps down on a coupled convex–concave surface. The moving planar shock wave travels over the concave surface after passing over the convex surface. The coupled surface is smoothly connected to a plane surface at the end. The effect of curvature changes and slope changes on the shock wave reflections is analysed here. The situation may be analogous to the movement of a starting shock in contoured wind tunnel nozzles in an inviscid/viscous environment. There are no previous studies of this sort where the shock wave is traversing down a complex curved surface. The present study is hence to investigate the characteristic changes in shock wave reflections and transitions when a planar shock wave travels over a ramp of coupled convex–concave surfaces of equal radii, experimentally in a shock tube facility and numerically using an in-house
  $5\textrm {th}$-order finite volume WENO (weighted essentially non-oscillatory) code. The effect of convex and concave geometries on the structure and transition of the shock wave during its motion, and the nature of the flow structures behind the shock wave are investigated in this study.
2. Experimental set-up
The experiments have been conducted using a shock-tube facility developed during this study at the Department of Aerospace Engineering, IIT Madras. The closed-end shock tube has a rectangular cross-section of  $100 \ \textrm {mm}\times 225\ \textrm {mm}$. The length of the shock tube is 5.5 m with a 1.5 m driver and a 4 m driven section separated by aluminium diaphragms of various thicknesses. It generates a planar shock wave at the test section attached to the end of the driven section. The other end of the test section is connected to the dump tank of a large diameter using a constant area duct. The driver section is pressurized using compressed air, and the driven section is evacuated using a vacuum pump. A schematic of the shock-tube facility is shown in figure 1.

Figure 1. Schematic of the shock-tube facility.
Two piezoelectric PCB pressure transducers of range 0–35 bar(a) each are used in the driven section, placed 1 m apart, for shock pressure measurements. The instantaneous pressure jumps measured when a shock wave passes over them are used to calculate the shock wave speed ( $V_{s}$) and hence the shock wave Mach number (
 $M_{s}$). The test section is a coupled convex–concave ramp of equal radii, 70 mm, followed by a plane section with a total length of 0.3 m as shown in figure 2.

Figure 2. (a) Test section for the downward ramp, (b) Downward ramp model (flow direction from right to left; all dimensions are in mm).
The shock wave structures are visualized using time-resolved shadowgraph technique, with an IX-726 high-speed camera having a maximum frame rate of  $10^6$ frames per second (f.p.s.) and a minimum exposure time of 293 ns with a
  $1\ \mathrm {\mu }\textrm {s}$ exposure time.
3. Numerical method
The numerical simulation is carried out using an in-house two-dimensional inviscid higher-order finite volume code. The higher order is achieved using the robust WENO reconstruction method by Jiang & Shu (Reference Jiang and Shu1996). The reconstruction gives oscillatory free solutions by using a weighted combination of a three parabolic reconstruction from a bigger stencil. The linear combination of the three parabolic reconstructions with the smaller stencil gives a fifth-order accurate reconstruction. The parabolic reconstruction is carried out using a Lagrange interpolating polynomial. To be essentially non-oscillatory in the presence of shock waves and to achieve higher-order accuracy, the scheme employs a smoothness indicator for each stencil, which measures the smoothness of the reconstructions, and the linear weights are modified based on the smoothness indicators. The final reconstruction based on this nonlinear weighting procedure will be fifth-order accurate in the smooth regions and at most third-order accurate in the regions close to the discontinuities. The reconstruction is carried out using the characteristic variable to achieve better stability and robustness in the presence of strong shock waves in the flow field. The flux is evaluated using the Harten–Lax–van Leer flux function, an approximate Riemann solver developed by Harten, Lax & van Leer (Reference Harten, Lax and van Leer1983). The time marching is carried out using the classical fourth-order Runge–Kutta solver.
The computational domain is shown in figure 3. The domain includes the shock tube along with the downward-facing ramp at one end. Inviscid wall boundary conditions are applied on all the sides of the shock tube other than the exit of the ramp, where the zero-order extrapolation of flow variables is applied. The flow variables in the driver section (region ‘A’) are initialized with the required driver pressure to generate the desired value of the shock wave Mach number ( $M_{s}$) in the shock tube and the driven section is initialized with the initial driven tube pressure. The entire simulation is carried out with a time step of
  $\textrm {d}t=10^{-8}$ s for which the global minimum time step for all the cells remains less than
  $10^{-8}$ s for every iteration.

Figure 3. Schematic of the computational domain. Regions A and B are the driver and driven sections, respectively.
3.1. Validation of the numerical simulations
The numerical simulation was validated using the results of the shock-tube experiment performed for shock wave Mach numbers  $M_{s}=1.2$, 1.44 and 2.2. The shock-tube flow was simulated for these values of
  $M_{s}$ with a planar shock wave moving down the convex–concave ramp.
An inviscid flow simulation was carried out using the chosen grid size (see the Appendix), for the same value of  $M_{s}$ with a time step
  $\textrm {d}t=10^{-8}$ s, and compared with that of the experiments. The flow field is visualized using a time-resolved shadowgraph technique, and images are captured by the IX-726 high-speed camera. The details regarding the experiment are given in table 1.
Table 1. Experimental details used for plotting the TP trajectory.

Figure 4 shows the combined images from the simulation and the experiment for various time instants for  $M_{s}=1.2$. Time
  $t=0$ is taken when the planar shock wave stands at the entrance of the ramp. The numerically predicted shock wave location and curvature match very well with those of the experiments. As the shock wave moves down the ramp, the shock wave curvature changes and becomes normal to the surface of the ramp in the convex region. With the change in the curvature of the surface, the shock wave curves further in the concave surface and turns into an irregular reflection (IR) with the formation of a Mach stem that grows in size as the shock wave moves further along the surface (
 $t=410\ \mathrm {\mu } \textrm {s}$). A similar comparison was carried out for
  $M_{s}=1.44$ for a few instances (figure 5). The shock wave location and its shape are very well predicted numerically in this case as well. The important characteristic in this case is the formation of a compression wave at the ramp surface (
 $t=414.1\ \mathrm {\mu }\textrm {s}$). The validation of shock structure for
  $M_{s}=2.2$ also shows a fairly good match with that of the experimental results (figure 6). More aspects of this are discussed in § 4.1.

Figure 4. Combined images from experiment (on the top) and numerical simulation (on the bottom, inverted fashion) for  $M_{s}=1.2$ at various time instants,
  $t$.
$t$.

Figure 5. Combined images from experiment (on the top) and numerical simulation (on the bottom, inverted fashion) for  $M_{s}=1.44$ at various time instants,
  $t$.
$t$.

Figure 6. Combined images from experiment (on the top) and numerical simulation (on the bottom, inverted fashion) for  $M_{s}=2.2$ at various time instants,
  $t$.
$t$.
The locations of the shock wave at various instances and the transition to IR in the simulation match very well with those of the experiment. The existing higher-order code is hence seen to capture shock waves without any oscillations and to predict the transient characteristics of the flow accurately.
4. Results and discussion
During the unsteady downward movement of a planar shock wave over the ramp, the changes in the structure and characteristics of the shock wave, the nature of the flow developed behind the moving shock wave and other associated flow structures in the domain were mainly investigated in this study. The experiments were carried out for shock wave Mach numbers of  $M_{s}=1.2$, 1.44, and 2.2 while the simulations were done for a wider range of shock Mach numbers, namely
  $M_{s}=1.2$, 1.3, 1.4, 1.44, 1.8, 2, 2.2, 2.6, 3.0, 3.4 and 3.8 to identify the shock wave structures and the flow behaviour on the ramp geometry.
4.1. Shock wave structure and transition over the ramp
A sequence of shadowgraph images in figure 7 shows the instantaneous behaviour of the planar shock wave moving over a ramp of a coupled convex–concave surface at a Mach number,  $M_{s}=1.44$. The time
  $t=0$ is assigned when the planar shock wave is positioned at the beginning of the ramp. In the convex region of the ramp, the shock wave curves in a concave nature with respect to the upstream flow such that the foot of the shock wave remains normal to the surface (figure 7a,b). A zoomed-in view of this is shown in figures 8(a) and 8(b), respectively.

Figure 7. Shadowgraph images of shock wave moving over the ramp at  $M_{s}=1.44$, captured at 157 099 f.p.s. with a resolution of
  $420 \times 200$ pixels and
  $1\ \mathrm {\mu }\textrm {s}$ exposure time.

Figure 8. Zoomed-in shadowgraph images of shock wave moving over the ramp at  $M_{s}=1.44$.
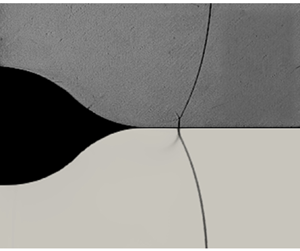
The curved shock wave with its foot normal to the convex surface now finds a surface of opposite curvature in the concave region of the ramp. On the concave surface, the shock wave tends to curve further (figure 7c) and generates a small kink at its foot of opposite curvature to continue its surface normalcy (figure 8c,d).
The downstream movement of the shock wave is also accompanied by the formation of compression waves on the ramp surface at  $t=324.9\ \mathrm {\mu } \textrm {s}$ (figure 7g) which later develop as a stationary standing shock wave with time (
 $t=586.0\ \mathrm {\mu }\textrm {s}$), as shown in figure 7(k). A flow separation visible in the downstream of the stationary shock wave is another prominent flow feature (figure 7k,l). The flow characteristics over the ramp surface are discussed in detail in § 4.2.
4.1.1. Triple point trajectory of IR
The curved shock wave transitions to an IR as it moves from the concave surface to the straight portion of the ramp. To identify the nature of the moving IR, the trajectory of the triple point (TP) is tracked using image processing techniques. The pixel locations of the TP are identified from the instantaneous shadowgraph images. The experimental results for  $M_{s}=1.2$, 1.44 and 2.2 are used in this analysis.
In the case of  $M_{s}=1.44$, the incident shock wave and the Mach stem have a thickness of two pixels. Figure 9(a) shows a background-subtracted shadowgraph image at
  $t=382.2\ \mathrm {\mu } \textrm {s}$ for
  $M_{s}=1.44$ with TP trajectories marked (‘red’ dots) for every time interval,
  $\textrm {d}t=12.7\ \mathrm {\mu } \textrm {s}$, starting from
  $t=216.6\ \mathrm {\mu } \textrm {s}$, where the curved shock wave touches the straight portion of the ramp and the kink develops at the foot of the curved shock wave (see figure 8d) and transforms into a small Mach stem standing perpendicular to the surface.

Figure 9. (a) The TP trajectory marked on the background-subtracted shadowgraph image for  $M_{s}=1.44$ at
  $t=382.2\ \mathrm {\mu } \textrm {s}$. (b) The TPs from computational fluid dynamics (CFD) and experiment (exp) are plotted on the
  $x$–
$x$– $y$ plane with a polynomial fit of second order (‘blue line’) for, (b)
  $M_{s}=1.44$, (c)
  $M_{s}=1.2$ and (d)
  $M_{s}=2.2$. The origin is at the starting point of the ramp surface, marked in (a).
Figure 9(b) shows the TP trajectories obtained from CFD (dots) and experiments (triangles) for  $M_{s}=1.44$. A polynomial fit of order two is obtained for the numerical data (plotted as ‘blue’ solid line) for comparison. From the experimental and numerical results, it is observed that the TP trajectory is curved with a positive slope. The TP trajectory angle (
 $\chi$) is the slope of this curve with the horizontal at each location. Similar results are observed for
  $M_{s}=1.2$ and 2.2 shown in figures 9(c) and 9(d), respectively. A curved TP trajectory (Yuan et al. Reference Yuan, Zhou, Mi and Ng2020) refers to a continuously varying shock wave reflection from one point to the other as the shock wave travels downstream. Table 1 gives the experimental details, pixel resolution and error bound for different
  $M_{s}$ values used to plot the TP trajectory.
4.1.2. Shock wave speed along the ramp
There are interesting flow features such as the shock wave transitions after the concave section, and a normal standing shock wave develops in the convex portion of the ramp. It is essential to understand the underlying mechanism in such flows. The information available from the experiments is always limited and mostly qualitative in nature. To gain a physical insight into these flow features, numerical simulations were hence carried out for a range of shock wave Mach numbers beginning from  $M_{s}=1.2$. Estimation of shock wave speed over the ramp surface was carried out from the numerical simulations for shock wave Mach numbers,
  $M_{s}=1.8$, 2.0, 2.2, 2.6, 3.0 and 3.4. The instantaneous shock wave locations (foot of the shock wave) over the ramp surface were tracked to find the shock wave speed (
 $V$) at each location. Figure 10 shows the variation of normalized shock speed (
 $V/V_{0}$) with distance along the ramp surface, where
  $V_{0}$ represents the speed of the planar shock wave for the specific
  $M_{s}$ value. This shows the interesting flow feature that the shock speed variation is self-similar in nature, irrespective of whether the incoming shock Mach number is in strong reflection or weak reflection domain. The curvature of the ramp shifts from convex to concave at
  $x=0.05\ \textrm {m}$ from the origin and the planar region begins at
  $x=0.1\ \textrm {m}$. Irrespective of the
  $M_{s}$ value, the shock wave speed is found to decrease in the convex surface and increase in the concave part of the ramp followed by a constant value in the plane region of the domain, due to the expansion and the compression of the induced flow behind the shock wave as detailed below.

Figure 10. Computed values of shock wave speed ratio ( $V/V_{0}$) along the surface of the ramp for different
  $M_{s}$ values.
The strength of a shock wave is given by the static pressure ratio across it. Figure 11 shows the Mach number contours and the surface pressure plot for shock wave locations in the convex (figure 11a–c) and concave (figure 11d–f) parts of the ramp at  $M_{s}=2.6$. The unsteady flow expands in the convex region, reducing the shock strength and hence the shock speed. In the concave region, compression waves are generated as the shock wave passes over it, where the former interact and strengthen the latter leading to an increased shock wave speed.

Figure 11. The Mach number contour and surface pressure plot for  $M_{s}=2.6$.
It is also found that the minimum velocity point is located between 0.058 and 0.062 m for all the cases considered, which is after the inflexion point on the ramp (figure 10). This is due to the finite time lag in shock wave's response to the sudden change in surface curvature (Skews & Blitterswijk Reference Skews and Blitterswijk2011). In the plane section following the ramp, the shock wave speed tends to remain constant, resembling a pseudo-steady reflection.
4.1.3. Irregular reflection
The behaviour of the IR in the straight portion of the ramp is also worth investigating. The TP trajectory of the IR is nonlinear in nature (figure 9) whereas the shock wave speed remains constant along its path (figure 10). A constant shock wave speed is a characteristic feature of the pseudo-steady shock wave reflection. The reflection phenomenon can hence be expressed as a series of quasi-steady solutions using von Neumann's 2-shock or 3-shock theories. Hence, using the Galilean coordinate transformation, the flow characteristics behind the shock wave are determined, keeping the reference point on the TP of the IR. Since the flow in front of the shock wave in the driven section is stagnant, the flow velocity in the transformed coordinate system will be equal to the shock wave velocity in the opposite direction. Hence, the incoming flow Mach number ( $M_{0}$) is constant in the entire planar section following the ramp. The nonlinear TP trajectory gives a varying flow deflection angle (
 $\theta _1$) at each time step which is obtained from the numerical results. The flow deflection angle (
 $\theta _1$) across the incident shock wave (i) is determined from the numerical results by averaging the streamline deflection angles in the vicinity of the TP, in the region between the incident (i) and reflected shock wave (r) (region ‘1’ in figure 12). Using the flow Mach number (
 $M_{0}$) and the flow deflection angle (
 $\theta _1$), shock polars are constructed to identify the nature of the IR and its variation along the trajectory. The flow deflection angle (
 $\theta _1$) reduces as the IR moves down the plane section, starting from the maximum deflection angle during its formation immediately downstream of the concave section of the ramp, forming a range of shock wave reflections. Figure 13 shows the variation of the flow deflection angle of the IR along the ramp for different
  $M_{s}$ values.

Figure 12. Schematic of an IR wave in a pseudo-steady flow.

Figure 13. Variation of flow deflection angle behind the incident shock wave with distance along the ramp for different values of  $M_{s}$.
Weak shock wave reflections are observed in the case of flow Mach numbers,  $M_{0}\leqslant 2.2$ (Molder Reference Molder1979). The simulations carried out in the present study range from Mach numbers in weak to strong shock wave reflection domains. The weak shock wave reflections include SMR, von Neumann reflection (vNR), Vasilev reflection (VR) and Guderley reflection (GR) (Vasilev, Elperin & Ben-Dor Reference Vasilev, Elperin and Ben-Dor2008). The plane region in the present study ranges from 0.1 to 0.3 m of the test section. The flow deflection angles exhibit a common trend with reducing angle as the IR grows with time for every
  $M_{s}$, which can lead to various types of shock wave reflections. In order to understand the transitions of the IR wave during its traverse of the planar region, the transition criteria in the weak shock wave reflection domain, such as
  $\textrm {SMR}\leftrightarrow \textrm {vNR}$ transition,
  $\textrm {vNR}\leftrightarrow \textrm {VR}$ transition and
  $\textrm {VR}\leftrightarrow \textrm {GR}$ transition angles, are marked for the respective shock wave Mach numbers in figure 13. The no-reflection condition refers to the situation where shock wave reflection is not possible as the flow deflection angle (
 $\theta _1$) is larger than the maximum flow deflection angle (
 $\theta _{max}$) corresponding to the respective
  $M_{0}$. Above
  $M_{0}=2.2$, strong shock wave reflections exist, with RR and SMR being the common reflections among them.
The shock polar solutions corresponding to the type of reflections with  $\theta$ variation are shown in figures 14 and 15. For
  $M_{s}=2.6$ and 3.0, shock polar solutions show SMR (figure 14). For
  $M_{s}=2$ and 2.2, the possibility of existence of all the four types of shock wave reflections in the weak shock wave reflection domain can be observed from the plot. The shock wave transition points are very close to each other in the case of
  $M_{s}=2.2$. Since the
  $\theta _{max}$ values for
  $M_{s}=1.6$ is
  $13.1^\circ$, which is below the flow deflection angles obtained for the IR in our case, no analytical solution exists or, in other words, the weak shock wave reflections cease to appear for
  $M_{s}=1.6$ and below.

Figure 14. Shock polar solutions for  $M_{s}=2.6$ and 3.0 giving SMR solutions.

Figure 15. Shock polar solutions corresponding to shock wave motion in the constant section of the ramp for  $M_{s}=2.0$, with
  $S_i$ and
  $S_r$ representing the sonic points of incident and reflected polars, respectively.
The shock polar solution for a series of flow deflection angles for  $M_{s}=2.0$ is depicted in figure 15(a). Figure 15(b) shows a GR for
  $\theta _1=22.9^\circ$ and, figure 15(c) shows a VR for
  $\theta _1=22.6^\circ$. The flow deflection,
  $\theta _1=22.3^\circ$ and
  $21.0^\circ$ gives a vNR solution (figure 15d) and a SMR solution (figure 15e), respectively. These solutions are obtained using the 3-shock theory and the four-wave theory (Vasilev et al. Reference Vasilev, Elperin and Ben-Dor2008).
A few instances of the growth of the IR wave in the planar region are represented in figures 16 and 17 for  $M_{s}=3.0$, 3.4 and 3.8. At
  $M_{s}=3.0$, the presence of a kink ‘k’ in the reflected shock wave is evident at
  $t=280\ \mathrm {\mu } \textrm {s}$ (figure 16c). Case
  $M_{s}=3.4$ has a kink formed early,
  $t=180\ \mathrm {\mu } \textrm {s}$ (figure 16d). Compression waves emanating from the kink are visible later,
  $t=260\ \mathrm {\mu } \textrm {s}$, revealing the presence of a TMR (Ben-Dor Reference Ben-Dor2007). In the case of
  $M_{s}=3.8$, the instances reveal a series of shock wave transformations from an IR to a double Mach reflection (DMR) as shown in figure 17. Figure 17( f) signifies a DMR, with the kink transforming into a second TP (
 $T'$), the compression waves strengthening into a reflected shock wave (
 $r'$) and the formation of a Mach stem (
 $m'$).

Figure 16. Development of IR wave in the planar section of the ramp for  $M_{s}=3.0$ (a–c), and
  $M_{s}=3.4$ (d–f).

Figure 17. Development of IR wave in the constant area section of the ramp for  $M_{s}=3.8$ (
 $i$-incident shock wave,
  $T$-first TP,
  $T'$-second TP,
  $m$-Mach stem of first MR,
  $m'$-Mach stem of second MR,
  $r'$-reflected shock wave of second MR,
  $s$-slipline).
Although pseudo-steady assumption is used to determine the shock reflection at each instant, the shock transition along the length of the planar section does not follow the same behaviour. In a flow, shock wave transitions from  $\textrm {RR}\rightarrow \textrm {DMR}\rightarrow \textrm {TMR}\rightarrow \textrm {SMR}$ with a reduction in flow deflection angle. The same is true with unsteady shock wave transition along a convex or concave geometry, with
  $\textrm {MR}\rightarrow \textrm {RR}$ or
  $\textrm {RR}\rightarrow \textrm {MR}$ transition happening with increasing or decreasing wedge angles, respectively (Takayama & Sasaki Reference Takayama and Sasaki1983). An opposite trend is seen in the present case for
  $M_{s}=3.4$ and 3.8, with SMR transitioning to DMR with reducing flow deflection angle. The history of the shock reflection on the convex and concave surface of the ramp can be an influencing factor for this behaviour. The IR tends to transform back to the planar shock wave with further forward motion in the planar section.
4.2. Flow behind the planar shock wave
The unsteady shock wave moving over the ramp has an unsteady flow induced behind it. The flow behaviour over the ramp is investigated for various shock wave Mach numbers,  $M_{s}$ using the numerical results. The numerical results show an accelerating flow over the convex surface, followed by a flow deceleration over the concave compression region (see figure 11).
The flow behind the shock wave over the entire surface remains subsonic for  $M_{s}=1.2$. As the shock wave Mach number is increased to 1.4, a small supersonic patch bounded by sonic line (curve in ‘white’ colour) appears on the convex section of the ramp (figure 18a) along with the development of weak compression waves behind it, possibly due to the requirement of a pressure matching as in the case of a divergent part of a convergent–divergent (C-D) nozzle during the start-up. The present work could hence be very important from the point of view of nozzle engineers and designers. Higher values of
  $M_{s}$ induce compression waves on the ramp surface which grow into a stationary shock wave with time (figure 18c).

Figure 18. Numerical schlieren images of shock wave at different locations from the origin of the ramp ( $x=0$) for various
  $M_{s}$ values.
For  $M_{s}=2.6$ and above, the flow accelerates to supersonic values in the domain with a subsonic patch formed downstream of the stationary shock wave, bounded by a sonic line (figure 18d). The nature of the stationary shock wave and the flow behind it are discussed in § 4.3 in more detail. Another interesting flow feature observed from the numerical results is the establishment of a connection between the reflected shock wave of the IR structure and the stationary shock wave developing on the ramp surface (figure 18c,d). This connection between the shock waves appears to be more prominent as
  $M_{s}$ increases. With reference to § 4.1.2, it is evident that the shock wave and the flow induced behind it behave differently on the ramp surface. In the expanding convex section, flow velocity peaks until the inflexion point and drops in the compressive concave section. The planar shock wave, on the other hand, follows an opposite trend.
In the cases of  $M_{s}\leqslant 2.2$, which correspond to weak shock wave reflections, the reflection is characterized mainly by a curved reflected shock wave originating from the TP as observed in figures 18(a) and 18(b), owing to the subsonic nature of the induced flow behind the reflected shock wave with respect to the TP.
4.3. Nature of the stationary shock wave
As the planar shock wave moves down the ramp, a compression wave starts forming on the ramp surface and develops into a strong stationary shock wave over time. The formation of the stationary shock wave near the inflexion point is an important flow feature in the present investigation. The adverse pressure gradient due to the curvature change from an expanding convex surface to a compressing concave surface leads to the formation of such a shock wave. This may be analogous to the stationary shock wave formation in the divergent section of a C-D nozzle during start-up. Numerical schlieren images of a few cases, where the stationary shock wave is prominent, are shown in figure 19. For  $M_{s}$ values above 1.4, a stationary shock wave is formed on the ramp surface.

Figure 19. Numerical schlieren images of the stationary shock wave for different  $M_{s}$ values.
For  $M_{s}$ values of 1.8 and 2.0, the location of the stationary shock wave is near the inflexion point of the ramp (figure 19a,b) whereas, in the case of
  $M_{s}=2.6$, the shock wave location shifts to the concave portion of the ramp (figure 19c). In the subsequent cases, it is observed that the stationary shock wave lies in the concave region of the ramp (figure 19d–f). It is seen in figure 8(c) that the planar moving shock wave develops a kink ‘k’ at its foot to maintain surface normalcy with the concave section of the ramp. Similarly, the foot of the stationary shock wave also remains normal to the surface through a kink, as shown in figure 19(d). The kink formation is more prominent as the shock wave Mach numbers increase above 3.0. The kink slowly transforms into an IR structure, with a prominent shear layer, shedding vortices behind the stationary shock wave for
  $M_{s}\geqslant 3.0$ (figure 19d–f). A zoomed-in view of the stationary shock on the ramp surface for
  $M_{s}=3.8$ showing IR structure of the stationary shock wave, a three-shock configuration and a slip stream is represented in figure 20. The incident shock wave (i), reflected shock wave (r), Mach stem (m) and slip stream (s) are intersecting at the TP (T). The slip line originating from the TP rolls up to form a significant K–H vortex sheet in the downstream region (figure 20b).

Figure 20. (a) Zoomed-in view of stationary shock wave for  $M_{s}=3.8$. Numerical schlieren (b) density contours with incident shock wave (i), reflected shock wave (r), Mach stem (m), slip line (s) and TP (T).
The flow downstream of the stationary shock wave is further analysed by overlaying the streamlines over the Mach number contours, for a few shock Mach numbers. A single recirculation bubble of large diameter behind the stationary shock wave is visible from the streamline distribution for  $M_{s}=1.8$, with a jump in the flow Mach number (figure 21a). For
  $M_{s}=2.0$ (figure 21b), the flow separation region and the recirculation bubbles are spread more downstream with perturbed streamlines due to the presence of multiple recirculation bubbles. The recirculation tends to disappear, and flow separation reduces as
  $M_{s}$ increases to 2.6 and above owing to the increased flow momentum. Figures 21(c) and 21(d) show a mild separated flow behind the shock wave. The high frequency fluctuations in Mach number behind the shock wave are the result of the rolling up of K–H instability associated with the slip line (shear layer) originating from the TP of the IR in these cases.

Figure 21. Streamlines plotted over Mach number contour for various shock wave Mach numbers.
5. Conclusions
Experimental and numerical studies were carried out to investigate the reflections and transitions of a planar shock wave when it moves over a ramp of coupled convex–concave surfaces with equal radii of 70 mm followed by a plane section. Experimental studies conducted in a shock tube was further extended by extensive numerical simulations using an inviscid fifth-order in-house WENO code.
The curved shock wave transitions to an IR in the planar section of the ramp. The trajectory of the TP of the IR was traced from the experimental results. It is found that the Mach stem grows nonlinearly as the shock wave travels in the planar section of the ramp. A quasi-steady approach was hence adopted to analyse the shock wave transitions using the shock polar, as the shock wave speed is constant in the planar region. The flow deflection angle reduces as the IR moves along the planar section of the ramp, revealing the existence of shock wave reflections ranging from the weak shock wave reflections (vNR, VR and GR) to SMR, TMR and DMR in the strong shock wave reflection domain with increasing  $M_{s}$ value. In the weak shock reflection domain, with the reduction in flow deflection angle, IR transition happens from
  $\textrm {GR}\rightarrow \textrm {VR}\rightarrow \textrm {vNR}\rightarrow \textrm {SMR}$, following the pseudo-steady transition criteria. While in the case of strong shock reflections (
 $M_{s}\geqslant 2.2$), transition is from
  $\textrm {SMR}\rightarrow \textrm {TMR}\rightarrow \textrm {DMR}$ with reducing flow deflection angle, which is contrary to the pseudo-steady shock wave transition criteria.
Due to the development of a supersonic flow behind the moving shock wave a stationary shock wave found to be forming on the ramp surface. For lower shock wave Mach numbers, the stationary shock wave remained in the convex surface of the ramp and slowly started moving down to the concave part with an increase in  $M_{s}$. This shift has changed the nature of the stationary shock wave from an initial curved shock wave to an IR structure with a three-shock confluence and a distinct slip line, which forms K–H instability leading to vortex shedding in an inviscid flow. In a real flow, the development of boundary layer can influence the late time behaviour of the flow over the ramp surface.
The history of the shock wave travelling on the curved surface substantially influences the shock wave reflections and transitions in the straight portion of the ramp for different shock wave Mach numbers. It is also interesting to note that the types of reflections that the moving shock wave undergoes are mostly in the weak shock wave reflection domain, as evident from the shock polar analysis, and the choice of weak reflection the moving shock takes depend mainly on the incoming shock Mach number. A single value for the radius of curvature was considered in the present study. The study can be further extended to geometries of varying surface curvatures and surface lengths to understand the unsteady reflection of the moving shock wave.
Supplementary movies
Supplementary movies are available at https://doi.org/10.1017/jfm.2021.631.
Declaration of interests
The authors report no conflict of interest.
Appendix. Grid independence study
A grid independence study was carried out for the shock-tube flow for a shock wave Mach number  $M_{s}=1.44$. The analysis was conducted for the entire shock wave motion through the shock tube. The flow properties were computed for three different grid systems when the shock wave is located at
  $x=0.05\ \textrm {m}$. A numerical schlieren of the flow field is shown in figure 22(a), when the shock wave is at x = 0.05 m, which is the point of inflexion of the ramp surface. The flow Mach number and pressure are plotted along the ramp at this instant for the three different grid systems with the number of cells in
  $x$ and
  $y$ directions as follows:
  $1800\times 225$,
  $2155 \times 450$ and
  $2275 \times 675$ which are termed the coarse, medium and fine grid, respectively. Figures 22(b) and 22(c) show the surface pressure and Mach number variations over the ramp. The
  $2155 \times 450$ grid system was used for the numerical analysis.

Figure 22. Numerical schlieren image of a planar shock wave located at  $x=0.05\ \textrm {m}$ on the ramp surface.


 Open access