


Introduction
In today's globally connected world, the rate at which species are being transported outside their native ranges is increasing, and the impacts of these invasions are extensive (Lockwood et al. Reference Lockwood, Hoopes and Marchetti2013). The rise in the prevalence of biotic invasions today is due primarily to anthropogenic transport of taxa. However, “natural” invasions are also likely to increase as anthropogenic activity continues to alter global climate (Bellard et al. Reference Bellard, Thuiller, Leroy, Genovesi, Bakkenes and Courchamp2013). Regardless of whether propagule transport is via abiotic or anthropogenic processes, the potential impacts of novel taxa on the recipient biota are concerning. Potential invader impacts include changes to ecosystem structure and biodiversity loss, both of which may disrupt ecosystem services humanity considers valuable. These concerns have fueled efforts to understand the processes and impacts of biotic invasions, which have done much to further our understanding of these events, especially over short timescales. However, questions remain regarding the long-term impacts of biotic invasions that cannot be addressed through study of modern systems alone. Data from the fossil record allow the study of biotic invasions at larger temporal scales, bridging the gap in knowledge between short-term studies of modern invasions and long-term patterns in Earth's past (Vermeij Reference Vermeij1991; Stigall Reference Stigall2019). Having this long-term perspective to accompany short-term observations is essential for developing a holistic understanding of biotic invasions and allows development of better-informed conservation policies and practices than can be made using short-term data alone. Here we show that ancient invasions caused long-term changes in paleocommunity structure, diversity, and trophic composition in shallow-marine systems.
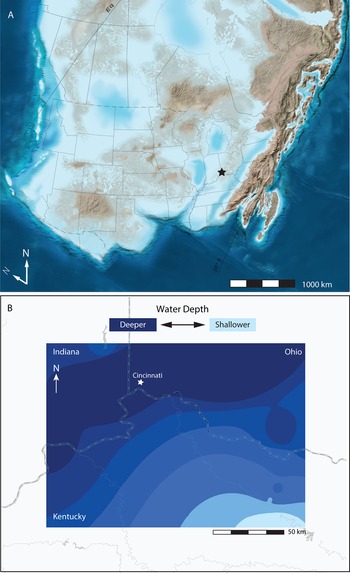
This study focuses on a regional biotic interchange that is recorded in Late Ordovician strata (~450 Ma) in what is now the Cincinnati, Ohio, region in eastern North America. During the Late Ordovician (Katian Stage), a broad area including what is now southwestern Ohio, northern Kentucky, and southeastern Indiana was covered by a shallow epicontinental sea and located at approximately 20°S latitude (Torsvik and Cocks Reference Torsvik and Cocks2013; Fig. 1A). This region was characterized by both abundant fauna and rapid sedimentation, which produced a rich record of biotic change within a well-characterized stratigraphic framework (Brett et al. Reference Brett, Aucoin, Dattilo, Freeman, Hartshorn, McLaughlin and Schwalbach2020). Cincinnatian strata record a regional biotic interchange known as the Richmondian Invasion which occurred through a series of pulses and introduced more than 60 novel genera into the Cincinnati Sea (Holland Reference Holland, Brett and Baird1997; Stigall Reference Stigall2010; Lam and Stigall Reference Lam and Stigall2015). Numerous studies of this biotic interchange, most of which examined the entire invasion interval, have been conducted, and general ecological and evolutionary patterns have been identified (e.g., Holland and Patzkowsky Reference Holland and Patzkowsky2007; Patzkowsky and Holland Reference Patzkowsky and Holland2007; Malizia and Stigall Reference Malizia and Stigall2011; Tyler and Leighton Reference Tyler and Leighton2011; Brame and Stigall Reference Brame and Stigall2014; Kempf et al. Reference Kempf, Castro, Dineen, Tyler and Roopnarine2020). However, the individual pulses of the invasion have received less study (but see Schwalbach Reference Schwalbach2017). Fortunately, a new stratigraphic revision by Brett et al. (Reference Brett, Aucoin, Dattilo, Freeman, Hartshorn, McLaughlin and Schwalbach2020) (Fig. 2) provides a more detailed framework that facilitates detailed investigation of individual invasion pulses for the first time. Importantly, the stratigraphic framework of Brett et al. (Reference Brett, Aucoin, Dattilo, Freeman, Hartshorn, McLaughlin and Schwalbach2020) provides the necessary scaffolding for dissection of the patterns involved at high temporal resolution for the first time.

Figure 1. Late Ordovician (450 Ma, Katian) paleogeographic reconstructions. A, Regional paleogeographic reconstruction of Laurentia (North America) with modern geopolitical boundaries indicated. Star denotes Cincinnati. “N” indicates modern north, and “N” is paleo-north. Modified from Blakey (Reference Blakey2013). B, Bathymetric map of the Cincinnati Basin showing northward dip of ramp. Bathymetric map was produced via inverse distance weighting (see “Methods”). Darker blues correspond to deeper waters (lower detrended correspondence analysis [DCA] scores), and lighter blues correspond to shallower waters (higher DCA scores). Results reflect a classical understanding of Cincinnati Basin bathymetry as it has been interpreted based on lithology (deepening from south to north), further supporting the strength of the relationship between DCA axis 1 scores and water depth.

Figure 2. Sequence stratigraphic interpretation for the stratigraphic units examined. FSST, falling-stage systems tract; HST, highstand systems tract; TST, transgressive systems tract. Modified from Brett et al. (Reference Brett, Aucoin, Dattilo, Freeman, Hartshorn, McLaughlin and Schwalbach2020).
This study investigates details of the Clarksville Phase, the main pulse of the Richmondian Invasion (Aucoin and Brett Reference Aucoin and Brett2016; Stigall Reference Stigall2019). Specifically, we examine how its progression was modulated by environmental fluctuations and how the invaders impacted the recipient ecosystem. Specifically, we tested the following hypotheses: (1) invader taxa occupied all depth zones, (2) invaders increased richness, (3) invader arrival changed evenness and paleocommunity composition, (4) invader presence was accommodated by habitat shifts among taxa in the ecosystem, and (5) successful invader taxa primarily occupied habitats underutilized by native taxa. The set of detailed analyses conducted provides the context to develop a holistic understanding of the Clarksville Phase, the resulting impacts on the fauna of the Cincinnati Sea, and lessons for modern invaded marine communities.
Methods
Data Collection
To quantify how paleocommunity structure changed across the Clarksville Phase of the Richmondian Invasion, paleocommunity parameters were reconstructed from genus-level count data of fossil taxa collected from bedding planes using quadrat sampling. Sampling was conducted at multiple stratigraphic horizons during and after the Clarksville Phase of the Richmondian Invasion, across a range of depositional environments within the Cincinnati Basin. In this study, a paleocommunity or community is defined as a generalized group of taxa that characterize a particular environment and may represent a segment of a biotic gradient and is synonymous with the “biofacies” of Brett et al. (Reference Brett, Hendy, Bartholomew, Bonelli and McLaughin2007). Paleocommunities represent the preserved biota, and not the complete set of organisms (the ecological community) present during deposition.
The primary data collected for this study are counts of macrofaunal invertebrate fossils exposed on bedding plane surfaces. Fossil count data were collected from four submembers of the Waynesville Formation using the stratigraphic framework of Brett et al. (Reference Brett, Aucoin, Dattilo, Freeman, Hartshorn, McLaughlin and Schwalbach2020) (Fig. 2). The early invasion data were collected from the Bon Well Hill Submember (transgressive systems tract of the C5B sequence), lag phase data were collected from the Harpers Run Submember (highstand to falling-stage systems tract of the C5B sequence), main invasion data were collected from the Stony Hollow Creek Submember (transgressive systems tract of the C5C sequence), and postinvasion data were collected from the Middle Clarksville Submember (highstand to falling-stage systems tract of the C5C sequence). Based on the average timing of fourth-order sequences and glacial cycles, the interval considered in this study represents no more than 200,000 to 400,000 years (Brett et al. Reference Brett, Aucoin, Dattilo, Freeman, Hartshorn, McLaughlin and Schwalbach2020). Because the invasion is recorded primarily in the lower beds of the transgressive systems tract of C5C sequence, the main invasion pulse at the base of the Stony Hollow Creek Submember likely records fewer than a few thousand years (Brett et al. Reference Brett, Aucoin, Dattilo, Freeman, Hartshorn, McLaughlin and Schwalbach2020).
Geographic coverage was established by collecting data from 11 localities (Supplementary Tables 1, 2) along a 187 km northwest to southeast trending transect. Localities were selected to maximize exposure of the study interval and include the maximum coverage of depositional settings. Sites representing shoal, shallow subtidal, deep subtidal, and offshore environments were selected so that the impact of the invaders in different depositional settings could be quantified. In total, 92 individual beds were sampled with a cumulative sample area of 56.6 m2. The sampled area for each bed was strongly controlled by exposure and accessibility of the layer and ranged from 100 cm2 to 6300 cm2.
Faunal count data were collected from bedding planes using a 100 cm2 quadrant. Data collection focused on obtaining census data from limestone layers rather than mudstone units, because limestone units represent a time-averaged faunal assemblage and have been shown to record a more complete census of alpha diversity in comparable Ordovician strata (Finnegan and Droser Reference Finnegan and Droser2008). During sampling, bryozoans were identified by colony morphology (massive, encrusting, thin ramose, thick ramose, thin bifoliate), and all other taxa were identified to the genus level. The following elements were counted as individuals: single valves or steinkerns of mollusks (e.g., gastropods, bivalves) more than 50% complete; pygidia, cranidia, and hypostomes of trilobites; single valves of brachiopods more than 50% complete; solitary rugose corals; and each centimeter of coralline algae. Bryozoans were classified based on zoarium morphology using the classification scheme of Holland et al. (Reference Holland, Miller, Meyer and Datillo2001), and every 1 cm of length for thick ramose (>5 mm), thin ramose (<5 mm), encrusting, massive, and thin bifoliate (<5 mm) bryozoan was counted as one individual (Patzkowsky and Holland Reference Patzkowsky and Holland1999). Relative abundance of crinoid columnals was tallied, with 1–5 columnals counted as one individual, 6–10 columnals counted as two individuals, etc. The skeletal element to individual ratios employed for each taxon were optimized to produce the strongest data signal and to prevent a single clade, such as bryozoa, from dominating and obscuring the signals from the other taxa. The same correction factors apply to all parts of the study interval equally, making data for each time slice directly comparable (Finnegan and Droser Reference Finnegan and Droser2008).
Data Processing
Sampling resulted in a raw dataset of 14,574 tabulated individuals belonging to 37 taxa. Minimum number of individuals (Gilinsky and Bennington Reference Gilinsky and Bennington1994) was then calculated for brachiopods, bivalves, and trilobites to ensure that the abundances of these taxa were not overestimated. The counts for thick ramose, thin ramose, and thin bifoliate bryozoans were then divided by 10 to capture differences in zoarium size between these forms and encrusting and massive morphologies and prevent them from dominating and obscuring the signals from the other taxa. Once this was complete, all samples collected from the same site and layer were pooled to increase signal strength. This resulted in a final dataset of 5231 tabulated individuals belonging to 37 taxa (Supplementary Table 3).
Before analyses were conducted, the data were separated into four discrete taxon × sample matrices corresponding to the four sampled submembers. Before multivariate analyses, all samples containing only one taxon and all taxa occurring in only one sample were removed from each of the four datasets to prevent distortion, following Holland and Patzkowsky (Reference Holland and Patzkowsky2007). The full dataset was used without culling for calculating measures of biodiversity. Data were subjected to percent and maximum value transformations, which were conducted in the vegan R package using the decostand function (Oksanen et al. Reference Oksanen, Simpson, Blanchet, Kindt, Legendre, Minchin, O'Hara, Solymos, Stevens, Szoecs, Wagner, Barbour, Bedward, Bolker, Borcard, Carvalho, Chirico, De Caceres, Durand, Evangelista, FitzJohn, Friendly, Furneaux, Hannigan, Hill, Lahti, McGlinn, Ouellette, Cunha, Smith, Stier, Ter Braak and Weedon2020). Percent transformation, in which each value in a row is transformed to a percentage of the row total, was conducted to prevent multivariate analyses from being dominated by variations in sample size (McCune et al. Reference McCune, Grace and Urban2002). Maximum transformation, which converts each value in a column to a percentage of the maximum value in that column, was conducted to give all the taxa the same weight in analyses (McCune et al. Reference McCune, Grace and Urban2002).
Analyses
A set of analyses was conducted to address our hypotheses of how invaders impacted the recipient biota. Analyses included rarefaction to quantify changes in richness, Simpson's index of Diversity to test for changes in evenness (Twitchett et al. Reference Twitchett, Krystyn, Baud, Wheeley and Richoz2004; Wheeley and Twitchett Reference Wheeley and Twitchett2005; Chen et al. Reference Chen, Tong, Kaiho and Kawahata2007), cluster analysis to investigate changes in paleocommunity composition, modified indirect gradient analysis to investigate the distribution of taxa along the onshore–offshore gradient, comparison of environmental preferences and tolerances through time to test for shifts in habitat occupation, and guild analysis to investigate changes in ecospace utilization.
Diversity Analysis
Rarefied richness was calculated for each of the four submembers at a subsample size of 700 individuals to test for changes in richness within the study interval while accounting for differences in sample size. Rarefied richness was calculated using the rarefy function in the vegan R package, and rarefaction curves were plotted using the rarecurve function from the same package (Oksanen et al. Reference Oksanen, Simpson, Blanchet, Kindt, Legendre, Minchin, O'Hara, Solymos, Stevens, Szoecs, Wagner, Barbour, Bedward, Bolker, Borcard, Carvalho, Chirico, De Caceres, Durand, Evangelista, FitzJohn, Friendly, Furneaux, Hannigan, Hill, Lahti, McGlinn, Ouellette, Cunha, Smith, Stier, Ter Braak and Weedon2020). Simpson's Index of Diversity was calculated for each of the four submembers to test for changes in evenness and dominance through the study interval. Simpson's Index of Diversity was calculated as the mean of 10,000 bootstrap replicates using the diversity_boot function in the poppr R package (Kamvar et al. Reference Kamvar, Tabima and Grünwald2014).
Cluster Analyses
Q-mode and R-mode cluster analyses were conducted to reconstruct paleocommunity composition. The dissimilarity matrix for cluster analysis was calculated via the Bray-Curtis dissimilarity index using the vegdist function in the vegan R package (Oksanen et al. Reference Oksanen, Simpson, Blanchet, Kindt, Legendre, Minchin, O'Hara, Solymos, Stevens, Szoecs, Wagner, Barbour, Bedward, Bolker, Borcard, Carvalho, Chirico, De Caceres, Durand, Evangelista, FitzJohn, Friendly, Furneaux, Hannigan, Hill, Lahti, McGlinn, Ouellette, Cunha, Smith, Stier, Ter Braak and Weedon2020). Cluster analysis was then conducted via Ward's agglomeration method using the agnes function in the cluster R package (Maechler et al. Reference Maechler, Rousseeuw, Struyf, Hubert and Hornik2022). Two-way cluster analysis was then conducted so that the abundance of taxa within each paleocommunity could be visualized. The two dendrograms that would be used were calculated using the hclust function in the vegan R package (Oksanen et al. Reference Oksanen, Simpson, Blanchet, Kindt, Legendre, Minchin, O'Hara, Solymos, Stevens, Szoecs, Wagner, Barbour, Bedward, Bolker, Borcard, Carvalho, Chirico, De Caceres, Durand, Evangelista, FitzJohn, Friendly, Furneaux, Hannigan, Hill, Lahti, McGlinn, Ouellette, Cunha, Smith, Stier, Ter Braak and Weedon2020), and a heat map was produced using the heatmap function in the stats R package (R Core Team 2013).
Modified Indirect Gradient Analysis
Detrended correspondence analysis (DCA) was conducted to uncover the structure of the primary gradient, which is commonly water depth for ecological datasets collected from a marine environment (Holland et al. Reference Holland, Miller, Meyer and Datillo2001). DCA was conducted in the R programming environment using the decorana function in the vegan R package with down-weighting of rare taxa turned on (Oksanen et al. Reference Oksanen, Simpson, Blanchet, Kindt, Legendre, Minchin, O'Hara, Solymos, Stevens, Szoecs, Wagner, Barbour, Bedward, Bolker, Borcard, Carvalho, Chirico, De Caceres, Durand, Evangelista, FitzJohn, Friendly, Furneaux, Hannigan, Hill, Lahti, McGlinn, Ouellette, Cunha, Smith, Stier, Ter Braak and Weedon2020). Nonmetric multidimensional scaling (NMDS) was also conducted for comparison. NMDS was conducted in the R programming environment using the metaMDS function in the vegan R package (Oksanen et al. Reference Oksanen, Simpson, Blanchet, Kindt, Legendre, Minchin, O'Hara, Solymos, Stevens, Szoecs, Wagner, Barbour, Bedward, Bolker, Borcard, Carvalho, Chirico, De Caceres, Durand, Evangelista, FitzJohn, Friendly, Furneaux, Hannigan, Hill, Lahti, McGlinn, Ouellette, Cunha, Smith, Stier, Ter Braak and Weedon2020). The number of dimensions was set to 2, and the maximum number of random starts was set to 50. The Bray-Curtis dissimilarity index was used because it is an appropriate distance measure for analysis of multivariate ecological datasets (Beals Reference Beals1984). Results for both ordination analyses are consistent, indicating strong signal within the data, and DCA results are reported herein. To test the hypothesis that axis 1 of the DCA plots represents water depth, resulting DCA axis 1 scores were extracted to create a quantitative depth map of the study area that could then be compared to basin bathymetry as it has been previously interpreted based on lithology, ichnology, and faunal assemblages. To achieve this, all the data collected from each site were pooled, and a single DCA axis 1 score for each site was calculated. Coordinates of sites and their associated DCA axis 1 scores were imported into ArcGIS Pro, and a continuous raster layer of DCA scores was produced using the inverse distance weighting method of interpolation.
Niche Stability Analyses
An analysis of a taxon's habitat preferences and tolerances throughout the study interval was conducted using the weighted averaging technique of Holland and Zaffos (Reference Holland and Zaffos2011) and the R script published therein. A detailed discussion of this method can be found in Holland and Zaffos (Reference Holland and Zaffos2011); only a brief overview is provided here. When DCA is conducted, axis 1 corresponds to the primary source of variation in the dataset (Holland et al. Reference Holland, Miller, Meyer and Datillo2001). When axis 1 is confirmed to correspond to water depth, the axis 1 scores of sites and taxa can be used to estimate aspects of habitat occupation such as the preferred environment, environmental tolerance, and peak abundance of a taxon. The environmental tolerance of a taxon is calculated as the standard deviation of the DCA axis 1 scores for all samples in which the taxon occurs. The preferred environment of this taxon is the DCA axis 1 score of that taxon. These two parameters were calculated for each taxon in each of the fourth-order systems tracts in the study interval (submembers). Through-time comparison of taxon scores was conducted via Pearson's product moment correlation to assess temporal stability of habitat preferences. The calculations were conducted only for taxa with a peak abundance (probability of collecting that taxon in its preferred environment) of greater that 40% to ensure that the parameters were estimated as accurately as is possible with the current dataset.
Guild Analysis
Guild analysis was conducted to examine patterns of ecospace utilization through space and time. Guild membership was assigned using tier, food source, mobility, and habitat utilization based on a literature review (Supplementary Table 4). A modified version of the tiering scheme of Watkins (Reference Watkins1991) was used in which low tier corresponds to 0–6 cm above the substrate, mid-tier corresponds to 6–10 cm above the substrate, and high tier corresponds to >10 cm above the substrate. The counts of taxa assigned to each guild were tabulated for each paleocommunity recovered from cluster analysis in each of the four study intervals.
Results
Invader Spread
Invading taxa reached different parts of the basin at different times and impacted some areas of the basin more than others. The invasive solitary rugosan Grewingia initially arrived in deep subtidal settings during the Bon Well Hill Submember (early invasion). The arrival of this single invader can be classified as an isolated invasion (sensu Stigall Reference Stigall2019) and indicates that connection to the donor basin was limited. After colonizing deep subtidal environments, invaders remained localized and did not disperse to additional parts of the basin during the Harpers Run Submember (lag phase). A much larger suite of invaders (e.g., Eochonetes, Hiscobeccus, Strophomena, Leptaena) entered the basin during the Stony Hollow Creek Submember (late invasion). This set of invaders reflects a coordinated invasion (sensu Stigall Reference Stigall2019), indicating a stronger connection to the donor region(s). During this interval, the new arrivals and the early invader Grewingkia expanded their geographic ranges to colonize both deep subtidal and offshore settings. Invaders remain prevalent in these environments during the Middle Clarksville Submember interval (postinvasion) but did not become abundant in shallow-subtidal or shoal settings during the study interval. This contradicts the initial hypothesis that invaders occupied all depth zones.
Diversity Impacts
Results of rarefaction analyses confirmed the hypothesis that species increased taxonomic richness within the basin during the main invasion (Fig. 3A). Rarefied richness at a subsample size of 700 individuals is 22–32% higher in the postinvasion interval than in the early invasion interval. For the Bon Well Hill Submember (early invasion), richness was estimated to be 20.6 genera with a standard error of 0.5, indicating 20.1–21.1 genera present. Richness of the Harpers Run Submember (lag phase) was estimated to be 24.5 genera with a standard error of 1.0, indicating 23.4–25.4 genera present. For the Stony Hollow Creek Submember (late invasion), richness was estimated to be 28.4 genera with a standard error of 1.2, indicating 27.2–29.6 genera present. Richness of the Middle Clarksville Submember (post-invasion) was estimated to be 28.6 genera with a standard error of 1.2, indicating 27.4–29.8 genera present.

Figure 3. Diversity impacts through time. Rarefaction curves for taxonomic richness per submember on the left indicate a statistical increase in taxonomic diversity between the preinvasion/early invasion to the main invasion/postinvasion intervals. Dashed lines indicate diversity values at a comparable subsample size of 700 individuals. To the right, Simpson's Index of Diversity scores demonstrate declining evenness during the invasion pulses, with a postinvasion evenness lower than preinvasion values.
The distribution of diversity within the basin was assessed using Simpson's Index of Diversity, where a value of 1 indicates that all taxa contribute equally to the community, and 0 indicates dominance by a single taxon. Results indicate that evenness within the basin was relatively high throughout the study interval (range from 0.81 to 0.89) and decreased between the early invasion and lag phase followed by increases in both the late invasion and post-invasion intervals (Fig. 3B). Combined, these results indicate that diversity increased from the early invasion to postinvasion intervals, with higher richness in the postinvasion interval and a diversity distribution similar to that observed in the early invasion.
Changing Paleocommunity Structure
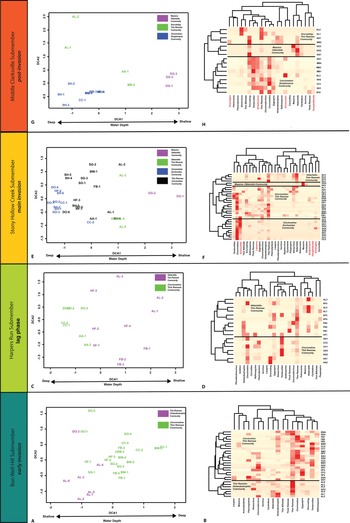
Results of cluster analyses indicate the presence of overlapping communities (also termed biofacies or paleocommunities) during each of the four time slices (Fig. 4). These communities are defined as generalized groups of taxa that characterize a depositional environment and may make up a segment of an environmental gradient (Brett et al. Reference Brett, Hendy, Bartholomew, Bonelli and McLaughin2007). The composition of these communities reflects the environments in which they are found. Communities dominated by large robust taxa (e.g., Hebertella, massive bryozoa, Vinlandostrophia) are characteristic of shallow-water environments with wave influence, whereas communities dominated by small delicate taxa (e.g., Cincinnetina, Eochonetes, Tentaculites) are characteristic of deeper-water environments with reduced wave influence.

Figure 4. A, C, E, G, Cluster analysis and detrended correspondence analysis (DCA) results. DCA axes labeled with interpreted primary environmental factors. In the cluster analysis heat maps (B, D, F, H), the darker reds indicate higher abundance of a taxon, and lighter reds indicate lower abundance. Invasive genera indicated in red.
As hypothesized, invaders impacted community composition, but their impacts were not evenly distributed within the basin. The invaders primarily altered paleocommunity composition in deeper-water communities (deep subtidal and offshore), whereas shallow-water communities (shallow subtidal and shoal) were largely unaffected. Invaders became a limited component of communities in the deep subtidal zone after the isolated invasion during the early invasion interval (Bon Well Hill). They then became dominant components of communities in offshore and deep subtidal settings following the coordinated invasion during the late invasion interval (Stony Hollow Creek) and continued to be dominant components of communities in deeper waters during the postinvasion interval (Middle Clarksville).
Results of modified indirect gradient analysis indicate that the primary control on taxon distribution in all four intervals is water depth. Shallow-water and deep-water communities separate along axis 1 in two-dimensional ordination space (Fig. 4), and when DCA axis 1 scores of sampling sites are superimposed onto the study area, they reflect a classical understanding of basin bathymetry as it has been interpreted based on lithology, ichnology, and fossil assemblages (deepening from southeast to northwest) (Smrecak and Brett Reference Smrecak and Brett2014 and references therein; Fig. 1B).
Shifts in Habitat Occupation and Conservation
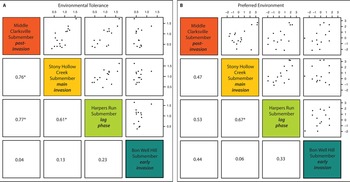
Results of Gaussian response modeling indicate that taxa shifted their occupied habitat during the early phase of the invasion as hypothesized and then stabilized their niche preferences (Fig. 5). In general, conservation of environmental tolerance, or habitat occupation, increased from early invasion to postinvasion. Although statistical significance is calculated in this method, the magnitude of the correlation is emphasized in interpretation (Holland and Zaffos Reference Holland and Zaffos2011). Pearson's product moment correlation between the environmental tolerances of abundant taxa in the Bon Well Hill and Harpers Run Submembers resulted in a correlation coefficient of 0.23, indicating little evidence for conservatism of ecological tolerance at the genus level between these intervals. The correlation between Harpers Run and Stony Hollow Creek produced a correlation coefficient of 0.61, indicating that there is more evidence for conservatism of environmental tolerance than was observed between the previous intervals. The correlation between Stony Hollow Creek and Middle Clarksville resulted in a correlation coefficient of 0.76, indicating there is stronger evidence for conservatism of environmental tolerances between these intervals than was observed between the previous intervals.

Figure 5. Gaussian response models of habitat occupation through time. Comparison of the environmental tolerance (A) and preferred environment (B) of abundant taxa between submembers via Pearson's product moment correlation. Correlations that are significant at an alpha level of 0.05 are marked with an asterisk. Boxes in the upper right include visualizations of the correlation of environmental tolerance between submembers; e.g., the x-axis is the environmental tolerance/preference during Bon Well Hill time, and the y-axis is environmental tolerance/preference during Harpers Run time. Boxes in the lower left display the magnitude of the correlation between environmental tolerances/preferences of submembers. Note the general increase in the magnitude of the correlations through time, which indicates increasing conservation of environmental tolerances and preferences through time.
Taxa also increased their adherence to their previously preferred environment from early invasion to postinvasion. Pearson's product moment correlation between preferred environments of abundant taxa between the Bon Well Hill and Harpers Run Submembers resulted in a correlation coefficient of 0.33, indicating little evidence for conservation of environmental preference between the early invasion interval and lag phase. The comparison between the Harpers Run and Stony Hollow Creek Submembers resulted in a correlation coefficient of 0.67, indicating increased evidence for conservation as the invasion progressed. The comparison between the Stony Hollow Creek and Middle Clarksville Submembers resulted in a correlation coefficient of 0.47, indicating continued shift of this parameter from the previous interval.
Changes in Paleocommunity Composition
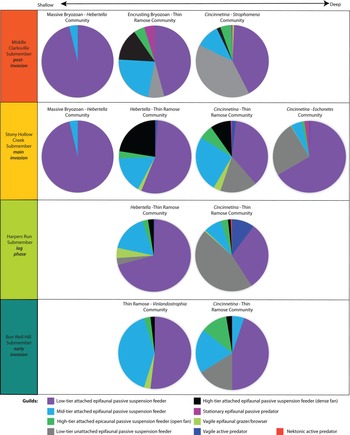
Guild analysis results indicate that ecospace utilization within communities changed across the invasion (Fig. 6). The Clarksville invaders fall into three guilds based on patterns of ecospace utilization. These are identified as the low-tier unattached epifaunal passive suspension-feeder guild, the low-tier attached epifaunal passive suspension-feeder guild, and the stationary epifaunal passive predator guild. Invaders from the low-tier unattached epifaunal passive suspension-feeder and stationary epifaunal passive predator guilds were more successful than those from the low-tier attached epifaunal passive suspension-feeder guild, and the prevalence of stationary epifaunal passive predation within communities was elevated by the invasion. Notably, successful invaders mostly occupied guilds that were underutilized by the native taxa, as predicted.

Figure 6. Guild distribution among paleocommunities. Relative depth at which paleocommunities occur increases from left to right. Guild structure becomes more complex postinvasion with the introduction of a new predatory guild and increased differentiation among guilds within similar water-depth paleocommunities. Guild descriptions and taxonomic membership are provided in Supplementary Table 4.
Discussion
Invader Establishment and Spread
The establishment and spread phases of the invasion process during the Clarksville Phase of the Richmondian Invasion resemble processes observed in many modern invasions. Specifically, propagule pressure played an important role in regulating biotic invasions throughout the history of life, and lag phases following invasions can be quite extensive. The temporal lag between the initial proliferation of Clarksville invaders in the deep subtidal zone and their subsequent spread to offshore settings is best explained by temporal variation in propagule pressure in response to fluctuations in sea level (Fig. 7). Sea-level variations are in turn best explained by the waxing and waning of polar ice sheets in response to fluctuations in boundary conditions, including orbital forcing. This interpretation is strengthened by recent work indicating that ice sheets were in place during the Late Ordovician (Elrick et al. Reference Elrick, Reardon, Labor, Martin, Desrochers and Pope2013; Ghienne et al. Reference Ghienne, Desrochers, Vandenbroucke, Achab, Asselin, Dabard, Farley, Loi, Paris, Wickson and Veizer2014; Rasmussen et al. Reference Rasmussen, Ullmann, Jakobsen, Lindskog, Hansen, Hansen, Eriksson, Dronov, Frei, Korte, Nielsen and Harper2016) and perhaps as early as the Darriwilian (Rasmussen et al. Reference Rasmussen, Ullmann, Jakobsen, Lindskog, Hansen, Hansen, Eriksson, Dronov, Frei, Korte, Nielsen and Harper2016).

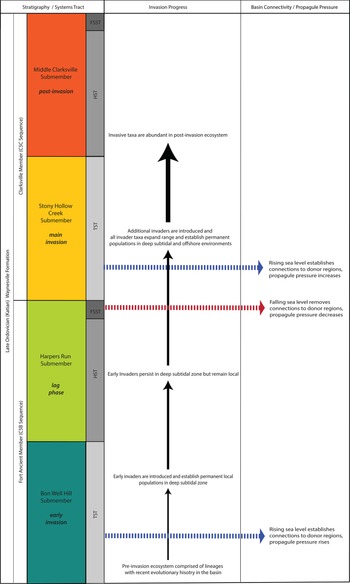
Figure 7. Progression of the Clarksville Phase of the Richmondian Invasion. Left column indicates stratigraphic position and systems tract of relative sea-level cycle. Middle and right sides indicate invasion phase, basinal linkage, and larval dispersal potential. FSST, falling-stage systems tract; HST, highstand systems tract; TST, transgressive systems tract.
The Clarksville invaders first entered the Cincinnati Sea during the transgressive systems tract of the C5B sequence. This relative sea-level high (glacial waning) flooded otherwise emergent land barriers and facilitated dispersal of marine larvae from previously isolated regions into the Cincinnati Basin, which allowed invader taxa to establish and proliferate in the deep subtidal zone (Fig. 7). Connections among basins were then severed during the falling-stage systems tract of the C5B sequence, a period of sea-level fall (glacial waxing) resulting in reduced propagule pressure. Basinal connections were subsequently reestablished during the transgressive systems tract of the C5C sequence (a period of glacial waning and sea-level rise), which increased propagule pressure, introducing additional invaders and facilitating spread of early invaders to offshore environments. The connection between invader introduction and climatic warming is further supported by the fact that the Clarksville invaders were in part a tropical faunal that entered the Cincinnati Basin from other basins, such as in Arctic Canada and the midcontinent, that were located at equatorial and tropical latitudes during the Ordovician (Foerste Reference Foerste1905; Holland Reference Holland, Brett and Baird1997; Bauer and Stigall Reference Bauer and Stigall2014). Lag phases, in which the geographic ranges of novel taxa are restricted for some time before expanding, have been documented in modern systems as well (Lockwood et al. Reference Lockwood, Hoopes and Marchetti2013; Aiello-Lammens Reference Aiello-Lammens2020; and many others), and modern data indicate that propagule pressure plays an important role in regulating the establishment and spread of invaders (Lockwood et al. Reference Lockwood, Hoopes and Marchetti2013).
Ecological and Paleocommunity Change
The progressive spread of invaders through the basin is mirrored temporally by shifts in ecosystem structure. Evenness within the basin decreased between the early invasion and lag phase, indicating ecosystem restructuring and instability during the lag phase following the initial invader arrival. Evenness then increased sharply when additional invaders were introduced and both early and late invaders spread to offshore settings and competed with incumbents in deeper waters. Evenness in the postinvasion remained high, indicating that ecosystems were not dominated by a small group of species and that ecosystem structure rebounded following the larger invasion pulse. This decrease in dominance coincident with the coordinated invasion is attributed to increased competition causing contraction of realized niches and preventing dominance by a small number of taxa.
Competitive interactions between novel and incumbent taxa and subsequent niche evolution have also been documented in other analyses. Past studies of the overall Richmondian Invasion have found that interspecific competition was an important factor in Cincinnatian brachiopod communities (Tyler and Leighton Reference Tyler and Leighton2011). The fauna of the Cincinnati Sea experienced elevated levels of niche partitioning (Patzkowsky and Holland Reference Patzkowsky and Holland2007), niche evolution (Malizia and Stigall Reference Malizia and Stigall2011; Brame and Stigall Reference Brame and Stigall2014), and food web restructuring (Kempf et al. Reference Kempf, Castro, Dineen, Tyler and Roopnarine2020) following the overall Richmondian Invasion. This study further demonstrates that these competitive interactions developed as rapid responses to the influx of invaders during a single invasion pulse, not as a gradual, cumulative process. Increased competition is expected given the low trophic level of the invaders. Studies of modern invasions in which invaders and incumbents occupy the same low trophic level have similarly documented competition as the main mechanism of invader impact (Levine et al. Reference Levine, Vilà, Antonio, Dukes, Grigulis and Lavorel2003; Bradley et al. Reference Bradley, Laginhas, Whitlock, Allen, Bates, Bernatchez, Diez, Early, Lenoir, Vilà and Sorte2019).
Patterns of habitat occupation through time further support partitioning of habitat (niche evolution) in response to the invasion. Analyses of the stability of depth preferences and tolerances of taxa show little evidence for conservation of these parameters following the initial introduction of invaders. This indicates that the depth tolerances and preferences of taxa shifted considerably between these intervals and suggests the fauna of the Cincinnati Sea partitioned habitat along the onshore–offshore gradient to accommodate the novel taxa, a pattern similar to that observed by Holland and Patzkowsky (Reference Holland and Patzkowsky2007) at a larger temporal scale. During the Clarksville Phase, initially high levels of habitat shift were followed by increased evidence for conservation of depth parameters. This indicates that shifts in the positions of taxa along the depth gradient occurred rapidly following the initial invader arrival and began to stabilize over time as habitat shifting waned. This type of response, in which taxa shifted their occupied habitat in response to competition with invaders, matches patterns observed in modern biotic invasions. For example, shifts in the habitat occupied by native green anoles have been documented in response to the introduction of brown anoles (Borden et al. Reference Borden, Bohlman and Scheffers2021), and shifts in the depth occupied by native Mediterranean fish following the introduction of invaders from the Red Sea have been documented (Por Reference Por1978).
Patterns of habitat partitioning and rates of invader proliferation were regulated by differences in ecospace utilization between the invaders and incumbent taxa. The invaders that were initially most successful were members of the low-tier unattached epifaunal passive suspension-feeder guild (e.g., Eochonetes, Strophomena, Leptaena) and stationary epifaunal passive predator guild (e.g., Grewingkia). These areas of ecospace were not strongly utilized by the native taxa, which allowed invaders occupying this region of ecospace to become abundant rapidly due to lower competition for resources (food, space, etc.). Conversely, the invaders from the low-tier attached epifaunal passive suspension-feeder guild (e.g., Hiscobeccus) were far less successful and did not attain high abundances during the study interval. Notably, this is an area of ecospace that was highly utilized by incumbent taxa, which suggests that increased competition from incumbent taxa hindered their proliferation. This is consistent with the predictions of ecological theory, which suggest that incumbent taxa should most strongly inhibit invaders from their own guild (Macarthur and Levins Reference Macarthur and Levins1967; Root Reference Root1967; Fargione et al. Reference Fargione, Brown and Tilman2003). These types of scenarios, in which small differences in ecospace utilization allow for partitioning of habitat between invaders and incumbents, have been observed in modern invasions involving marine benthic taxa. For example, small differences in gape between native and invasive mussels have been demonstrated to result in vertical zonation (habitat partitioning) between these taxa (Nicastro et al. Reference Nicastro, Zardi, McQuaid, Stephens, Radloff and Blatch2010).
Diversity Increase versus Extinction Debt
Data from modern biotic invasions indicate that alpha diversity often increases following regional-scale biotic invasions (Por Reference Por1978; Sax and Gaines Reference Sax and Gaines2003; Briggs Reference Briggs2007), which resembles the pattern of richness increase following the Clarksville Phase. However, the question of whether these increases are transient, and the loss of incumbents is simply delayed (i.e., is there an extinction debt that has yet to be paid), remains unanswered (Sax and Gaines Reference Sax and Gaines2003). The larger temporal lens this study of the Clarksville Phase provides allows us to contribute to answering this critical question. There were no extinctions of native taxa documented following the Clarksville Phase, which indicates that for systems—like the Cincinnati Sea—in which invaders occupied a low trophic level and the incumbent taxa included few ecological specialists, extinction debt is likely to be slight or absent.
When invaders and incumbents occupy the same trophic level, especially a low trophic level, the main mechanism of invader impact on the recipient biota appears to be competition (Levine et al. Reference Levine, Vilà, Antonio, Dukes, Grigulis and Lavorel2003; Bradley et al. Reference Bradley, Laginhas, Whitlock, Allen, Bates, Bernatchez, Diez, Early, Lenoir, Vilà and Sorte2019). Notably, there are very few instances in which extinctions of native species can be attributed to competition from novel species despite the vast number of biotic invasions documented in modern systems (Davis Reference Davis2003). Conversely, extinctions of native taxa have been documented most frequently following the introduction of novel predators and pathogens (Davis Reference Davis2003), and invaders at higher trophic levels have been shown to have the strongest effects on native communities (Moyle and Light Reference Moyle and Light1996; Howeth et al. Reference Howeth, Gantz, Angermeier, Frimpong, Hoff, Keller, Mandrak, Marchetti, Olden, Romagosa and Lodge2015). Ecologically specialized taxa are more vulnerable to competition from invading taxa than ecological generalists, because their niche breadth is quite narrow (Rode and Lieberman Reference Rode and Lieberman2004; Colles et al. Reference Colles, Liow and Prinzing2009; Stigall Reference Stigall2010, Reference Stigall2019; Morris et al. Reference Morris, Allhoff and Valdovinos2021; and many others). This narrow niche breadth makes accommodating novel competitors difficult, whereas ecological generalists can more easily undergo niche evolution and partition habitat. As a result, invasions of the Clarksville type, in which the invaders occupy a low trophic level, are most likely to result in extinction of incumbents over time (extinction debt) if the recipient biota contains many ecological specialists. This was not the case with the Clarksville Phase due to extinction of ecological specialists within the Cincinnati Sea during previous invasion pulses (Stigall Reference Stigall2010). Therefore, this study of the Clarksville Phase when combined with observations from modern systems, indicates that Clarksville-type invasions, in which the invaders occupy a low trophic level and the recipient biota contains few ecological specialists, are not likely to result in extinction debt and that increases in alpha diversity following these events are not transient.
Conclusions
In summary, the initial wave of invaders entered the Cincinnati Sea when warming climate and associated glacial waning caused sea level to rise and established connections between previously isolated biogeographic areas. These invaders established in the deep subtidal zone, where they competed for resources (space, food, etc.) with the incumbent taxa. This isolated invasion resulted in a shift in diversity distribution (dominance increased) but did not cause large changes in community composition. Subsequent climatic cooling and associated glacial waxing then caused sea level to drop and severed the connection to the donor region. This acted to reduce propagule pressure and restricted the invaders’ ability to expand their geographic ranges. Cooling was followed by yet another period of climatic warming that resulted in glacial waning and sea-level rise, which reestablished the connection between the Cincinnati Sea and the donor region, increased propagule pressure, and facilitated widespread invader introduction in the form of a coordinated invasion and expansion of the invaders’ geographic ranges. When this occurred, the invaders that occupied ecospace previously underutilized by the incumbents became very abundant. This induced further alterations to ecosystem structure as evenness increased, which was achieved through contraction of realized niches via habitat partitioning acting to minimize niche overlap between invaders and incumbents. Despite competition between invaders and incumbents, the fauna of the Cincinnati Sea successfully accommodated the new arrivals. The main mechanism through which this accommodation occurred was minimization of niche overlap via habitat partitioning, which was most intense following the initial arrival of invaders and then generally decreased in intensity over time. Despite having considerable impacts on the recipient biota, the Clarksville Phase did not drive incumbent taxa to extinction and resulted in a lasting increase in richness within the basin.
When examined holistically, the Clarksville Phase of the Richmondian Invasion provides a valuable case study of how climate change can induce a biotic invasion, how the progression of that invasion can be modulated by continued climate fluctuation, how ecosystems accommodate novel taxa, and how the autecology of both the invaders and incumbents influences both invader success and the impact of the invasion on the recipient biota. It also provides much-needed data on the long-term impacts of biotic invasions that cannot be obtained from studies of modern systems. Considering the current trajectory of intensifying anthropogenic climate change and rampant species transport, having a long-term perspective on biotic invasions to accompany short-term studies is critical and will allow us to better predict the long-term impacts of modern invasions and form better-informed mitigation strategies.
Acknowledgments
We acknowledge that the land comprising the study region around Cincinnati, Ohio, is the ancestral homeland and continuing home of many indigenous peoples of diverse culture and heritage, including the Myaamia (Miami), Shawandasse Tula (Shawnee), Tsalaguwetiyi (Cherokee, East), Osage, and Kaskaskia people, the vast majority of whom have been forcibly removed from their homelands (www.native-land.ca). We honor their legacy and continuing contributions to better understand the geology of the United States. We thank M. Patzkowsky, J. Huntley, and two anonymous reviewers for constructive comments that helped us improve this article. Additionally, we thank C. Brett and C. Schwalbach for their time in the field as well as A. Zaffos for his assistance with coding. This study was supported by a Paleontological Society Student Research Award and an Ohio University Geological Sciences Alumni Research Grant to I.J.F. This is a contribution to IGCP 735: Rocks and the Rise of Ordovician Life.
Declaration of Competing Interests
The authors declare no competing interests.
Data Availability Statement
Data available from the Dryad digital repository: https://doi.org/10.5061/dryad.dfn2z355t.
Supplementary Table 1: Locality data
Supplementary Table 2: Explanation of sample codes
Supplementary Table 3: Count data
Supplementary Table 4: Guild composition and membership


 Open access