


The rise of social media and the spread of partisan news and disinformation have increased the importance of conspiratorial beliefs and factual misperceptions. Scholars have responded to these trends by estimating the incidence, sources, and correlates of these beliefs.Footnote 1 Social scientists and journalists express concern that the public is misinformed about public affairs and unable to distinguish truth from innuendo. Findings generate news headlines such as “Even If It’s ‘Bonkers,’ Poll Finds Many Believe QAnon And Other Conspiracy Theories” (National Public Radio 2020) and “Half of Americans Believe in 9/11 Conspiracy Theories” (Gohse Reference Gohse2016).
The evidence generating these troubling conclusions, however, comes from opinion surveys, a measurement tool that existing research finds poses many challenges to studying political beliefs. Survey responses can be influenced by partisan cheerleading, shirking, lack of incentives, expressive responding, survey trolling, social desirability bias, and idiosyncratic error (e.g., Ansolabehere, Rodden, and Snyder Reference Ansolabehere, Rodden and Snyder2008; Berinsky Reference Berinsky2018; Bullock et al. Reference Bullock, Gerber, Hill and Huber2015; Graham and Huber Reference Graham, Huber, Barker and Suhay2020; Krosnick Reference Krosnick1991; Lopez and Hillygus Reference Lopez and Hillygus2018; Prior and Lupia Reference Prior and Lupia2008; Smallpage et al. Reference Smallpage, Enders, Drochon and Uscinski2022). These challenges can specifically influence issues surrounding rumors and misperceptions (e.g., Graham Reference Graham2022; Westwood et al. Reference Westwood, Grimmer, Tyler and Nall2022).
Here, we demonstrate an additional first-order challenge to measuring conspiratorial and political beliefs. We return to an old literature on “acquiescence-response bias”—the phenomenon where survey respondents are more likely to answer True, Agree, and Yes than False, Disagree, or No regardless of the question asked. We find that acquiescence-response bias can have important effects not only on estimates of the population rate of beliefs, but also on the correlation between beliefs and individual characteristics such as education and political ideology.
The current literature studying conspiracies, misperceptions, and disinformation could benefit from increased attention to acquiescence bias. Studies often measure beliefs by asking survey respondents if they endorse or agree with a particular statement. For example, does the respondent “Agree or Disagree” that 9/11 was a conspiracy by global elites? Is the rumor that Barack Obama was born abroad “True or False?” “Yes or no, is the following statement correct?” To document the typicality of such questions, we reviewed 60 published articles that study predictors of false beliefs summarized in a recent review of psychological drivers of misinformation (Ecker et al. Reference Ecker2022, “Drivers of False Beliefs” section). Twenty-eight of the cited studies fielded survey questions that asked about a conspiratorial or false statement and 27 of the 28 asked the question with an Agree–Disagree, Yes–No, or True–False instrument. When questions are written so that the acquiescent response indicates endorsement of a false belief or conspiracy theory, the bias can cause overestimates of the population rate of endorsement.
In addition, acquiescence bias is thought to be a dispositional trait driven by personality, education, or life experience (Schuman and Presser Reference Schuman and Presser1981). Some respondents might default to the acquiescent option as they try to answer survey questions that they have not before encountered or about which they are uncertain. This means that acquiescence bias varies across the population in ways that correlate with individual characteristics—for example, with partisanship, ideology, or education. Correlation between acquiescence bias and individual characteristics then biases estimates of correlations between individual characteristics and conspiratorial and false beliefs.
We first present new evidence that acquiescence bias can impact the inferences scholars draw from survey evidence on political beliefs, sometimes causing overestimates of 40 and 50 percentage points. Across six new surveys, we fielded the same questions asked in recent studies about political rumors and facts along with our own questions on political beliefs. We fielded surveys to thousands of respondents in the United States and China sampled from different online survey firms (Lucid, Qualtrics, and NORC) as well as Mechanical Turk. We asked about beliefs on matters of objective statistics, such as GDP growth and currency exchange rates, as well as beliefs of conspiratorial nature such as airplane contrails being government-sponsored chemicals. We used different instruments to elicit beliefs: binary True/False, agreement Likert scales, and continuous subjective probabilities, with and without monetary incentives for accuracy. We find evidence of acquiescence bias across all factors. Because our surveys cover a range of topics, samples, elicitation instruments, and types of misperceptions and conspiracies, we have greater confidence that acquiescence bias contaminates inferences for scholars across many settings and that our results are not driven by one or two idiosyncratic wordings or samples.
To estimate the incidence of acquiescence bias, we implement a simple research design. For each question on each survey, we fielded both the version of the question from the original study and an alternative version. The alternative version flips the meaning of the agreeable response so that acquiescence bias works in the opposite direction as it does in the original item. Instead of eliciting respondent beliefs that “Pope Francis endorsed Donald Trump,” the alternative question elicited beliefs that “Pope Francis did not endorse Donald Trump.” As best we could, we wrote each alternative version to be logically equivalent to the original wording. Absent acquiescence bias, respondents should return the same rate of endorsement to each version of the question.
We find that survey respondents do not return the same rate of endorsement to the two versions on the majority of questions across samples, topics, instruments, and types of belief. The magnitude of difference can be substantively large. Thus, inferences about the magnitude of conspiracy theory endorsement or misperception of political facts can depend importantly on whether the question is worded with affirmative belief measured with an acquiescent response. We also find large acquiescence bias on questions fielded to respondents in China and on questions about democratic norms and the transition of power following the 2020 American presidential election (asked in Clayton et al. Reference Clayton, Davis, Nyhan, Porter, Ryan and Wood2021).Footnote 2
We then show how acquiescence bias obscures estimates of correlations between characteristics of individuals and conspiratorial thinking. For example, we find that acquiescence bias magnifies the partisan differences of beliefs in conspiracy theories. We field questions from a highly cited work on fake news and rumors (Allcott and Gentzkow Reference Allcott and Gentzkow2017) and find that partisan differences for some beliefs are halved in the alternative version.
In recent years, many prominent studies and news stories have reported on troubling magnitudes of conspiracy theory beliefs by ideological conservatives (e.g., Garrett and Bond Reference Garrett and Bond2021). We find that subjects who identify as very conservative exhibit larger acquiescence bias than those with less ideological identification. Our results suggest that existing conclusions are driven in part by greater acquiescence bias by survey respondents with conservative leanings. We also find greater acquiescence bias by strong liberals relative to less ideological subjects.
After documenting bias in both extent and correlation, we present two simple and easy-to-use methods to correct for acquiescence bias. The first method generates estimates of both the population rate of the belief purged of acquiescence bias and of the average magnitude of bias. The second method generates estimates of population correlations between characteristics and conspiratorial beliefs purged of acquiescence bias. Each method rests on a simple assumption that acquiescence bias is on average symmetric between positive- and negative-keyed questions. To implement the fix, scholars simply field two versions of each question, one positive- and one negative-keyed, and apply the statistical correction.
1 Acquiescence-Response Bias
Acquiescence bias—“the tendency to endorse any assertion made in a question, regardless of its content” (Krosnick Reference Krosnick1999, 552)—inflates endorsement and agreement in survey response. Acquiescence bias has long been appreciated by psychologists and varies in magnitude across the population (e.g., Billiet and McClendon Reference Billiet and McClendon2000; Krosnick Reference Krosnick1999; Schuman and Presser Reference Schuman and Presser1981; Watson Reference Watson1992). Schuman and Presser (Reference Schuman and Presser1981, Chapter 8) summarize three interpretations of this heterogeneity. First, tendency to agree might be an individual personality trait generated by genes and environment. Second, acquiescence bias might follow from status differentials between participant and surveyor. Third, acquiescence bias might be a heuristic response rule for participants when they do not know how to respond to a question.
Because magnitude of acquiescence bias correlates with individual characteristics such as education, inferences about the relationship between political characteristics and beliefs might also be inaccurate in the presence of acquiescence bias. This problem, in fact, was appreciated by survey researchers in political science in the 1960s. The authors of The American Voter found that acquiescence bias undermined conclusions others had drawn about the psychological authoritarianism scale. They showed that the existing finding that those with less education were more authoritarian was due only to the higher rate of acquiescence bias among those with less education (Campbell et al. Reference Campbell, Converse, Miller and Stokes1960, 512–514).
Acquiescence bias is a common concern in psychometrics where researchers construct psychology indices based on responses to multiple Agree/Disagree Likert items. To improve measurement and validity, psychologists field multiple items thought related to the underlying index. But, if all items are coded such that the agree response indicates one end of the index and disagree the other, then the subset of respondents who exhibit acquiescence bias will be improperly placed toward the agree end of the index.Footnote 3
Psychometricians use a variety of techniques to ameliorate acquiescence bias when scaling indices. These solutions generally field multiple items to construct within-subject corrections. Methods applied include Item Response Theory models, factor analysis, or simple summing across within-subject randomization. For a review, see Billiet and McClendon (Reference Billiet and McClendon2000).
Unfortunately, psychometric methods for scaling indices can be less useful for social scientists interested in beliefs about specific items. Of the 28 studies we mentioned above that surveyed respondents about conspiratorial beliefs, only 3 created indices of belief. Most studies were interested in particular beliefs or specific sets of questions. While some studies are careful to include both true and false statements in the survey, no studies used within-question randomization by negating the statement, the approach we propose below. Furthermore, most of the studies subsequently conducted separate analyses of true and false statements, making it difficult to balance acquiescence bias across the two types of statements.
Social scientists often ask questions about political beliefs giving respondents agreeable response options (“True,” “Yes,” “Agree,” “Likely so,” etc.). If acquiescence arises as a heuristic response when subjects do not know how to answer, bias could be prevalent when (a) asking about topics the subject has not before encountered such as political rumors or conspiracies, or (b) eliciting beliefs about complicated matters of fact beyond the subject’s personal experience (e.g., Schaffner Reference Schaffner2020).Footnote 4 The consequences of bias increase in the rarity of the target belief. The smaller the fraction of the population that holds a belief—e.g., when asking about outlandish conspiracies—the more likely agreeable responses are due to acquiescence bias rather than actual belief.
For example, what should we conclude if we found that 30% of subjects respond “True” to the question “True or False: Changes to the health care system enacted by Congress and the Obama administration created ‘death panels’ which have the authority to determine whether or not a gravely ill or injured person should receive health care?” It might be that 30% did not know how to respond to the question and so used the agreeable response “True” as a default, that 30% truly believe that the Obama administration created death panels, or that it is one of the many combinations of the two types that sum to 30%. Acquiescence bias poses a fundamental threat to inference about political conspiracies and factual beliefs about politics.
2 Measuring Acquiescence Bias in Studies of Conspiracies, Rumors, and Facts
In this section, we provide a broad overview of our data and initial results before presenting details on different elicitation methods, studies, and sample populations.
To understand the extent of acquiescence bias in studies of conspiracies, rumors, and facts, we fielded six surveys in China and the United States eliciting subject beliefs about political conspiracies and politically relevant facts. Details of all surveys are in Section B of the Supplementary Material.
We asked three types of questions: (1) questions fielded by other scholars on conspiracies and beliefs in rumors, (2) questions fielded by other scholars on beliefs in political facts, and (3) questions of interest to our own substantive research agendas on factual beliefs and political learning in which we elicited probabilistic beliefs (e.g., Hill Reference Hill2017). In total, we asked 53 questions across the six surveys. All surveys included at least one attention check, and data were not collected and/or not analyzed for respondents who failed these checks.Footnote 5 We present results on conspiratorial beliefs in the main text and on misperceptions and political facts in the Supplementary Material.
We fielded two versions of each question. First, we fielded the version as written by the original study, we call this version “positive-keyed.” Second, we fielded an alternative version that was the negative of the original question so that the agreeable response had the opposite meaning (“negative-keyed”). For example, Allcott and Gentzkow (Reference Allcott and Gentzkow2017) asked a nationally representative sample after the 2016 election “At the time of the 2016 election, would your best guess have been that this statement was true?”:
Pope Francis endorsed Donald Trump.
The response options were “Yes, true,” “Not sure,” or “No, false.” We randomized whether our respondents received the original version or the alternative version:
Pope Francis DID NOT endorse Donald Trump.
It is important to note that positive-keyed does not mean the content of the statement or conspiracy theory is positive, but rather that the agreeable response option aligns with the original version of the question. In other words, some positive-keyed questions include a “NOT” phrase, and some negative-keyed questions do not. For example, the positive-keyed question of the conspiracy theory surrounding Barack Obama’s birth certificate is phrased, “President Barack Obama was not really born in the United States and does not have an authentic Hawaiian birth certificate,” because this was the original version of the question; whereas the negative-keyed version is phrased, “President Barack Obama was born in the United States and has an authentic Hawaiian birth certificate.”
Randomization occurred at the subject-question level, so each subject received a mix of positive-keyed and negative-keyed questions. Creating a negated version of each item was not always trivial. In the Supplementary Material, we limit analysis to unambiguous negations without consequence to substantive conclusions. We present question wordings in Tables A1–A4 in the Supplementary Material.
For each question with an Agree/Disagree, True/False, or Yes/No response, we calculated the proportion of subjects agreeing with the positive-keyed statement—the original version of the conspiracy theory, rumor, or fact. For ease of comparison, we recode the negated question so that responses have the same target belief as the original, an endorsement of the statement presented in the positive-keyed version. We then code “don’t know” and “not sure” responses as not agreeing. To make this concrete, suppose that a statement had three response options: True, False, and Don’t Know. We code as agreement either answering True to the positive-keyed version or False to the negative-keyed version. In each case, Don’t Know is pooled with disagreement.Footnote 6
Absent acquiescence bias, the two percentages should be equivalent, subject to sampling variability. Acquiescence bias, in contrast, would push responses to the two versions in opposite directions with greater estimated endorsement for the positive-keyed wording.
The American National Election Studies (ANES) in recent years, to its credit, has fielded an instrument to elicit beliefs on misinformation with a feature to counteract acquiescence bias. This instrument is similar in spirit to our approach. In a first question, the instrument asks the respondent to indicate which of the two versions, roughly positive- and negative-keyed, they believe more likely true. In a second question, the instrument asks how confident they are in that position.Footnote 7 We discuss the benefits to this approach in Section D of the Supplementary Material and conclude that the instrument is likely to more effectively mitigate acquiescence bias than the instruments commonly fielded by other researchers. We also show, however, that scholars might want to use our methods with the ANES instrument to mitigate acquiescence bias in the second confidence question.
In Figure 1, we present the results of the 53 survey questions we fielded. On the x-axis, we plot the estimated agreement with the conspiracy theory, rumor, or fact when the question is positive-keyed. On the y-axis, we plot estimated agreement with the conspiracy theory, rumor, or fact when the question is negative-keyed, the negated form of the original version. Note that the responses of the negative-keyed version have been recoded, so they exist on the same scale as the positive-keyed and, therefore, absent bias the points in this plot should fall approximately on the 45 degree line.

Figure 1 Effect of question wording on agreement with rumors and facts. “*” indicates positive and negative-keyed estimates statistically distinct at
 $p<.05$
two-tailed.
$p<.05$
two-tailed.
All but one point falls below the 45 degree line, meaning that the positive-keyed version of the question has a larger estimate of endorsement than the negative-keyed version.Footnote 8 In some questions, the points are quite close to the line; for example, Question 21 fielded in the United States on whether the Chinese government created the coronavirus as a biological weapon does not exhibit large amounts of acquiescence bias. In other questions, the positive-keyed version of the question produces a drastically larger estimate of belief. For example, Question 26 on whether or not the FBI director alerted Congress about new emails on Hillary Clinton’s server on October 28, 2016 yielded an agreement of 64% when asked in the positive-keyed version, but only 22% when asked in a negative-keyed version.
2.1 Refielding of Previous Surveys
In two studies fielded in 2020 and 2021, we asked about conspiratorial and factual beliefs in online surveys in the United States and China.Footnote 9 The first was fielded using the online survey platform Lucid, which provided a nationally representative sample of 2,055 respondents in December 2020. The second was fielded using the online survey platform Qualtrics in China in March–April 2021. Qualtrics provided a quota-based sample matched to population targets. We present details on the two samples in Section B of the Supplementary Material.
2.1.1 Rumors and Conspiracies
We roughly categorize our questions into three types. For rumors and conspiracies in the United States, we field questions of Allcott and Gentzkow (Reference Allcott and Gentzkow2017), who analyze consumption of fake news and its relation to beliefs about conspiracy theories, Berinsky (Reference Berinsky2017), who considers misinformation surrounding national health care policy, Clayton et al. (Reference Clayton, Davis, Nyhan, Porter, Ryan and Wood2021), who present results from survey experiments on population endorsement of democratic norms, Oliver and Wood (Reference Oliver and Wood2014), who examine conspiracy theories and paranoia, and Jamieson and Albarracin (Reference Jamieson and Albarracin2020), who consider misinformation and media consumption about the COVID-19 pandemic.
In China, we ask questions similar to Cui and Shoemaker (Reference Cui and Shoemaker2018), who study attitudes toward conspiracies and facts about genetically modified food in China. We also ask questions related to some U.S. conspiracies from Oliver and Wood (Reference Oliver and Wood2014) to the China sample. Although we ask the same questions, we do not pool respondents from the two countries in any individual-level regressions so that we do not make comparisons of covariates in the two samples.
The studies we based our surveys upon fielded different question designs. Some used binary True/False response options while others used Agree/Disagree with between two and seven categories. We used the original response options in our surveys, but for presentation here, we compute for each item the percentage of responses indicating agreement, meaning “True,” “Agree,” or “Yes,” with or without qualification (“definitely” as well as “probably”).
The circled dots in Figure 1 represent results for the rumor and conspiracy theory items (see also Figure A1 in the Supplementary Material). The difference between percentage agreeing to positive- and negative-keyed versions varies across questions from 43 points on the Obama born abroad question in China to
 $-12.5$
points on the Oliver and Wood (Reference Oliver and Wood2014) question on government planning of the 9/11 terrorist attacks.Footnote
10
All but this one difference is positive. In general, the questions in the China sample had greater levels of acquiescence bias than the U.S. sample, perhaps because many of the conspiracies asked were related to the United States and so were unfamiliar to respondents.
$-12.5$
points on the Oliver and Wood (Reference Oliver and Wood2014) question on government planning of the 9/11 terrorist attacks.Footnote
10
All but this one difference is positive. In general, the questions in the China sample had greater levels of acquiescence bias than the U.S. sample, perhaps because many of the conspiracies asked were related to the United States and so were unfamiliar to respondents.
On some questions, the divergent estimates from the original versus negated version of the question are of political importance. In the original question of Allcott and Gentzkow, our sample indicates more than half (53%) believed “At the third presidential debate, Donald Trump refused to say whether he would concede the election if he lost” versus less than one third (32%) in the negated version. In the original question of Clayton et al., our sample indicates that 80% of the public believes “Presidential candidates should accept the outcome of elections even if they narrowly lose,” whereas only 52% disagree that “Presidential candidates need not accept the outcome of elections if they narrowly lose.” The percentage who agreed that “Sometimes regular people need to be a little violent to make sure votes are counted correctly” was double (24% vs. 12%) the percentage who disagreed that “Regular people DO NOT need to be a little violent to make sure votes are counted correctly.”Footnote 11
In Section C of the Supplementary Material, we summarize results for misperceptions about political facts, which are also presented in Figure 1. We find similar levels of acquiescence bias as for conspiratorial beliefs, even when respondents are provided with monetary incentives for correct answers.
The results here and in the Supplementary Material show that acquiescence bias can be of substantive importance for conclusions (a) about population beliefs about objective facts, (b) for different instruments that elicit beliefs, and (c) does not seem to be resolved by the use of incentives. While acquiescence bias does not always influence inferences about conspiratorial or factual beliefs, in many cases scholars would come to substantively different conclusions about population beliefs if they asked a positive- rather than a negative-keyed question. These biases exist across instruments of measurement, source of population samples, topics, and in both the United States and in China.
3 Robustness of Main Findings to Question Negation and Country of Sample
Not all original questions yielded a simple alternative wording of unambiguous logical equivalence. Skeptical readers might wonder if the divergence in rates of endorsement between positive- and negative-keyed versions is due to logical non-equivalence rather than acquiescence bias. To evaluate this possibility, we reproduce Figure 1 in Section F of the Supplementary Material for 35 questions that we identified of unambiguous logical equivalence. The alternative version of these questions simply adds or subtracts the word “not” along with minor modification of verb tenses. Figure A4 in the Supplementary Material reproduces the pattern of Figure 1 with all items below the 45 degree line and many far below. We find that, if anything, ambiguous alternative question wordings lead to less acquiescence bias with mean magnitudes of 8.9 (unambiguous) and 7.3 (ambiguous). We also find that our results hold separately for U.S. and China samples (Table A6 in the Supplementary Material).
4 Correlates of Conspiracy Theory Beliefs and Acquiescence Bias
In addition to the incidence of conspiratorial beliefs and misperceptions in the population, correspondence between such beliefs and citizen characteristics interests scholars. For example, Allcott and Gentzkow (Reference Allcott and Gentzkow2017) report that having beliefs aligned with the partisan or ideological implications of a news headline corresponds to greater endorsement of the veracity of that headline. We replicate the Allcott and Gentzkow (Reference Allcott and Gentzkow2017) finding first with responses from our subjects assigned the original version of the question. We then compare conclusions with analysis of negative-keyed questions.
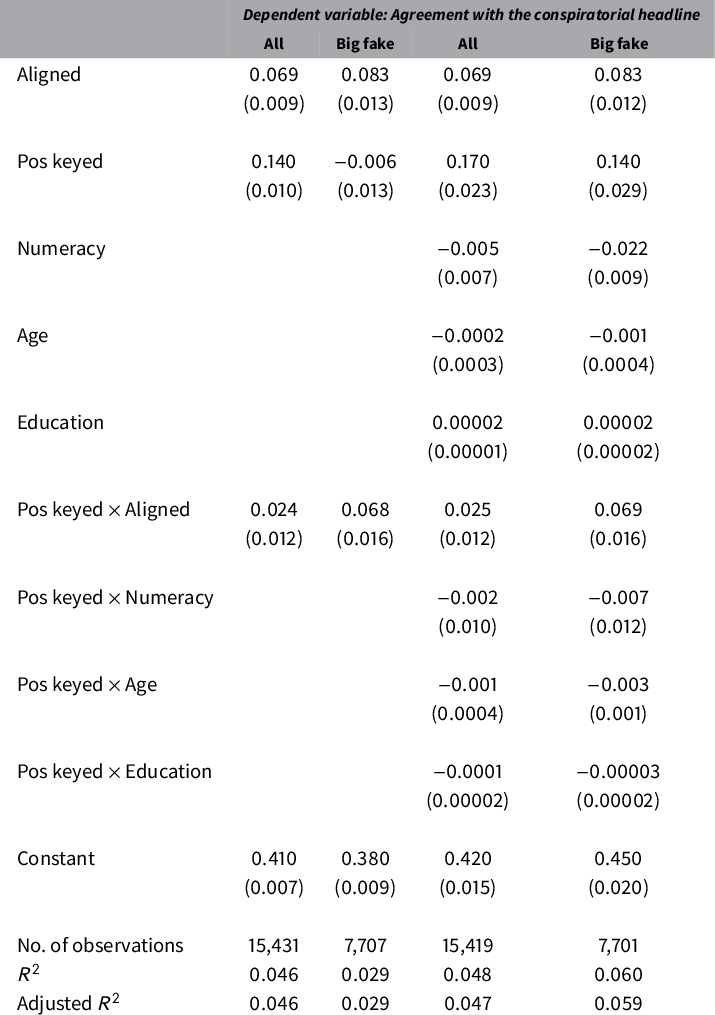
Table 1 presents ordinary least-squares (OLS) regression results of the relationship between subject ideological alignment with the news headline (as coded by the original authors) and endorsement of the news headline, for both positive-keyed and negative-keyed versions of the questions we repeated from Allcott and Gentzkow (Reference Allcott and Gentzkow2017) in our U.S. 2020 survey. As before, we recode responses to negative-keyed versions so that “agreement” indicates agreement with the original wording of the question. Following Allcott and Gentzkow (Reference Allcott and Gentzkow2017), we code agreement with the original wording as 1, “Don’t know” as .5, and disagreement as 0. Standard errors are clustered on the respondent because each answers more than one question.
Table 1 Analysis of responses to questions we repeated from Allcott and Gentzkow (Reference Allcott and Gentzkow2017) in our U.S. 2020 survey. Correlation between aligned ideology and belief in news headlines, positive-keyed versus negative-keyed items. Left two regression show results for all news headlines, and right two regression show results only for items labeled by Allcott and Gentzkow (Reference Allcott and Gentzkow2017) as “Big Fake.” Standard errors clustered on the respondent in parentheses.

The negative-keyed questions (columns 2 and 4) suggest substantively smaller correlation between ideological alignment and reported belief. The magnitude of decline is especially large among the subset of news headline described by Allcott and Gentzkow (Reference Allcott and Gentzkow2017) as “Big Fake,” fake news stories that were mentioned in at least three mainstream media articles. Among these stories, the relationship to ideological alignment is 45% smaller with the negative-keyed question.
The cause of the divergent correlations in Table 1 is that acquiescence bias varies substantially between groups. We evaluate how bias varies by four characteristics of the respondent drawn from existing work on acquiescence bias and misperceptions. First, we consider how it varies with political ideology. Second, we consider the relationship with age and education, two factors that the older survey methodology literature on acquiescence bias suggests. Third, we consider variation with respondent aptitude at numerical thinking following the measurement instrument of Frederick (Reference Frederick2005) and arguments about the relationship between reasoning and accepting fake news made by Pennycook and Rand (Reference Pennycook and Rand2019) and Stanley et al. (Reference Stanley, Barr, Peters and Seli2021).
In Table 2, we present regressions pooling positive- and negative-keyed questions and interacting an indicator of positive-keyed with ideological alignment and with characteristics of the subject. We find substantively large interactions with ideological alignment. Questions aligned with respondent ideology exhibit more acquiescence bias, especially for “Big Fake” statements.
Table 2 Analysis of responses to questions we repeated from Allcott and Gentzkow (Reference Allcott and Gentzkow2017) in our U.S. 2020 survey. Impact of Allcott and Gentzkow (Reference Allcott and Gentzkow2017) question wording on belief varies by ideological alignment. Left regression is all statements, and right regression is “Big Fake” statements. Standard errors clustered on the respondent in parentheses.
In Tables A7 and A8 in the Supplementary Material, we evaluate how acquiescence bias affects correlations for questions from Oliver and Wood (Reference Oliver and Wood2014) and Jamieson and Albarracin (Reference Jamieson and Albarracin2020). We find similar results. The magnitudes of correlation between endorsement of conspiracies and covariates and between misperception of facts and covariates depend on whether the question was fielded as original or negated.
In sum, for each of the studies that we refielded, we find that magnitude of acquiescence bias varies by characteristics of the respondent. Acquiescence bias for these questions is more common among very conservative subjects, very liberal subjects, younger subjects, those with innumeracy, and those with lower education.
5 Accounting for Acquiescence Bias
Fielding positive- and negative-worded versions of 53 questions eliciting beliefs shows that acquiescence bias influences survey estimates of three quantities of interest to political scientists: rates of endorsement of conspiracies, rates of political misperceptions, and correlations between features of individuals and their beliefs. In this section, we present two simple statistical procedures to estimate (a) population beliefs controlling for acquiescence bias and (b) correlations purged of acquiescence bias.
Our methods correct sample data to provide an acquiescence-free estimate of population quantities. We show how random assignment of positive- and negative-keyed versions of each item allows for estimation of the magnitude of and a correction for bias.
Consider a conspiratorial or factual statement about the world, for example, that Barack Obama was born in the United States. Let the random variable
 $Y_{i}$
represent the response by subject i to a measurement instrument—e.g., a survey question—used to measure subject i’s belief about the statement. Let
$Y_{i}$
represent the response by subject i to a measurement instrument—e.g., a survey question—used to measure subject i’s belief about the statement. Let
 $Y^{*}_{i}$
be the subject’s belief about the statement could it be elicited without acquiescence bias.
$Y^{*}_{i}$
be the subject’s belief about the statement could it be elicited without acquiescence bias.
Our replication studies strongly suggest that the response
 $Y_{i}$
in many cases is perturbed by acquiescence bias such that
$Y_{i}$
in many cases is perturbed by acquiescence bias such that
 $E(Y_{i}) \neq Y^{*}_{i}$
. To characterize the bias
$E(Y_{i}) \neq Y^{*}_{i}$
. To characterize the bias
 $E(Y_{i} - Y^{*}_{i})$
, define
$E(Y_{i} - Y^{*}_{i})$
, define
 $Y_{i}(p)$
and
$Y_{i}(p)$
and
 $Y_{i}(n)$
as the responses of subject i were she asked the positive-keyed (p) or negative-keyed (n) version of the measurement instrument.
$Y_{i}(n)$
as the responses of subject i were she asked the positive-keyed (p) or negative-keyed (n) version of the measurement instrument.
 $Y_{i}(p)$
and
$Y_{i}(p)$
and
 $Y_{i}(n)$
should be coded so that increasing values indicate increasing endorsement of the belief, not increasing agreement with the question asked. For example, if question version p is “True or False: Barack Obama was born in the United States” and version n is “True or False: Barack Obama was not born in the United States,” and if
$Y_{i}(n)$
should be coded so that increasing values indicate increasing endorsement of the belief, not increasing agreement with the question asked. For example, if question version p is “True or False: Barack Obama was born in the United States” and version n is “True or False: Barack Obama was not born in the United States,” and if
 $Y_{i}(p)=1$
represents response “True” and
$Y_{i}(p)=1$
represents response “True” and
 $Y_{i}(p)=0$
represents the response “False,” then
$Y_{i}(p)=0$
represents the response “False,” then
 $Y_{i}(n)=1$
would represent “False” and
$Y_{i}(n)=1$
would represent “False” and
 $Y_{i}(n)=0$
would represent “True.” For both versions, the original response “True” is the agreeable response possibly subject to acquiescence bias.
$Y_{i}(n)=0$
would represent “True.” For both versions, the original response “True” is the agreeable response possibly subject to acquiescence bias.
The data-generating process of subject i measured response
 $Y_{i}$
is
$Y_{i}$
is
 $$ \begin{align} \nonumber & Y_{i}(p) = Y^{*}_{i} + \delta_{i}, \\ & Y_{i}(n) = Y^{*}_{i} - \delta_{i}\\[-24pt]\notag \end{align} $$
with
 $\delta _{i}$
acquiescence bias for subject i.
$\delta _{i}$
acquiescence bias for subject i.
Let
 $D_{i}$
represent the version of instrument fielded such that
$D_{i}$
represent the version of instrument fielded such that
 $D_{i}=1$
if i responds to the positive-key version p and
$D_{i}=1$
if i responds to the positive-key version p and
 $D_{i}=-1$
if i responds to the negative-key version n. We then consolidate (1) into
$D_{i}=-1$
if i responds to the negative-key version n. We then consolidate (1) into
 $$ \begin{align} Y_{i}(D_{i}) = Y^{*}_{i} + D_{i}\delta_{i}.\\[-24pt]\notag \end{align} $$
The observed response
 $Y_{i}(D_{i})$
is the acquiescence-free belief
$Y_{i}(D_{i})$
is the acquiescence-free belief
 $Y^{*}_{i}$
plus (when
$Y^{*}_{i}$
plus (when
 $D_{i}=1$
) or minus (when
$D_{i}=1$
) or minus (when
 $D_{i}=-1$
) the subject’s acquiescence-bias
$D_{i}=-1$
) the subject’s acquiescence-bias
 $\delta _{i}$
. Given data-generating Equation (2), consider an OLS regression of Y on D with a representative sample from the target population
$\delta _{i}$
. Given data-generating Equation (2), consider an OLS regression of Y on D with a representative sample from the target population
 $$ \begin{align*} Y_{i} = \alpha + \beta D_{i} + \varepsilon_{i}\\[-24pt] \end{align*} $$
with
 $\varepsilon _{i}$
an independent and identically distributed error term. When the expected value of
$\varepsilon _{i}$
an independent and identically distributed error term. When the expected value of
 $\varepsilon _{i}$
is zero, the coefficient
$\varepsilon _{i}$
is zero, the coefficient
 $\alpha $
estimates the population average belief
$\alpha $
estimates the population average belief
 $E(Y^{*}_{i})$
purged of acquiescence bias. The coefficient
$E(Y^{*}_{i})$
purged of acquiescence bias. The coefficient
 $\beta $
estimates the population average acquiescence bias
$\beta $
estimates the population average acquiescence bias
 $\Delta = E(\delta _{i})$
under the usual assumptions for ordinary least-squares regression. This regression might also use post-stratification survey weights to target a population-level average in the presence of individual heterogeneity (assuming random assignment of D).
$\Delta = E(\delta _{i})$
under the usual assumptions for ordinary least-squares regression. This regression might also use post-stratification survey weights to target a population-level average in the presence of individual heterogeneity (assuming random assignment of D).
5.1 Correlates
In addition to population rates, our method can be extended to mitigate bias in correlations. To model the relationship between beliefs and characteristics of the subject, substitute the quantity
 $Y^{*}_{i}$
in Equation (2) with the linear combination
$Y^{*}_{i}$
in Equation (2) with the linear combination
 $x_{i}'\gamma $
, x a k-vector of covariates and
$x_{i}'\gamma $
, x a k-vector of covariates and
 $\gamma $
a k-vector of coefficients. Thus,
$\gamma $
a k-vector of coefficients. Thus,
 $\gamma $
represents the expected correspondence between individual characteristics
$\gamma $
represents the expected correspondence between individual characteristics
 $x_{i}$
and acquiescence-free beliefs
$x_{i}$
and acquiescence-free beliefs
 $Y^{*}_{i}$
. This substitution leads to the updated data-generating process
$Y^{*}_{i}$
. This substitution leads to the updated data-generating process
 $$ \begin{align} Y_{i}(D_{i}) = x_{i}'\gamma + D_{i}\delta_{i}. \end{align} $$
To see the problem of acquiescence bias for estimating correlates of political beliefs, consider a sample of size
 $\mathcal {N}$
. Define the
$\mathcal {N}$
. Define the
 $\mathcal {N}$
-vectors Y, D, and
$\mathcal {N}$
-vectors Y, D, and
 $\delta $
for the sample values of
$\delta $
for the sample values of
 $Y_{i}$
,
$Y_{i}$
,
 $D_{i}$
, and
$D_{i}$
, and
 $\delta _{i}$
. Define X the
$\delta _{i}$
. Define X the
 $\mathcal {N}$
-by-k matrix of covariates. The OLS estimate of
$\mathcal {N}$
-by-k matrix of covariates. The OLS estimate of
 $\gamma $
is
$\gamma $
is
 $$ \begin{align*} \hat{\gamma} = (X'X)^{-1}X'Y.\\[-24pt] \end{align*} $$
Substituting the known data-generating process of Y, we have
 $$ \begin{align} \nonumber \hat{\gamma} & = (X'X)^{-1}X'(X\gamma + D\delta) \\ & = \gamma + (X'X)^{-1}X'D\delta.\\[-24pt]\notag \end{align} $$
The OLS estimator of the k correlations
 $\gamma $
is biased by the second term in (4), the covariance between
$\gamma $
is biased by the second term in (4), the covariance between
 $x_{i}$
and
$x_{i}$
and
 $\delta _{i}$
. Covariance between
$\delta _{i}$
. Covariance between
 $x_{i}$
and
$x_{i}$
and
 $\delta _{i}$
was exactly the problem diagnosed by the The American Voter discussed in Section 1; because studies had fielded only positive-keyed versions of questions measuring authoritarianism, correlation between acquiescence bias and education inflated estimates of the relationship between authoritarianism and education.
$\delta _{i}$
was exactly the problem diagnosed by the The American Voter discussed in Section 1; because studies had fielded only positive-keyed versions of questions measuring authoritarianism, correlation between acquiescence bias and education inflated estimates of the relationship between authoritarianism and education.
Equation (4) suggests two options to ameliorate bias in
 $\hat {\gamma }$
. In each, the analyst assigns at-random positive- and negative-keyed versions of each item. In the first solution, regress
$\hat {\gamma }$
. In each, the analyst assigns at-random positive- and negative-keyed versions of each item. In the first solution, regress
 $Y_{i}$
on covariates of interest
$Y_{i}$
on covariates of interest
 $x_{i}$
, a variable
$x_{i}$
, a variable
 $D_{i}$
taking the values 1 and
$D_{i}$
taking the values 1 and
 $-1$
indicating version positive and negative, and an interaction between
$-1$
indicating version positive and negative, and an interaction between
 $D_{i}$
and
$D_{i}$
and
 $x_{i}$
:
$x_{i}$
:
 $$ \begin{align*} Y_{i} = \beta_{0} + \beta_{1}x_{i} + \beta_{2}D_{i} + \beta_{3}D_{i}x_{i} + \epsilon_{i}.\\[-24pt] \end{align*} $$
The coefficient(s) on
 $x_{i}$
,
$x_{i}$
,
 $\beta _{1}$
, estimates the correlation between
$\beta _{1}$
, estimates the correlation between
 $x_{i}$
and
$x_{i}$
and
 $Y^{*}_{i}$
free of acquiescence bias. The coefficient
$Y^{*}_{i}$
free of acquiescence bias. The coefficient
 $\beta _{2}$
is an estimate of average acquiescence bias, and the coefficient(s)
$\beta _{2}$
is an estimate of average acquiescence bias, and the coefficient(s)
 $\beta _{3}$
estimate heterogeneity of acquiescence bias related to
$\beta _{3}$
estimate heterogeneity of acquiescence bias related to
 $x_{i}$
. As before, one could estimate this regression with post-stratification survey weights.
$x_{i}$
. As before, one could estimate this regression with post-stratification survey weights.
Second, the analyst can implement weighted least-squares (WLS) without including the variable
 $D_{i}$
in the regression. When the vector D is perfectly balanced—when the number of positive- and negative-keyed responses is exactly equal—its expected value is zero because one
$D_{i}$
in the regression. When the vector D is perfectly balanced—when the number of positive- and negative-keyed responses is exactly equal—its expected value is zero because one
 $D_{i}=1$
offsets each
$D_{i}=1$
offsets each
 $D_{i}=-1$
. When the vector D is assigned at random, the expected covariance of
$D_{i}=-1$
. When the vector D is assigned at random, the expected covariance of
 $D_{i}$
and
$D_{i}$
and
 $\delta _{i}$
is zero. When the covariance of
$\delta _{i}$
is zero. When the covariance of
 $D_{i}$
and
$D_{i}$
and
 $\delta _{i}$
is zero, the expected values of their product,
$\delta _{i}$
is zero, the expected values of their product,
 $D_{i}\delta _{i}$
, is zero. Therefore, the expected value of the bias terms in (4) is zero when D is balanced and assigned at random.
$D_{i}\delta _{i}$
, is zero. Therefore, the expected value of the bias terms in (4) is zero when D is balanced and assigned at random.
To achieve exact balance on D, define the matrix W with elements on the diagonal
 $\frac {\mathcal {N}}{2N}$
for the N subjects asked question version p and
$\frac {\mathcal {N}}{2N}$
for the N subjects asked question version p and
 $\frac {\mathcal {N}}{2\tilde {N}}$
for the
$\frac {\mathcal {N}}{2\tilde {N}}$
for the
 $\tilde {N}$
subjects asked question version n, off-diagonal cells zero,
$\tilde {N}$
subjects asked question version n, off-diagonal cells zero,
 $N + \tilde {N} = \mathcal {N}$
. Then
$N + \tilde {N} = \mathcal {N}$
. Then
 $$ \begin{align} \hat{\gamma}_{WLS} = (X'WX)^{-1}X'WY\\[-24pt]\notag \end{align} $$
is an unbiased estimate of
 $\gamma $
. If the dataset includes post-stratification weights, the values N and
$\gamma $
. If the dataset includes post-stratification weights, the values N and
 $\tilde {N}$
should be the sum of the weights in each assignment rather than the count of observations, and the diagonals of the weight matrix W should be the product of the terms above and the original survey weight. With survey weights, the regression method is likely to be easier to implement than weighting.Footnote
12
$\tilde {N}$
should be the sum of the weights in each assignment rather than the count of observations, and the diagonals of the weight matrix W should be the product of the terms above and the original survey weight. With survey weights, the regression method is likely to be easier to implement than weighting.Footnote
12
We emphasize that these fixes depend on the untested assumption that acquiescence bias does not vary by key. Because of this assumption, we recommend that researchers present analysis separately by version of the question in addition to implementing the proposed solutions.
6 Applying the Method
We apply the WLS approach to examine the correlation between ideology and belief in conspiracy theory in each of the studies. For each question, we calculated the weights for positive-keyed and negative-keyed responses as
 $\frac {\mathcal {N}}{2N}$
and
$\frac {\mathcal {N}}{2N}$
and
 $\frac {\mathcal {N}}{2\tilde {N}}$
. Because of the large number of items, we present coefficient plots instead of regression tables. While we plot and discuss the correlation between conspiratorial belief and the subject identifying as very conservative in the main body, we apply the method to coefficients for very liberal, numeracy, age, and education and present full regression tables in Section I of the Supplementary Material.
$\frac {\mathcal {N}}{2\tilde {N}}$
. Because of the large number of items, we present coefficient plots instead of regression tables. While we plot and discuss the correlation between conspiratorial belief and the subject identifying as very conservative in the main body, we apply the method to coefficients for very liberal, numeracy, age, and education and present full regression tables in Section I of the Supplementary Material.
In Figure 2, we plot coefficients, 84% confidence intervals (thick line), and 95% confidence intervals (thin line) on the very conservative indicator for each question for (1) the sample assigned the positive-keyed version of the question, (2) the sample assigned the negative-keyed version of the question, and (3) the WLS method combining the two (point with solid line). To be consistent with the original coding in Allcott and Gentzkow (Reference Allcott and Gentzkow2017), we coded agreement with the original version of the question as 1, don’t know as .5, and 0 as disagreement, although coding don’t know as zero produces very similar results. We shade the background for coefficients where we would reject the null hypothesis of no relationship between very conservative and agreement with one question wording but not reject with another. For half of the questions, the result of this statistical test depends on question wording.
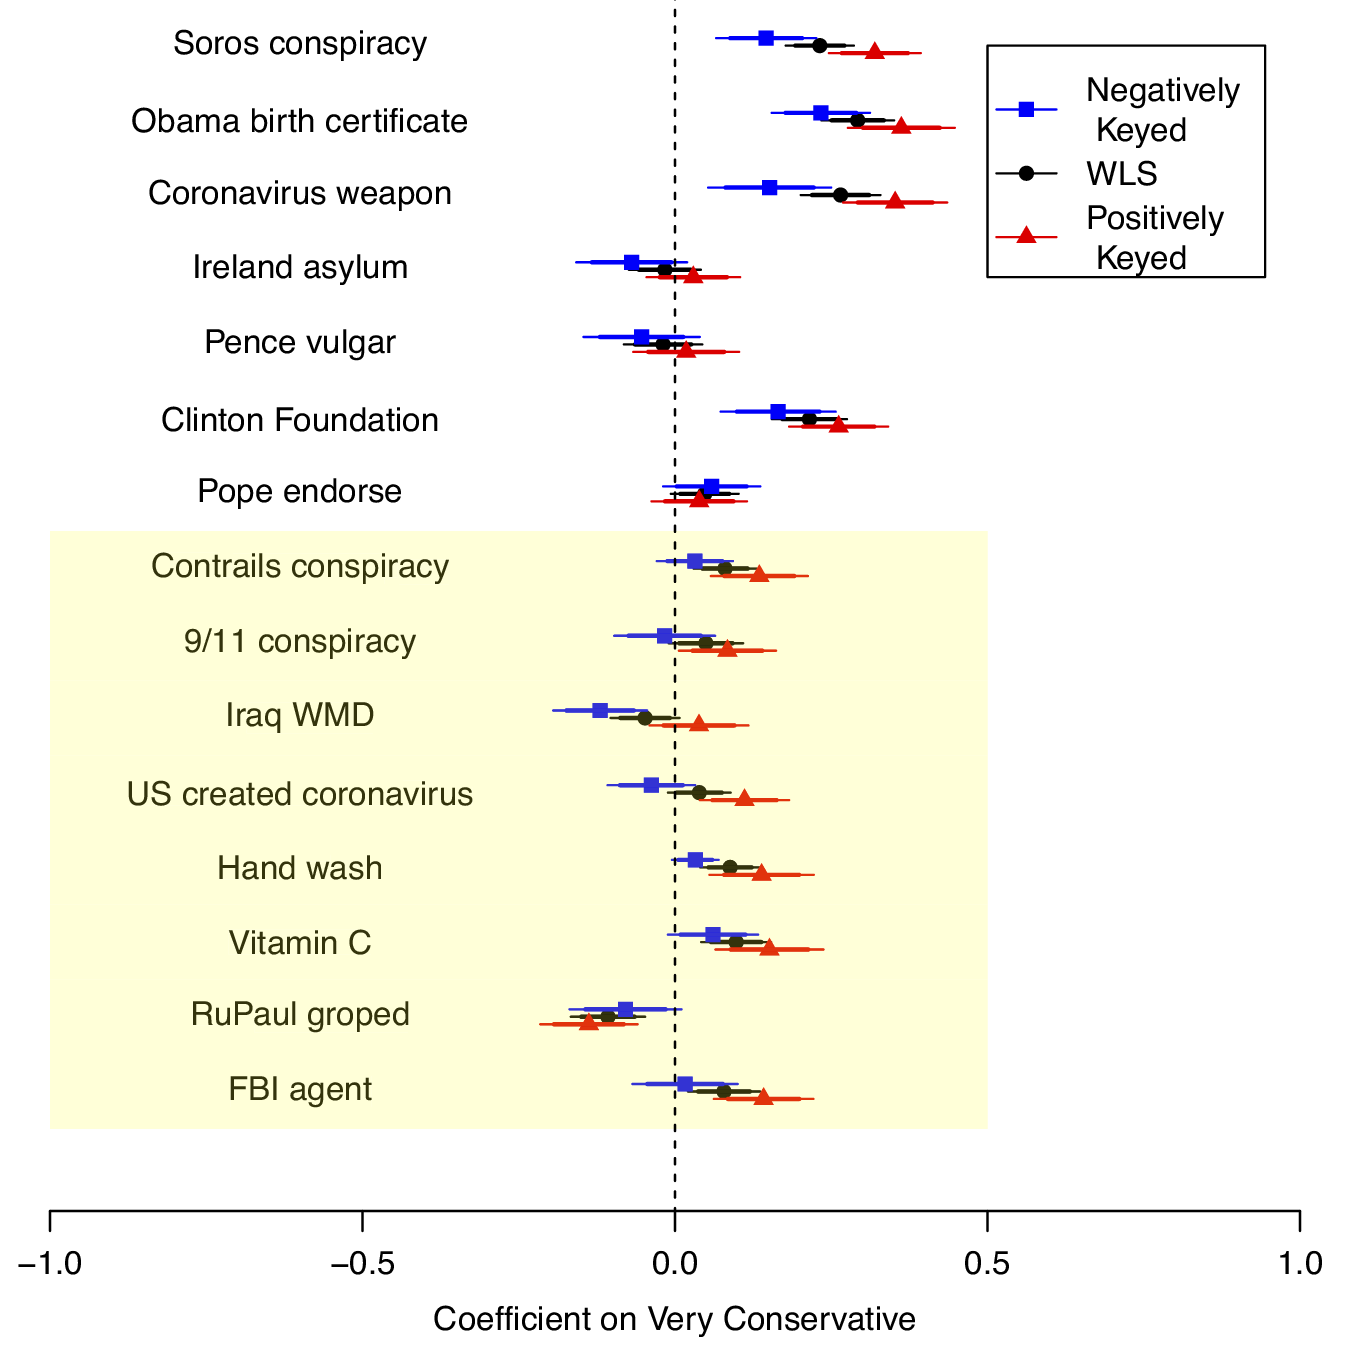
Figure 2 Coefficient indicating the correlation between very conservative and belief in the conspiracy theory. Questions refielded from Allcott and Gentzkow (Reference Allcott and Gentzkow2017), Oliver and Wood (Reference Oliver and Wood2014), and Jamieson and Albarracin (Reference Jamieson and Albarracin2020). The thick and thin lines extend to 84% and 95% confidence intervals.
7 Recommendations and Conclusion
We believe that our evidence suggests that acquiescence bias causes substantively important problems for research on political conspiracies and beliefs. We hope to have brought this challenge to the attention of scholars and to have provided knowledge and methods to improve future research. We see as particularly promising the possibility that acquiescence bias might be related to findings on framing effects (e.g., Druckman Reference Druckman2001) if different frames might be keyed in positive versus negative directions. We would also be interested to see new work on the potential influence of acquiescence bias on survey measurement of citizen policy views.
While we do not believe there is a one-size-fits-all recommendation because each topic of interest will have its own idiosyncracies, our investigation brings forward a set of suggested practices.
First, we recommend fielding both positive- and negative-keyed instruments to elicit beliefs. Examining differences in estimates and presenting them to readers should be the first practice. We would then, in general, recommend combining results from the two instruments with one of our proposed estimators.
Second, we would encourage scholars to consider multiple-choice or other instruments without agreeable responses. This approach, however, presents the first-order challenge of selecting the appropriate set of response options. In Section G of the Supplementary Material, we analyze an alternative multiple-choice approach we fielded in our surveys similar to the suggestion in Clifford, Kim, and Sullivan (Reference Clifford, Kim and Sullivan2019). We do not find evidence that the approach is superior but would advocate future research.
The third option is to field an instrument similar to recent American National Election Studies misinformation items (see Section D of the Supplementary Material). We would advocate future research to determine the trade-offs between the ANES two-question approach and our single-question approach. We show in the Supplementary Material that both approaches can benefit from our WLS statistical fix. One challenge for future work is that there is no absolute benchmark with which to evaluate different instruments.
We close with a more general recommendation. Measurement challenges should be of central concern for scholars interested in sensitive or complicated political beliefs. Best practice in survey research is to pilot, test, and evaluate different measurement instruments. Too often scholars put one question on a survey without testing and validating and then assume the responses to that particular item accurately reflect the beliefs of their subjects. We encourage scholars to consider how the choice of instrument might materially influence the inferences they draw about political conspiracies and beliefs.
Funding and Research with Human Subjects
Data collected for the 2017–2018 U.S. study by Time-Sharing Experiments for the Social Sciences, NSF Grant 0818839, Jeremy Freese and James Druckman, Principal Investigators. We thank in part UC San Diego (UCSD), Academic Senate Research Award for support. In addition, for support for some of our surveys, we thank the “China from the Ground Up” project under the auspices of the China Data Lab at UCSD, supported by the Carnegie Corporation of New York, Henry Luce Foundation, and private donors to the 21st Century China Center. The experiments presented here are approved by the UCSD Human Research Protections Program.
Acknowledgments
We thank participants at APSA, the UC Riverside Behavior Conference, the faculty seminar at UCSD Political Science, the UCSD Cognitive Psychology lunch, SMAPP Global, NYU, John Bullock, Taylor Carlson, Alex Coppock, Tiberiu Dragu, Matt Gentzkow, Matt Graham, Andy Guess, Haifeng Huang, Greg Huber, Brendan Nyhan, Doug Rivers, Arturas Rozenas, Jake Shapiro, Chris Tausanovitch, Dustin Tingley, Lynn Vavreck, and Yiqing Xu for feedback. We also thank Yingjie Fan, Zhenyun Guo, and Kennedy Middleton for excellent research assistance.
Data Availability Statement
Replication code for this article is available in Hill and Roberts (Reference Hill and Roberts2022) at https://doi.org/10.7910/DVN/TVJCTX.
Supplementary Material
For supplementary material accompanying this paper, please visit https://doi.org/10.1017/ pan.2022.28.


 Open access