


1 INTRODUCTION
Pulsars are generally observed at high time resolution in order to detect and resolve their pulses. However, many can also be detected in continuum interferometric images via their phase-averaged emission (e.g., Kaplan et al. Reference Kaplan, Condon, Arzoumanian and Cordes1998), which offers additional useful information. For example, in contrast to difficulties in absolute flux calibration of single-dish observations (e.g., Lorimer & Kramer Reference Lorimer and Kramer2012), interferometers allow accurate flux density measurements that can be used to help constrain pulsar emission mechanisms (Malofeev & Malov Reference Malofeev and Malov1980; Lorimer et al. Reference Lorimer, Yates, Lyne and Gould1995; Karastergiou et al. Reference Karastergiou2015) and derive the pulsar luminosity function, and hence Galactic pulsar birth rate (Lorimer et al. Reference Lorimer, Bailes, Dewey and Harrison1993). Separately, interferometry can be used to determine accurate positions (and eventually proper motions and parallaxes) for pulsars (e.g., Chatterjee et al. Reference Chatterjee2009; Deller et al. Reference Deller, Tingay, Bailes and Reynolds2009, Reference Deller, Alef, Bernhart and Nothnagel2011, Reference Deller2016) to aid or augment pulsar timing (e.g., Gaensler et al. Reference Gaensler, Brazier, Manchester, Johnston and Green1999; Lorimer & Kramer Reference Lorimer and Kramer2012).
Pulsars have been observed across the entire electromagnetic spectrum, from frequencies as low as 10 MHz (Hassall et al. Reference Hassall2012) up to 1.5 TeV (Ansoldi et al. Reference Ansoldi2016). At radio frequencies, the spectral behaviour of the majority of pulsars can be described by a power law of the form S ν∝να, where α is the spectral index and S ν is the flux density at frequency ν (Lorimer et al. Reference Lorimer, Yates, Lyne and Gould1995). Pulsars typically have steep spectra with the mean spectral index of non-recycled pulsars around α = −1.6 (e.g. Sieber Reference Sieber1973; Lorimer et al. Reference Lorimer, Yates, Lyne and Gould1995) and millisecond pulsars (MSPs) around α = −1.8 (e.g., Kramer et al. Reference Kramer, Lange, Lorimer, Backer, Xilouris, Jessner and Wielebinski1999; Maron et al. Reference Maron, Kijak, Kramer and Wielebinski2000). Simulations by Bates, Lorimer, & Verbiest (Reference Bates, Lorimer and Verbiest2013) that take into account selection biases present in the distributions of known pulsars show the underlying spectral index is likely to be α ≈ −1.4.
Typical single-dish pulsar observations can have poor flux calibration (as bad as ~ 50%) due to an absence of reliable calibration sources, unknown positions in primary beams (at least initially), and the difficulties in calibrating single-dish telescopes (see O’Neil Reference O’Neil, Stanimirovic, Altschuler, Goldsmith and Salter2002; Lorimer & Kramer Reference Lorimer and Kramer2012). Even observations with arrays that have been coherently beamformed can have poor flux calibration, since calibration relies on modelling and characterising the performance across the fields-of-view and over time, often without the ability to verify and track the performance during the science observation. These issues are discussed by, for example, Bilous et al. (Reference Bilous2016). In contrast, imaging observations can be less sensitive (limited both by confusion, and also by the duty cycle of the pulsations) but can be calibrated very robustly through simultaneous observations of hundreds or thousands of sources.
Only a small fraction of radio detected pulsars have had their continuum flux densities measured across a range of frequencies; for example, in the ATNF Pulsar Catalogue, 1919 out of 2573 sources have zero or one radio continuum flux density measurements listed. Low-frequency observations of pulsars are important for investigating their spectral indices, and in particular in determining the frequency of their spectral turnovers. Spectral turnovers have been observed in a small number of sources at frequencies below 400 MHz (e.g., Sieber Reference Sieber1973; Ellingson et al. Reference Ellingson, Clarke, Craig, Hicks, Lazio, Taylor, Wilson and Wolfe2013) and in roughly 10% of pulsars in total (Maron et al. Reference Maron, Kijak, Kramer and Wielebinski2000). The cause of spectral turnovers is not known, but it is thought to be either synchrotron self-absorption in the emission region, or thermal absorption by a gas cloud in the line of sight to a pulsar (Sieber Reference Sieber1973). One of the aims of a low-frequency study of pulsars is to collect a larger sample of sources that exhibit spectral turnovers and hence help address this question by relating the presence of turnovers to other intrinsic or extrinsic parameters.
With good spectral coverage, continuum observations of pulsars can be used for modelling pulsar emission mechanisms, and studying the statistical properties of pulsar populations in a way that is independent of their time-varying properties, such as period and dispersion measure (Lorimer et al. Reference Lorimer, Yates, Lyne and Gould1995). Continuum observations have the advantage that they are less susceptible to interstellar propagation effects (dispersion and scattering) that smear out the emission over the pulse phase. The reliability of flux density measurements can be adversely affected by interstellar scintillation, which is very strong at low frequencies (Rickett Reference Rickett1977; Bhat et al. Reference Bhat2014). However, for most pulsars, the scintillation bandwidth will be much smaller than our observation bandwidth, so that the scintillation will saturate: Only for the nearest pulsars will a finite number of scintles cause significant variability (Bell et al. Reference Bell2016).
Low-frequency continuum studies of pulsars have been conducted by a number of groups. Kouwenhoven (Reference Kouwenhoven2000) measured Westerbork Northern Sky Survey (WENSS) 325-MHz flux densities for 39 pulsars, and Kuniyoshi et al. (Reference Kuniyoshi, Verbiest, Lee, Adebahr, Kramer and Noutsos2015) provide 74-MHz VLA Low Frequency Sky Survey, redux (VLSSr; Lane et al. Reference Lane, Cotton, van Velzen, Clarke, Kassim, Helmboldt, Lazio and Cohen2014) and 325-MHz WENSS flux densities for 10 MSPs detected in the VLSSr. Kaplan et al. (Reference Kaplan, Cordes, Condon and Djorgovski2000) reported 365-MHz flux densities for six pulsars in the Texas survey catalogues (Douglas et al. Reference Douglas, Bash, Bozyan, Torrence and Wolfe1996). Two recent LOw-Frequency ARray (LOFAR; van Haarlem et al. Reference van Haarlem2013) projects have measured low-frequency fluxes for 158 non-recycled (or normal) pulsars (Bilous et al. Reference Bilous2016) and 48 MSPs (Kondratiev et al. Reference Kondratiev2016). Most recently, Frail et al. (Reference Frail, Jagannathan, Mooley and Intema2016) made 150-MHz measurements of 200 known pulsars using data from the reprocessed GMRT Sky Survey (TGSS ADR; Intema et al. Reference Intema, Jagannathan, Mooley and Frail2017). In this paper, we present Murchison Widefield Array (MWA) observations of 60 pulsars at frequencies between 72 and 231 MHz.
2 OBSERVATIONS AND DATA REDUCTION
2.1. Observations
The MWA (Tingay et al. Reference Tingay2013) is a 128-tile low-frequency radio interferometer located in Western Australia. One of the major MWA projects is the GaLactic and Extragalactic All-sky MWA survey (GLEAM; Wayth et al. Reference Wayth2015). GLEAM is a survey of the radio sky south of declination + 30° at frequencies between 72 and 231 MHz, conducted between 2013 June and 2014 July. The survey was performed using five instantaneous observing bandwidths of 30.72 MHz, with each band observing the same part of the sky for an integration time of ~ 2 min. The observing bands were further sub-divided into four sub-bands with bandwidths of 7.68 MHz during processing. Hence, the GLEAM survey reports 20 flux density measurements between 72 and 231 MHz.
Note that although the entire sky was imaged in the GLEAM survey, the first major GLEAM catalogue release (Hurley-Walker et al. Reference Hurley-Walker2017) excludes the Galactic plane region (|b| < 10°). However, in this work, we measure flux densities directly from the survey images and hence cover the whole δ < 30° sky.
2.2. Data reduction
The data reduction process that was performed is discussed in detail by Hurley-Walker et al. (Reference Hurley-Walker2017). In summary, the raw visibility data from the MWA observations were processed by Cotter (Offringa et al. Reference Offringa2015) and radio frequency interference (RFI) was excised using the AOflagger algorithm (Offringa, van de Gronde, & Roerdink Reference Offringa, van de Gronde and Roerdink2012). For the five instantaneous observing bandwidths of 30.72 MHz, an initial model of the sky was used to apply initial amplitude and phase calibration solutions. Imaging was performed using WSClean (Offringa et al. Reference Offringa2014), with a ‘robust’ parameter of − 1.0 (close to uniform weighting). Uniform weighting weights the visibilities in inverse proportion to the sampling density function. This has the effect of minimising the sidelobe level and hence minimises contamination from diffuse structure and to aid in easily identifying unresolved sources, such as pulsars. Multi-frequency synthesis was applied across the instantaneous bandwidth for each snapshot observation, and cleaned (Högbom Reference Högbom1974) to the first negative clean component. The observations were then divided into four 7.68-MHz sub-bands and jointly cleaned, resulting in an rms of ~ 250 to ~ 50 mJy beam−1 for 72 to 231 MHz, respectively. The 7.68-MHz sub-band images were then put through a self-calibration loop, using the initial calibrator images to ensure position and flux density consistency and stability.
An initial flux density scale for the images was then set using the Molonglo Reference Catalogue (MRC; Large et al. Reference Large, Mills, Little, Crawford and Sutton1981; Large, Cram, & Burgess Reference Large, Cram and Burgess1991), scaled to the respective frequency, and an astrometric correction was applied using the sources referenced in MRC. The snapshots for an observed declination strip were mosaicked, with each snapshot weighted by the square of the primary beam response. Any residual declination dependence of the flux density scale in the mosaics, due to uncertainties in the primary beam model, was corrected using the VLSSr, MRC, and NRAO VLA Sky Survey (NVSS; Condon et al. Reference Condon, Cotton, Greisen, Yin, Perley, Taylor and Broderick1998) catalogues. We estimate that the flux density calibration is accurate to 8% for sources with |b| > 10° and up to 20% for sources with |b| < 10°.
A deep wide-band image covering 170–231 MHz was formed for each mosaic. The deep wide-band image provides a higher signal-to-noise ratio and more accurate source positions than what can be attained for a single 7.68-MHz sub-band image. The Background And Noise Estimator (bane) Footnote 1 was used to measure the background and noise properties of the deep wide-band images. bane estimates the background and noise of an image as the median and standard deviation of the pixel distribution over a sliding window. Calculating the background and noise properties in this way is biased by the presence of sources. bane mitigates this bias via sigma clipping of the pixel distribution (3 rounds of 3σ). bane creates maps of the sky of the same dimensions as the input image, with each pixel representing either the background or noise level at a given location. The background and noise maps were then passed to the source finding and characterisation program Aegean v1.9.6 (Hancock et al. Reference Hancock, Murphy, Gaensler, Hopkins and Curran2012) to form a reference catalogue. The positions of the sources in the reference catalogue were then convolved with the appropriate synthesised beam at each sub-band frequency to characterise the flux density of the sources in each of the 20 sub-band images.
2.3. Sample Selection
We selected all sources from the ATNF pulsar catalogue v1.54 (Manchester et al. Reference Manchester, Hobbs, Teoh and Hobbs2005) that fell within the observed GLEAM region of δ < +30°. We excluded globular cluster pulsars, and those with a positional uncertainty of greater than 1 arcmin. This left a sample of 1996 sources. We then searched the GLEAM 170–231 MHz mosaics for 3σ detections within 2 arcmin of the positions of these sources. We manually inspected postage stamp images of the potential detections, ruling out artefacts and coincident extragalactic sources based on their visual morphology. We also ruled out sources with existing non-pulsar identifications in SIMBAD or the NASA/IPAC Extragalactic Database.
This resulted in a sample of 60 sources with GLEAM detections, as shown in Figure 1. Using a definition of MSPs as having spin periods of P < 30 ms and spin-down rates of
 $\dot{P} <1\times 10^{-16}$
s s−1, six sources in our sample are MSPs and 53 are normal pulsars. One source, PSR J1810 + 1744, has an unknown spin-down rate, but its spin period of 0.00166 s indicates it is an MSP. For each of these candidate sources, we measured the flux density at the position of the pulsar using the source finding package Aegean v1.9.6 (Hancock et al. Reference Hancock, Murphy, Gaensler, Hopkins and Curran2012). The measured MWA positions agreed well with the positions in the ATNF pulsar catalogue; the mean position offsets are
$\dot{P} <1\times 10^{-16}$
s s−1, six sources in our sample are MSPs and 53 are normal pulsars. One source, PSR J1810 + 1744, has an unknown spin-down rate, but its spin period of 0.00166 s indicates it is an MSP. For each of these candidate sources, we measured the flux density at the position of the pulsar using the source finding package Aegean v1.9.6 (Hancock et al. Reference Hancock, Murphy, Gaensler, Hopkins and Curran2012). The measured MWA positions agreed well with the positions in the ATNF pulsar catalogue; the mean position offsets are
 $\Delta \alpha = 13\text{\,arcsec}$
,
$\Delta \alpha = 13\text{\,arcsec}$
,
 $\Delta \delta = 9\text{\,arcsec}$
.
$\Delta \delta = 9\text{\,arcsec}$
.

Figure 1.
Left: Distribution of all known pulsars from the ATNF pulsar catalogue (light grey dots); the pulsars observable by GLEAM (dark grey dots) and the pulsars detected in GLEAM and presented in this paper: millisecond pulsars are shown as yellow squares, and non-recycled pulsars as red circles. The Galactic plane, where most known pulsars lie, is clearly visible. Right: Distribution of all known pulsars (pale grey dots) and detected pulsars on the
 $P\text{--}\dot{P}$
diagram. Pulsars with an unknown
$P\text{--}\dot{P}$
diagram. Pulsars with an unknown
 $\dot{P}$
but with P < 0.01 s are plotted at
$\dot{P}$
but with P < 0.01 s are plotted at
 $\dot{P} = 10^{-21}$
s s−1 (this includes PSR J1810 + 1744). We also show contours of constant dipole magnetic field and spin-down age, as labelled.
$\dot{P} = 10^{-21}$
s s−1 (this includes PSR J1810 + 1744). We also show contours of constant dipole magnetic field and spin-down age, as labelled.
2.4. False detection rate
It is possible that some of the matches with ATNF pulsar positions are due to chance coincidences. To estimate what fraction this might be, we can consider the areal density of sources in the GLEAM catalogue. The GLEAM catalogue has 304 894 sources over an area of 24 402 deg2, or ~ 12 sources per deg2. Therefore, any given pulsar has a 3% chance of being matched with a background source by chance coincidence. This implies that out of the detections we made, it is possible that
 $1\text{--}2$
of them are false positives.
$1\text{--}2$
of them are false positives.
The actual coincident source rate could be somewhat higher than this, since we searched to a lower flux density cutoff than the published GLEAM catalogue, and we also searched in the Galactic plane where the source density is higher. However, we expect the false detection rate to be of order a few sources.
3 Results and Discussion
We fit and parameterised each of the 60 detected sources in the GLEAM-averaged mosaics (centred on 200 MHz) using Aegean’s priorisedFootnote 2 fitting option. The distribution of measured flux densities is shown in Figure 2. We then fit a source at the same position in each of the 20 × 8 MHz sub-band images. We measured flux densities in each sub-band image if there was a detection above 3σ. We excluded sources that were obviously extended (by visual inspection), and so were able to fit each source with a point source model.

Figure 2. Distribution of GLEAM 200-MHz flux density measurements for the 60 sources in our sample.
3.1. Comparison with the literature
Fifteen of the sources in our sample have a detection in either the VLSS (Cohen et al. Reference Cohen, Lane, Cotton, Kassim, Lazio, Perley, Condon and Erickson2007; Lane et al. Reference Lane, Cotton, van Velzen, Clarke, Kassim, Helmboldt, Lazio and Cohen2014), LOFAR (Bilous et al. Reference Bilous2016), Slee (Reference Slee1995) or Malofeev, Malov, & Shchegoleva (Reference Malofeev, Malov and Shchegoleva2000) surveys.
The Bilous et al. (Reference Bilous2016) LOFAR census provides a good comparison as the mean frequency of the LOFAR High-Band Antennas (HBA) is 149 MHz, which aligns well with our GLEAM sub-band centred on 151 MHz. The Bilous et al. (Reference Bilous2016) flux densities were measured from the single best observation (each observation covered at least 1000 spin periods), and their comparisons with LOFAR imaging observations suggest there may be up to 40% difference between the flux densities obtained through these different methods. The agreement to our data is roughly within these limits.
Four of our sources are in the Bilous et al. (Reference Bilous2016) sample:
-
• J0826+2637 (B0823+26) has an MWA 151-MHz flux density of 365 ± 48 mJy. The LOFAR 149-MHz flux density is somewhat higher at 522 ± 261mJy, but still agrees within the stated errors of both surveys.
-
• J1136+1551 (B1133+16) has an MWA 151-MHz flux density of 1057 ± 49 mJy, which agrees well with the LOFAR 149-MHz flux density of 935 ± 467 mJy.
-
• J1543+0929 (B1541+09) has an MWA 151-MHz flux density of 371 ± 45 mJy, which is substantially lower than the LOFAR 149-MHz flux density of 768 ± 384 mJy, although still within the reported uncertainty of the LOFAR measurement.
We do not have a reliable sub-band flux density measurement for J1932+1059 (B1929+10) but our 200-MHz averaged band measurement agrees reasonably well with existing literature measurements, including LOFAR (see the plot in Figure 3). Inspection of the spectral energy distribution suggests our MWA results are overall in good agreement with the rest of the literature measurements, for example the TGSS ADR1 150-MHz flux density is 368 ± 41 mJy.


Figure 3.
Spectral energy distributions for non-recycled pulsars in our sample. New measurements from this work are in black. Flux density measurements from the literature are coloured according to the caption, with specific references given in Table 1. The dashed lines show the best-fit power law (or broken power law) as discussed in the text. PSR J0828 − 3417 had too few points to be fit.
In addition, three of our MSPs are in the Kondratiev et al. (Reference Kondratiev2016) sample, which presents flux densities, also averaged over the 110–188 MHz band (centred on 149 MHz). Note that the errors quoted in Table 4 of Kondratiev et al. (Reference Kondratiev2016) are much smaller than the actual estimated errors of 50%, so for this comparison we have assumed 50% errors on the LOFAR flux densities:
-
• J0034−0534 has an MWA 151-MHz flux density of 394 ± 24 mJy which agrees with the LOFAR 149-MHz flux density of 491 ± 245 mJy.
-
• J0737−3039A has an MWA 200-MHz flux density of 53 ± 8 mJy and an MWA 143-MHz flux density of 89 ± 25 mJy, both of which agree with the LOFAR 149-MHz flux density of 64 ± 32 mJy.
-
• J1810+1744 has an MWA 151-MHz flux density of 320 ± 102 mJy which agrees within the errors with the LOFAR 149-MHz flux density of 563 ± 282 mJy.
3.2. Spectral energy distributions
In Figures 3 and 4, we present spectral energy distributions (SEDs) for each of the normal and MSPs in our sample, respectively. Where it was possible to measure sub-band flux densities with greater than 3σ significance, we have included the individual sub-band flux densities in the SEDs (for example, PSR J0034 − 0721). In other cases, the sub-band measurements were either below the noise, or we excluded them due to calibration issues with Galactic plane data (for example, PSR J0630 − 2834). In these cases, we only included the 200-MHz flux density measured from the 170–231 MHz mosaics.

Figure 4. Spectral energy distributions for millisecond pulsars in our sample. PSR J0437 − 4715 could not be fit by a single or broken power law, and is known to be highly variable due to scintillation.
It is important to note that the literature fluxes come from many different projects, with different observational setups. In addition, low-frequency flux density measurements are more affected by scintillation than higher frequency measurements, and pulsars can also be intrinsically variable. As a result, fluxes measured by different groups at different times may vary by an order of magnitude. We have excluded two sets of recent measurements (Stovall et al. Reference Stovall2015; Frail et al. Reference Frail, Jagannathan, Mooley and Intema2016) from our fits (but included them in the SEDs) as the flux calibration requires further investigation.Footnote 3
We fit each of our pulsar spectral energy distributions with both a single power law of the form:
 $$\begin{equation}
S_{\nu } = S_{\nu _0} \left( \frac{\nu }{\nu _0} \right)^\alpha ,
\end{equation}$$
$$\begin{equation}
S_{\nu } = S_{\nu _0} \left( \frac{\nu }{\nu _0} \right)^\alpha ,
\end{equation}$$
where α is the spectral index, and S ν0 is the flux density at a reference frequency ν0; and a broken power law of the form:
 $$\begin{equation}
S_{\nu } = \left\lbrace \begin{array}{@{}l@{\quad }l@{}}S_{\nu _0} \left( \frac{\nu }{\nu _0} \right)^{\alpha _{\rm lo}} &\text{if}\; \nu < \nu _{\rm br} \\
S_{\nu _0} \left( \frac{\nu _{\rm br}}{\nu _0} \right)^{\alpha _{\rm lo}} \left( \frac{\nu }{\nu _{\rm br}\ } \right)^{\alpha _{\rm hi}} &\text{if}\; \nu > \nu _{\rm br}
\end{array}\right.,
\end{equation}$$
$$\begin{equation}
S_{\nu } = \left\lbrace \begin{array}{@{}l@{\quad }l@{}}S_{\nu _0} \left( \frac{\nu }{\nu _0} \right)^{\alpha _{\rm lo}} &\text{if}\; \nu < \nu _{\rm br} \\
S_{\nu _0} \left( \frac{\nu _{\rm br}}{\nu _0} \right)^{\alpha _{\rm lo}} \left( \frac{\nu }{\nu _{\rm br}\ } \right)^{\alpha _{\rm hi}} &\text{if}\; \nu > \nu _{\rm br}
\end{array}\right.,
\end{equation}$$
where νbr is the break frequency, and αlo and αhi are the spectral indices below and above that break frequency, respectively.
Model fits to the SEDs were conducted using a nonlinear least-squares routine that applied the Levenberg–Marquardt algorithm, an iterative procedure that linearises the function at each step based on a new estimate of the function from the gradient of the previous step. The fitting routine produced a covariance matrix with which 1σ uncertainties on the parameters were taken to be the square root of the diagonal terms. In the fitting procedure, the uncertainties on the data points were assumed to be independent and Gaussian. Initial conditions for the broken power-law fits were selected by random sampling using a Monte Carlo simulation. In cases where there were not enough data points to support a broken power-law fit, we chose a single power law. In cases where the reduced χ2 suggested a broken power-law fit was preferred, we ran an F-test and rejected the null hypothesis for probability P < 0.01.
We found that 28 of the pulsars in our sample could be fit by a single power law. The distribution of spectral indices from these fits is shown in Figure 5. The individual fits are shown by the dashed lines in Figures 3 and 4, and the spectral indices derived from these fits are listed in Tables 1 and 2. 30 of the remaining sources were fit by a broken power law, and the results from these fits are given in Table 3. We note that some of these sources show signs of a spectral turnover, whereas others have a clear spectral break. The flux density measurements for each GLEAM sub-band are given in Table 4.

Figure 5. Distribution of spectral indices for sources for which the SEDs were fit by a single power law. The dark grey shading shows the millisecond pulsars.
Table 1. Flux density measurements and spectral indices for the non-recycled pulsars in our sample.

The flux density at 200 MHz (S 200) is measured from mosaics that are averaged across the full 72–231 MHz bandwidth. Sources identified as variable by Bell et al. (Reference Bell2016) are marked with (v). See Table 3 for sources with broken power-law fits (listed as ‘2pl’ in this table). N p is the number of measurements included in the fit. Full SEDs are given in Table 4. Note that Stovall et al. (Reference Stovall2015) and Frail et al. (Reference Frail, Jagannathan, Mooley and Intema2016) measurements were not included in our fits, as discussed in the text. References: B95 (Becker, White, & Helfand Reference Becker, White and Helfand1995), Be16 (Bell et al. Reference Bell2016), B16 (Bilous et al. Reference Bilous2016), Bh16 (Bhattacharyya et al. Reference Bhattacharyya2016), C07 (Cohen et al. Reference Cohen, Lane, Cotton, Kassim, Lazio, Perley, Condon and Erickson2007), C98 (Condon et al. Reference Condon, Cotton, Greisen, Yin, Perley, Taylor and Broderick1998), D96 (Douglas et al. Reference Douglas, Bash, Bozyan, Torrence and Wolfe1996), D02 (De Breuck et al. Reference De Breuck, Tang, de Bruyn, Röttgering and van Breugel2002), D15 (Dai et al. Reference Dai2015), F16 (Frail et al. Reference Frail, Jagannathan, Mooley and Intema2016), G93 (Griffith & Wright Reference Griffith and Wright1993), G98 (Gould & Lyne Reference Gould and Lyne1998), H92 (Helfand et al. Reference Helfand, Zoonematkermani, Becker and White1992), H11 (Hessels et al. Reference Hessels, Burgay, D’Amico, Esposito, Pellizzoni and Possenti2011), H04 (Hobbs et al. Reference Hobbs2004), H14 (Hurley-Walker et al. Reference Hurley-Walker2014), I16 (Intema et al. Reference Intema, Jagannathan, Mooley and Frail2017), J93 (Johnston et al. Reference Johnston1993), J05 (Johnston et al. Reference Johnston, Hobbs, Vigeland, Kramer, Weisberg and Lyne2005), J15 (Johnston, pc), J17 (Jankowski et al. 2017, in prep), K11 (Keith et al. Reference Keith, Johnston, Levin and Bailes2011), K15 (Kuniyoshi et al. Reference Kuniyoshi, Verbiest, Lee, Adebahr, Kramer and Noutsos2015), K16 (Kondratiev et al. Reference Kondratiev2016), L14 (Lane et al. Reference Lane, Cotton, van Velzen, Clarke, Kassim, Helmboldt, Lazio and Cohen2014), L95 (Lorimer et al. Reference Lorimer, Yates, Lyne and Gould1995), L98 (Lyne et al. Reference Lyne1998), M78 (Manchester et al. Reference Manchester, Lyne, Taylor, Durdin, Large and Little1978), M96 (McConnell et al. Reference McConnell, Ables, Bailes and Erickson1996), M00 (Malofeev et al. Reference Malofeev, Malov and Shchegoleva2000), M03 (Mauch et al. Reference Mauch, Murphy, Buttery, Curran, Hunstead, Piestrzynski, Robertson and Sadler2003), M07 (Murphy et al. Reference Murphy, Mauch, Green, Hunstead, Piestrzynska, Kels and Sztajer2007), M13 (Manchester et al. Reference Manchester2013), N04 (Nord et al. Reference Nord, Lazio, Kassim, Hyman, LaRosa, Brogan and Duric2004), N08 (Noutsos et al. Reference Noutsos, Johnston, Kramer and Karastergiou2008), R97 (Ramachandran et al. Reference Ramachandran, Mitra, Deshpande, McConnell and Ables1997), R10 (Renaud et al. Reference Renaud, Marandon, Gotthelf, Rodriguez, Terrier, Mattana, Lebrun, Tomsick and Manchester2010), S95 (Slee Reference Slee1995), Se95 (Seiradakis et al. Reference Seiradakis, Gil, Graham, Jessner, Kramer, Malofeev, Sieber and Wielebinski1995), T93 (Taylor, Manchester, & Lyne Reference Taylor, Manchester and Lyne1993), T98 (Toscano et al. Reference Toscano, Bailes, Manchester and Sandhu1998), Z13 (Zakharenko et al. Reference Zakharenko2013).
Table 2. Flux density measurements and spectral indices for millisecond pulsars in our sample.

The flux density at 200 MHz (S 200) is measured from mosaics that are averaged across the full 72–231 MHz bandwidth. Sources identified as variable by Bell et al. (Reference Bell2016) are marked with (v). N p is the number of measurements included in the fits. The reference key is the same as for Table 1. Full SEDs are given in Table 4.
Table 3. Fit results for sources where the spectrum was modelled by a broken power law.

Table 4. MWA flux density measurements or 3σ limits for the first 15 sources in our sample.

The full table is available online, and in the online version limits are marked with an L in the error columns.
One source (PSR J0828−3417) has too few points to be fit. Another source (PSR J0437−4715) could not be fit by either a single or broken power law. This source is known to scintillate (Bell et al. Reference Bell2016) and is discussed further in Section 3.4. The GLEAM sub-band points show this clearly, with significant changes in the flux density between neighbouring bands. The GLEAM observations cycle through each of the five major frequency bands, and so the observations at different frequencies are not simultaneous. This variability means the SED cannot be well fit.
PSR J0942−5657 is not fit well due to several points with higher than expected flux densities at low frequencies. This could be due to the low-frequency measurement, which is at relatively low resolution, picking up diffuse emission from a surrounding supernovae remnant or pulsar wind nebula. It is not possible to disentangle these factors with the MWA continuum data alone.
Currently, our sample is too small to see if the spectral indices we measure here correlate with any intrinsic parameters of the pulsars (such as spin-period, spin-down age, dipole magnetic field, energy-loss rate), but we expect that with deeper surveys in the near-future, we can increase the number of pulsars significantly (see Section 4) and will be more sensitive to population-wide trends.
Previous work has shown that approximately 10% of pulsars cannot be fit by a single power law (Maron et al. Reference Maron, Kijak, Kramer and Wielebinski2000). We found a substantially higher fraction than this (30/58 = 52%). The higher percentage is probably due to our sample being able to detect sources with low-frequency spectral breaks. The distribution of spectral break frequencies for pulsars that were fit by a broken power law is shown in Figure 6: 23 of our sources have v br ≲ 400 MHz. The sources with spectral breaks do not have any obvious intrinsic parameter that would select for this property.
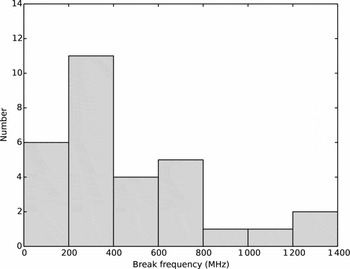
Figure 6. The distribution of spectral break frequencies for pulsars that were fit by a broken power law.
3.3. Detected population
Our survey will generally detect pulsars with high flux densities, which are likely to be closer, and hence have lower dispersion measures. This is demonstrated in Figure 7, which shows the pulsars we detect typically have lower dispersion measures than the overall distribution.

Figure 7. Histogram of dispersion measures of all known pulsars in the GLEAM region (top panel) and the pulsars we detected (bottom panel).
There are 391 known pulsars that fall in the GLEAM survey region and have a flux density measurement at both 400 MHz (S 400) and 1.4 GHz (S 1400) listed in the ATNF pulsar catalogue. The distribution of spectral index, α1400 400, for these pulsars is shown in the top panel of Figure 8. The mean spectral index of this distribution is − 1.8 ± 0.7. The distribution of spectral indices for the subset of these that we detected is shown in the bottom panel of Figure 8. This distribution has a mean spectral index of − 2.0 ± 0.5, which is steeper than the mean reported in the literature of ≈ −1.6 (Lorimer et al. Reference Lorimer, Yates, Lyne and Gould1995). This is expected given that our sample is selected based on detection at low frequency, which should prefer steep spectrum sources.

Figure 8. Histogram of the spectral index α1400 400 measured between the ATNF catalogue listed values for S 400 and S 1400 of all known pulsars in the GLEAM region (top panel) and for the pulsars we detected (bottom panel).
To compare our detections rate with what would be expected at low frequencies, we used the S 400 and S 1400 flux densities from the ATNF pulsar catalogue (where available) to predict the 200-MHz flux density. In cases for which there was only a S 1400 flux density, we assumed a spectral index of − 1.8 (the median of the spectral index distribution). From these, we were able to predict a 200-MHz flux density for 1559 pulsars in the GLEAM survey region. We considered a source detectable if it has a predicted flux density of 3σ = 45 mJy beam−1 (based on the mean rms noise in the region of these pulsars of 15 mJy beam−1). With these limits, we predicted that 61 sources would be detectable, which is extremely close to the number we detected: 60.
Using the ATNF pulsar catalogue flux densities and derived spectral indices, we also looked at whether there were specific pulsars we would have expected to detect but did not. There are 38 sources with a predicted S 200 > 45 mJy beam−1 that were not in the sample of detected pulsars presented in this paper. Most of the non-detections near our limit were likely to be due to higher than average local rms noise, so we only considered sources above a 5σ threshold of 75 mJy beam−1, leaving 19 sources. We visually inspected the GLEAM maps at the positions of all of these sources and found that either (i) the sources were detected, but had been excluded from our sample due because they were part of an extended structure or diffuse emission; or (ii) the sources had not been detected and were in a region of higher than average noise, or in a negative bowl caused by imaging Galactic plane emission.
3.4. Variability
Pulsars are known to exhibit variability, particularly at low frequencies when the effects of interstellar scintillation are stronger. In a related project (Bell et al. Reference Bell2016), we identified four pulsars that showed significant variability over timescales of minutes to months: PSR J0034−0721, PSR J0437−4715, PSR J0630−2834, and PSR J0953 + 0755. These are identified with a (v) in Tables 1 and 2. The last three of these four show high levels of scatter in their SEDs, in particular PSR J0953 + 0755.
Some pulsars also have significant intrinsic variability, which can also complicate broad-band SED measurement from non-contemporaneous images. As an example, we show the intermittent pulsar PSR J0828−3417, which has a reported duty cycle of 70% (Durdin et al. Reference Durdin, Large, Little, Manchester, Lyne and Taylor1979; Biggs et al. Reference Biggs, McCulloch, Hamilton, Manchester and Lyne1985). PSR J0828−3417 switches between a strong mode and a weak mode with a typical timescales of hours (Esamdin et al. Reference Esamdin, Abdurixit, Manchester and Niu2012). This pulsar was detected in the GLEAM images, although we only report a 200-MHz flux density, which is significantly above the other measurements. To demonstrate that we have in fact measured the pulsar, we show in Figure 9 two individual 154-MHz MWA images (from the MWA Transients Survey; PI Bell) centred on the position of PSR J0828−3417. In the first image (on the left), there is no detection of the source. In the second image, taken 6 min later, there is a clear detection with a measured flux density of 92 mJy beam−1.

Figure 9. 154-MHz images of PSR J0828−3417 in its off (left) and on (right) states in two images from the MWA Transients Survey (MWATS; PI Bell). The two images are separated by 6 min: the image on the left was observed at 2016-02-01 15:53:36 UTC, and the image on the right was observed at 2016-02-01 15:59:36 UTC.
4 CONCLUSIONS
We have presented new low-frequency flux density measurements for 60 pulsars from the ATNF pulsar catalogue. Our flux density measurements agree well with those previously reported in the literature, and we find a median spectral index of − 1.8 for the sources we detected.
Our analysis used data from the first year of the GLEAM survey, as discussed in Wayth et al. (Reference Wayth2015) and Hurley-Walker et al. (Reference Hurley-Walker2017). We used images that were processed to optimise the high-latitude (|b| > 10°) sky, so deconvolution of extended Galactic emission was not ideal. Processing to probe more deeply into the Galactic plane is ongoing and should be released later this year, improving measurements of pulsars at low latitudes. Processing of a second year of the GLEAM survey is also ongoing, which will allow searches for variability on timescales longer than those probed by Bell et al. (Reference Bell2016).
Separately, our identification of pulsars was largely limited by the sensitivity of the survey, which is itself limited by confusion (Franzen et al. Reference Franzen2016). The MWA has recently been upgraded to enable imaging with roughly double the current maximum baseline, up to ≈ 5 km. This will result in a factor of 2 smaller full width at half maximum (FWHM) of the point-spread function which will reduce the confusion level by a factor of ~ 5 (Franzen et al. Reference Franzen2016). Based on extrapolating the S 400 and S 1400 measurements from the ATNF pulsar catalogue, we predict that reducing the image confusion noise by a factor of 5 will increase the number of pulsars detected to approximately 200. Not only will this allow a better examination of the overall population, but it will allow more robust testing for correlations between the measured parameters and the intrinsic spin parameters of the pulsars.
ACKNOWLEDGEMENTS
We thank Fabian Jankowski for providing his ATCA flux density measurements ahead of publication. This scientific work makes use of the Murchison Radio-astronomy Observatory, operated by CSIRO. We acknowledge the Wajarri Yamatji people as the traditional owners of the Observatory site. Support for the operation of the MWA is provided by the Australian Government Department of Industry and Science and Department of Education (National Collaborative Research Infrastructure Strategy: NCRIS), under a contract to Curtin University administered by Astronomy Australia Limited. We acknowledge the iVEC Petabyte Data Store and the Initiative in Innovative Computing and the CUDA Center for Excellence sponsored by NVIDIA at Harvard University. DLK and SDC are additionally supported by NSF grant AST-1412421.
This research has made use of the NASA/IPAC Extragalactic Database (NED), which is operated by the Jet Propulsion Laboratory, California Institute of Technology, under contract with the National Aeronautics and Space Administration. It has also made use of the SIMBAD database, operated at CDS, Strasbourg, France.


