


Introduction
Tracking the career steps of business proprietors offers important insights for business entry and exit, and the factors influencing those career decisions. Usually historical research on proprietors’ careers has been restricted by archival records to a few individuals, local case studies, or large firms. Often it is trapped into focusing on “great men” and other forms of selection bias. The situation has changed with the release of large-scale digital historical records. In Britain the manuscript nineteenth-century population census is now available in I-CeM (Schürer and Higgs Reference Schürer and Edward2014). The I-CeM-linked database of the British Business Census of Entrepreneurs (BBCE) codes those identifiable as business proprietors (Bennett et al. Reference Bennett, Harry, Carry, Piero and Gill2019a, Reference Bennett, Harry, Carry, Piero and Gill2020).Footnote 1 These data are used to give the first large-scale study tracking career changes of British business proprietors using whole-population intercensus record-linkage. This allows inclusion of proprietors of all sizes of business, from the largest to the most humble, who formed the overwhelming majority and who have often been ignored, for women as well as men, and for all social groups and industries. Having the manuscript census data also overcomes the criticisms of previous national-level census analyses that have had to use published tables (see Anderson Reference Anderson1999; Hatton and Bailey Reference Hatton and Bailey2001: 105; Higgs Reference Higgs2005: 63–71; Higgs and Wilkinson Reference Higgs and Amanda2016; You Reference You2020a): that the published census underrecorded women’s activities, and the extent of participation in business proprietorship was mostly never tabulated.
The analysis aims at a representative national whole-population overview by trying to link all identified proprietors in one census with adjacent census years. The linkages are then used to estimate continuities in proprietor status, as well as the scale and rate of switching into and out of proprietorship and how this can be explained. This allows exploration of questions about different life-stage choices for business entry and exit in different market conditions, responses to sector and local market opportunities, the role of family relationships, and comparison between male and female proprietorship life paths.
Proprietors are examined in two categories: employers and own account operators. Own account is the terminology used in British censuses for proprietors who employed no one else; together with employers this gives the population of self-employed businesspeople. Although constrained by 10-year census gaps, our analysis shows that proprietorship in the Victorian era was an accessible option for many, but was highly varied between sectors, with strong contrasts by sex.
The first section of the article introduces the theoretical background and previous literature, using interpretations from both historical and modern business studies. This provides a grounding for interpreting motives lying behind career choices. The following section describes the census data, its constraints, and how record-linkage was used. The main analysis then falls into two parts: first, to establish the scale and rate of business entry and exit; and second, to assess the main factors that explain it. The article is focusing on linkage at scale using whole-population linkage methods. This requires searches over the whole England and Wales population each year, which range from 17.5 million people in 1851 to 26 million in 1881. As a result it is infeasible to check all records clerically, though the results of small-scale clerical checks are quoted. The record-linked database is available as an open access download (Montebruno and Bennett Reference Montebruno and Bennett2020a, b). The article covers England and Wales but can in future be extended to the Scottish BBCE digital records.
Theory and Previous Literature
Entry and exit to business proprietorship is a constrained choice between employment status alternatives. Our focus is between different forms of business organization: to operate as an own-account sole proprietor or to employ others, and to be a proprietor as distinct from being a waged employee. Self-employment without employees could be an attractive choice allowing independence, but as recognized by the ethnographic accounts by Samuel (Reference Samuel1975), the family studies by Davidoff (Reference Davidoff2012) and Anderson (Reference Anderson1971), and Payne’s (Reference Payne1988) overview, it was often associated with necessity and survival. However, taking employees into a business often marked a step to a larger and more sustained business, but could be more cumbersome and off-putting than operating alone because of increased burdens of management and loss of independence and control (Hannah Reference Hannah2014: 869; Lamoreaux Reference Lamoreaux1995: 43; Marshall Reference Marshall1891: 298–300; Pollard Reference Pollard1965: 153). Of course, such choices also interacted with opportunity, which was often constrained, by both supply and demand, with the result that waged employment was often preferred or the only option available. To interpret career developments we need to be able to interpret these historical choice decisions and the factors that influenced them.
Historical and Modern Understanding of Motivation
For historical analysis we have direct evidence from contemporaneous sources of motivations for the period under investigation. Marshall and Marshall (Reference Marshall and Marshall1879: 114–34) and Marshall (Reference Marshall1891), writing at the end of our period, directly observed the constrained choices of proprietorship through many visits to businesses. They argued that different types of proprietor operated under the same price and other signals, whether they were individual masters or employers, and hence they could be evaluated as responding to the same market challenges. Different opportunities arose in different sectors, offering differing scope for individuals depending on the level of specialization and rarity of the skills required (Marshall and Marshall Reference Marshall and Marshall1879: 116). Marshall (Reference Marshall1891: 285–9) also recognized what Chandler (Reference Chandler1962, Reference Chandler1990) later popularized, that the field for market entry and success for the individual master and small business was narrowing, especially in manufacturing, where economies of scale and the application of standardization and factory production normally gave increasing advantages to larger businesses. However, even by the twentieth century Marshall took a more nuanced view than Chandler: that small firms could continue to grow in many sectors, “Though the small producer is constantly threatened with extinction … yet he survives” and “the number of small businesses is constantly growing” (Marshall Reference Marshall1919: 247–8). Indeed, he argued that smaller firms and sole proprietorship had some countervailing advantages deriving from the strong oversight available to small proprietors—“the master’s eye is everywhere” (Marshall Reference Marshall1891: 284); as well as later recognizing that local external economies (“industrial districts”) could particularly benefit small firms (Marshall 1919: 271; Reference Marshall1920: 284–5; see also Wilson and Popp Reference Wilson and Andrew2003). Reflecting on this period, Knight (1921: 270) was one of the first to focus on this as a choice analysis: people’s choices balanced uncertainty against their personal characteristics and ability, personal and local opportunities, information available, and other factors. Those individuals favoring higher security generally prefer waged employment than face the challenges of running a business. Those favoring greater independence with its risks were more willing to become entrepreneurs.
Marshall and Marshall (Reference Marshall and Marshall1879: 120–8), Marshall (Reference Marshall1891: 614–15), and Knight (1921: 282–3) give a crucial theoretical basis as well as contemporary or near-contemporary interpretation of motivations in our historical period. They have also provided the main underpinnings of modern choice analysis so that we can interlink historical and modern interpretations (Aronson Reference Aronson1991; Parker Reference Parker2012: 107–20). Modern understanding at a scale equivalent to historical census coverage is mainly available in the Quarterly Labour Force Survey (QLFS), the largest UK-level fully representative survey. This shows the most frequent modern proprietorship motivations are internal (wanting better working conditions or more independence), which are nearly one-third of all responses, and combined with closely connected family reasons (commitments, joining the family firm) account for 45 percent of all responses (Dawson et al., Reference Dawson, Andrew and Paul2014). Opportunity (23 percent), the nature of the occupation (20 percent), and necessity (12 percent) are the remainder of QLFS motivation groups. Footnote 2
The same range of motives is expected to be important in historical analysis. Opportunity is particularly important for interpreting dynamics: the career steps to improve income through exploiting market openings, as well as the obverse of necessity (such as redundancy and unemployment) where self-employment is forced because of lack of other options as a survival strategy to meet family income needs (Anderson Reference Anderson1971; Davidoff Reference Davidoff2012; Samuel Reference Samuel1975). The nature of the occupation is also critical as sectors are a primary factor in career choices. Many fields historically, as now, could be pursued only, or mainly, through self-employment (Checkland Reference Checkland1964; Clapham Reference Clapham1932; Marshall Reference Marshall1891: 288–90; Payne Reference Payne1988): the vocations and professions (musicians, artists, lawyers, doctors, agents); many construction trades (such as joiners, plumbers, plasterers and bricklayers) were operated then, as now, by own-account individuals; much of retail and hospitality industries also had numerous own account traders (especially for women and widows running shops and inns: Davidoff Reference Davidoff and Davidoff1995; Garrett et al. Reference Garrett, Alice, Kevin and Simon2001; Kay Reference Kay2009); and many brokers and agents were also predominantly sole proprietors or partnerships.
In practice, motivations overlapped. All individuals historically were influenced by personal, family, and social conditions, which overlapped opportunity and necessity especially deriving from family commitments, and particularly for women (Anderson Reference Anderson1971; Davidoff and Hall Reference Davidoff and Catherine1997; Nenadic Reference Nenadic1991). By using family resources a firm could potentially reduce start-up and continuing running costs: using family labor, family capital, and networks (Anderson Reference Anderson1971; Colli Reference Colli2003; Marshall Reference Marshall1891: 298–300; Penrose Reference Penrose1959). Connections beyond the immediate family could also draw resources from distant relations, boarders, and wider social networks (Davidoff and Hall Reference Davidoff and Catherine1997; Owens Reference Owens2002). Prior experience could also be significant within, as well as outside a family firm, and should be shown in historical linkages. Experience could facilitate entry into any status and might follow a “ladder,” as suggested in some historical studies (Davidoff Reference Davidoff2012; Nenadic Reference Nenadic1991; Nenadic et al. Reference Nenadic, Morris, Smyth and Rainger1992), with “entry-level” sectors and types of entrepreneurship following stepping-stones from being waged, to own account, to taking on employees (Church Reference Church1993; Davidoff Reference Davidoff2012), which could be facilitated by following parents (Long Reference Long2013; Marshall Reference Marshall1891: 298–300). Such entry effects are also indicated in modern studies (e.g., Aronson Reference Aronson1991; Parker Reference Parker2012; van Der Zwan et al. Reference van Der Zwan Peter and Roy2011). However, historically Miles (Reference Miles1999), Mitch (Reference Mitch, Miles and Vincent1993), and Morris (Reference Morris2005) indicate that there were many constraints for entry into some walks of life, and this is confirmed by Marshall and Marshall’s (Reference Marshall and Marshall1879: 116–17) observations of market barriers to some sectors and occupations.
Career Choice from Intercensus Record-Linkage
For the historical record-linked census data here, we are interested in establishing how far switching occurred and assessing how it can be explained. Historical data are constrained of course, and information on one of the key incentive variables, wage rates, is not available for this period at sufficient scale or locational and sectoral detail. However, as shown in Crossick’s (Reference Crossick1978: 49–57) case study of 1851 Kentish London, wage differentials may not be crucial. Most own-account proprietors earned almost the same as workers, as well as skilled and semiskilled artisans.
In our analysis we can include most key internal motives. Previous historical research suggests a key role of sex, family, and other relationships in entry and exit from proprietorship that should be revealed in record-linked data. As already noted, the role of the family is well-established by Anderson (Reference Anderson1971, Reference Anderson1988) and Davidoff and Hall (Reference Davidoff and Catherine1997), among many others, who demonstrate family, fertility, kinship, intergenerational ties, and coresidence as key features of personal development in the nineteenth century, though referring to business roles primarily through classifications of social class. Large-scale census analyses also confirm the critical role of the family, but they generally do not separate proprietors from classes nor engage with entry and exit issues: for example, Davidoff (Reference Davidoff2012: Appendices) using breakouts from the 1881 census; Anderson (Reference Anderson1988) using the 5 percent sample of the 1851 census; Long (Reference Long2013) using the 1881, 1901 whole population and 2 percent 1851 census sample; and Garrett et al. (Reference Garrett, Alice, Kevin and Simon2001), Schürer et al. (Reference Schürer, Garrett, Hanna and Reid2018), and You (Reference You2020a) using 1881 whole population coverage. Family and wider networks for larger employers could allow maintenance of control of the firm through flexible methods of profit sharing, flexible forms of entry and exit by family members, and expansion of capital using close kin and wider networks of trust relationships that facilitated succession planning (Church Reference Church1993; Payne Reference Payne1988; Pollard Reference Pollard1965; Rose Reference Rose1994). At least three-quarters of firms were family owned or controlled up to 1911 (Colli Reference Colli2003). Marshall (Reference Marshall1919: 314) called them “the representative firm in most industries,” whilst Clapham (Reference Clapham1932: 112) noted that masters and small firms were “the most numerous form of enterprise.” Two more detailed case studies are indicative of entry and exit patterns: for Kentish London in 1851 (Crossick Reference Crossick1978) and for northern England and Edinburgh (Nenadic et al. Reference Nenadic, Morris, Smyth and Rainger1992; Nenadic Reference Nenadic1993). These link census and other records and demonstrate entry to both employer and own account status through family. However, higher income households had greater ability to recruit nonconjugal ties into trades such as drapers, wine merchants, licensed victuallers, chemists, and druggists. But in poorer trades (such as fishmongers, greengrocers, and general dealers) nuclear family groups of interdependents were common and could be a source of self-exploitation (Crossick Reference Crossick1978; Crossick and Haupt Reference Crossick and Heinz-Gerhard1995: 102).
Gender interacted with demography and social measures mainly through women having reduced opportunities for entry into proprietorship because of life-cycle constraints from motherhood, family responsibilities, and access to finance. Women also experienced barriers to accessing many waged employment opportunities. This could mean that proprietorship was sometimes a more available alternative. However, entry was often restricted for proprietorship as well. Previous historical research suggests gender-specific differences in the frequencies and sectors of male and female proprietorship (Aston Reference Aston2016; Aston and Bishop Reference Aston and Bishop2020; Davidoff Reference Davidoff2012; Kay Reference Kay2009; Nenadic Reference Nenadic1993), with large employers almost completely male (Nenadic Reference Nenadic1991), though with a stronger participation from widows who inherited a spouse’s business (Davidoff Reference Davidoff2012; Kay Reference Kay2009; Wall Reference Wall2002). Recent large-scale census analysis confirms that high rates of female proprietorship were limited to a narrow range of sectors. It also shows critical differences between women: proprietorship was a route to independence that was otherwise difficult for many single women; but for married women it was important for offering opportunities to supplement family income, especially where necessity required it (Bennett et al. Reference Bennett, Harry, Carry, Piero and Gill2019b: 169–74; Smith et al. Reference Smith and Bennett2020).
The census is locationally specific in I-CeM at the small scale of parishes. This allows assessment of opportunity-necessity dimensions of motivations in terms of location. There were two key locational changes of this period. The first was the continued expansion of urban areas (Law Reference Law1967; Robson Reference Robson1973). This brought more of the population into closer proximity, living and working at higher densities that facilitated local market expansion, and hence new opportunities for small business entry. The second source of locational change was the late-stage developments of the rail network. By 1851, at the start of the analysis, most main settlements in England and Wales were already well-connected to rail (Mitchell Reference Mitchell1964; Simmons Reference Simmons1986). Hence, aggregate effects of changing accessibility will be relatively small, but changes at a local level were still potentially significant. Rail for this period continued to be the most important vector of change in transport infrastructure and its main effect during 1851–81 was expansion of branch lines to facilitate greater penetration of the national market by larger businesses, either through expansion of wholesaling and distribution, or giving opportunities for local branches of retail outlets (Jeffreys Reference Jeffreys1954; Marshall Reference Marshall1891: 348; Novak and Gilliland Reference Novak and Gilliland2011). The effects of large firm expansions and branch networks were relatively limited at the 1851 start of the period of analysis but were accelerating by 1871–81 with increasing competitive pressures on the small master (as noted in the quotation from Marshall in the preceding text) in craft manufactures, maker-dealing, and retailing.
Census record-linkage also gives potential for both aggregate and fine-grained analysis by business sector. Because the purpose of the article is a representative national overview, we focus analysis on 13 aggregate sectors, and the main contrasts of farm and nonfarm sectors. Sectors are a key means to interpret entry and exit. Marshall and Marshall (Reference Marshall and Marshall1879: 116–17) suggest that proprietors should be more easily able to switch occupational sectors than workers: “the business man has great opportunities for discovering whatever can be found out about the present and future of other trades; if he wishes to change his trade, he can … generally do so more easily than a skilled workman … if there were no natural or artificial barriers against entering a trade.” Sectors were also a major differentiator of competitiveness and opportunity because they determined the scope and costs of entry barriers, scope for economies of scale, and influenced the value of incumbency and costs of exiting (Marshall and Marshall Reference Marshall and Marshall1879: 116). Marshall (Reference Marshall1891: 288–90), Clapham (Reference Clapham1932), Checkland (Reference Checkland1964), and Lee (Reference Lee1981) indicate the sectors that were most critical to the historical dynamics of the economy and how opportunities opened (or closed) over time. We expect there to be major contrasts at aggregate sector level between, on the one hand, sectors such as refreshments, maker-dealing, many individual building trades, and some personal services that had very low entry costs and barriers, and, on the other hand, the major manufacturing sectors, chemicals, utilities, construction management such as “builders,” and the professions that had high entry barriers and/or capital needs. High exit costs and low elasticity produce contrasts between sectors with low exit rates where there are high sunk capital and high skills, compared to sectors with low entry costs. Sector inertia and immobility between status categories of proprietors and worker will also be influenced by sector locational dominance. Although Britain was becoming an integrated market, de facto local monopolies could still exist that limited entry (Marshall Reference Marshall1891: 286). As Crafts and Mulatu (Reference Crafts and Abay2005) and Lee (Reference Lee1981) highlight, full market integration in Britain was not general until the 1940s.
The Census Data and Record-Linkage
The census offers the enormous advantage of full population coverage, thus overcoming selection bias and allowing a view of the development of business development across the whole economy and all sectors. It has, however, various limitations of design and collection in the way that proprietors can be identified. These have to be managed to ensure that the advantage of full population coverage is supported by linked records that are representative of the population.
Census Questions on Proprietors
The British censuses for 1851–81 included a question that was unique to this period. This requested information on “employers” and “masters” (which censuses also referred to as own account). The key part of the question in 1851 was: “In TRADES the Master is to be distinguished from the Journeyman and Apprentice, thus – ‘(Carpenter – Master employing [6] men);’ inserting always the number of persons of the trade in his employ on March 31st.” Footnote 3 This was extended in 1861 to: “In TRADES, MANUFACTURES, or other Business, the Employer must, in all cases, be distinguished. – Example: ‘Carpenter – Master, employing 6 men and 2 boys;’ inserting always the number of persons of the trade in their employ, if any.”Footnote 4 For farmers there were similar questions. The instructions continued almost identically for 1871 and 1881.Footnote 5 Though not the best question design, the census manuscripts give the original responses by employers to state their business and its workforce size, with similar descriptors for masters.
The digital census records in I-CeM (Schürer and Higgs Reference Schürer and Edward2014) give the respondent descriptor strings, but proprietors are not identified directly. They have been extracted in the I-CeM-linked database of BBCE (Bennett et al., Reference Bennett, Harry, Carry, Piero and Gill2020) which tags all employers in the census records with their workforce, and those operating on own account with no employees (Bennett et al. Reference Bennett, Harry, Piero and Carry2021). The tagging assigns each response to employer, own account status using all synonyms of “employer” and “master,” such as “proprietor,” “partner,” “owner,” “landlord/landlady” of an inn, and so forth, and tagging anyone who stated having employees (or “workers,” “hands,” etc.). The identification of these categories used algorithms with subsequent clerical checks and hand cleaning (Bennett and Newton Reference Bennett and Newton2015). The directly tagged responses can be confidently treated as either, respectively, employers or own account; they provide the entry point for our record-linkage.
Linking Intercensus Records
Record-linkage methods have been widely applied to censuses (Winkler Reference Winkler2014; Zhichun et al. Reference Zhichun Fu, Peter and Jun2014). Usually census linkage has focused on social changes (e.g., Long, Reference Long2013; Long and Ferrie Reference Long and Joseph2013). However, Atack et al. (Reference Atack, Fred and Gregson1992) piloted linkage of a sample of proprietors between the 1860 and 1880 US Census of Manufactures, and Nenadic et al. (Reference Nenadic, Morris, Smyth and Rainger1992) developed proprietor linkage for case studies. But this article is one of the first to attempt linkage of proprietor records over four census years for a whole population. The linkages cover 10-year intercensus gaps. Hence, linkage criteria have to be persistent and complete. Persistence restricts linkage to five criteria: surname, forename, birthplace, exact age (by year), and sex. Completeness of all responses is often ignored in census studies: the level of nonresponse to the occupation question prevents this being used as a link criterion. Linkage criteria also have to be independent of the subsequent analysis: so that occupation and proprietor status cannot be used. The method follows Jaro–Winkler who pioneered large-scale census linkage (Porter and Winkler Reference Porter Edward and Winkler1997). Footnote 6 It uses string comparison of first and second names, modified here by data blocking, and variable thresholds for acceptance of matches based on name frequency. There was also extensive precleaning, and prior standardization and coding of proprietor status and birthplace descriptors.Footnote 7 Full details of method are given in Newton and Bennett (Reference Newton and Bennett2020) and database in Montebruno and Bennett (Reference Montebruno and Bennett2020a, b).
For each year the starting point was the proprietors directly tagged from the census manuscripts, which range in number from 385,530 in 1851 to 414,939 in 1881. Each of these was searched for matching individuals in adjacent years against the whole population available, irrespective of their occupation and proprietor status. Both forward and backward record linkage was used. The average linkage achieved was 22.7 percent of the starting population of tagged employers and masters.Footnote 8 This linkage rate is fairly typical for census linkage lacking accurate training data, and where transcription errors and variations in name recording occur (Antonie 2020; Goeken et al. Reference Goeken, Lee, Tom and Diana2017; Massey Reference Massey2017; Winkler Reference Winkler2014); it is almost identical to that achieved by Long (Reference Long2013: table 1).Footnote 9 It also reflects drawing match thresholds high to minimize false positives to maximize accuracy. Most important, however, the match rates were representative of the original tagged entrepreneur population for the combined forward- and backward-linked data. Combining linkages overcomes the most common problems of bias that arise in linkage studies: forward unrepresentativeness by age as a result of differences in survivorship by sex, class, or other characteristics; and backward unrepresentativeness by excluding young people who were at early stages of careers.
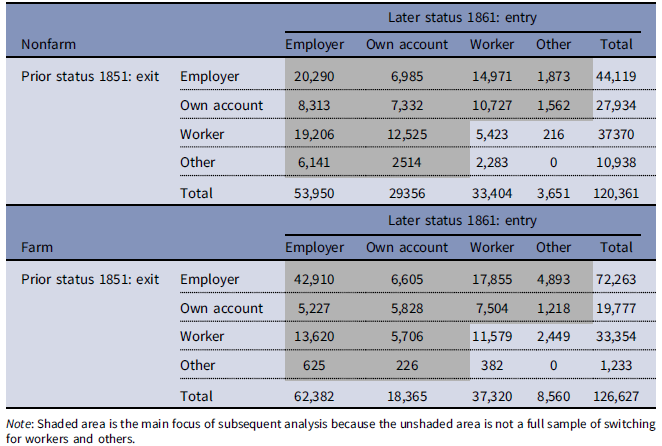
Table 1. Numbers of proprietor switching status: exiting from an 1851 employment status (rows) and entering an 1861 status (columns)
Employers and own account are relatively rare (only 2–5 percent of the population). For rare items, the main danger in linkage is false positives, which increase very rapidly with any weakening of the linkage criteria. Hence, we focused on minimizing false positives. Because no training data or alternative fully accurate “truth” data are available that can be used at the scale of the whole population it is essential to have strong confidence in the accuracy of the links. This meant rejecting those with multiple links as there is no alternative means of “disambiguation,” for example as used by Antonie et al. (Reference Antonie, Kris, Chris and Fraser2020). As a result of this and high thresholds we will have lost people who were truly linked: we have high accuracy, but low “efficiency” (Abramitzky et al. Reference Abramitzky, Roy and Santiago2020). Our key tests for linkage were: Is the N large enough for robust analysis without this risk? Is the sample representative? As we achieved an N of many thousands, and it proved to be representative, it is unnecessary to increase N for the purpose of analysis by weakening the linkage criteria (we are not generally constrained by sample size in this article). Hence, our key test of accuracy is statistical representativeness of the samples against the original census.
Tests of the combined linked samples compared with the original groups of the tagged population found no significant differences at p = 0.05 between them in aggregate, and for categories of farm and nonfarm, by status, age, sex, and size-class of the workforce reported; that is the linked sample is representative of the tagged starting population from which links were made (Montebruno and Bennett Reference Montebruno and Bennett2020a). These tests also indicate that archival losses do not affect representativeness; although reducing the number of links that can be found, the tests show data loss has random effect on linkage.Footnote 10 However, for nonfarm females linking 1871–61, there was significant difference at p = 0.01, which had different match rates by status: higher for employer matches than own account. This arises from constraints of the 1871 data discussed in the following text.
A further test is linkage accuracy. Although we have no fully “truthed” data we can make manual checks against the census manuscripts. We checked 600 linked records identified as potentially aberrant (young age, strange transcripts, etc.); given that linkage was deployed for 17.5–26 million people per year, full clerical checks of the records are infeasible. Checking spouse name, family configuration, and other characteristics indicated no links looked erroneous. However, three (0.5 percent) had errors in employer status because part or all the original data on the employer was mistranscribed and attributed to the person immediately below the true subject: that is, the correct person was linked, but given the wrong status. This issue of “split-lines” was identified at an early stage of constructing the entrepreneurs’ database. It had been the subject of extensive previous hand cleaning, but a few slipped through (van Lieshout et al. Reference van Lieshout, Bennett, Harry and Gill2017).
The very low error rate contrasts with most census linkage studies, which typically find around 20 percent false positives (Abramitzky et al. Reference Abramitzky, Roy and Santiago2020; Goeken et al. Reference Goeken, Lee, Tom and Diana2017; Massey Reference Massey2017; Zhichun et al. Reference Zhichun Fu, Peter and Jun2014); for example Bailey et al. (Reference Bailey, Connor, Morgan and Catherine2020) found two independently digitized versions of the 1940 US Census had 25 percent of records with different transcriptions of last name. The method applied here links what can be linked confidently; other researchers will be able to find more links within the same data but may not achieve the same level of accuracy. Our aim is a representative starting point that is sufficient to support our analysis. The nature of the entrepreneur also seems to offer better matching opportunities: employers in particular tend to be more stable than the rest of the population as they are more rooted by their investments, and they tend to be older (Bennett et al. Reference Bennett, Harry, Carry, Piero and Gill2019b: 164–70) and we already know that a large proportion of migration occurred primarily in young adult years (Schürer and Day Reference Schürer and Day2019). We might expect farmers to be easier to link as they were often more occupationally stable with less mobility out of proprietor status (as found for intergenerational links by Long and Ferrie Reference Long and Joseph2013: Appendix tables A3-3, A3-4), which proves to be the case in the text that follows; but linkage rates hardly differ between farm and nonfarm. Similarly, female proprietresses were expected to be more difficult to link, as found in most previous census studies of women (Massey Reference Massey2017; Zhichun et al. Reference Zhichun Fu, Peter and Jun2014) because of name changes on marriage/remarriage. But female employer link rates are higher than male (primarily because they were already married in the initial link years), whilst own-account proprietresses usually have only slightly lower link rates.
There are, however, two constraints on the analysis. First, the imperfect design of the question and its interaction with other census instructions led to incomplete or nonresponses because some respondents were diverted from giving a full reply. Hence, tagged proprietors may link to imperfect responses with uncertain employment status in other years. To overcome this deficiency the BBCE database provides supplements of imperfect responses by assigning all economically active to employer, own account, or worker status. This means that individuals tracked between years have either a tagged or an estimated proprietor status. This is approximate.Footnote 11 The result of including or excluding the supplemented responses was tested in the following analysis to check robustness; the analyses did not differ substantively so that only the supplemented results are shown. However, this increases the variance encountered, as borne in mind in the following text.
A more major data constraint is that I-CeM data for 1871 do not currently exist. The BBCE database infills this gap from an alternative transcription source.Footnote 12 However, this infill covers only the tagged groups of employers and masters. This means that searches for linked proprietors into 1871 from adjacent years cannot search the whole population. As a result, forward links 1861–71, and backward links 1881–71 have a lower probability of success. This limits interpretations for 1871. Consequently we place most emphasis below on the strongest data for 1851–61 linkage and use 1871 mainly as an indicator of general trends.
Analysis
The census offers the enormous advantages of full population coverage. However, we are only able to observe proprietors at 10-year intervals, which means that there may have been other intermediate activity differing from the states we can observe at the start and end of a linkage. This means that “entry” refers to the observed state prior to the subsequent census date, and “exit” is the state reached at the later date.
Table 1 summarizes the full record-linked sample, combining forward and backward links, and differentiating farming from nonfarming.Footnote 13 This is an example of linkage comparison for 1851–61, showing the transition from one status (row) in 1851, to another status (column) in 1861. The 1851–61 linkage is the fullest from the data available as it avoids the limitations of the 1871 data. As combined links the matrix covers all identified linked people, irrespective of whether identified forward or backward. This means that the rows show the full extent of exit from proprietorship, and the columns show the extent of market entry. The diagonal entries are those who do not change status: the largest of these (top left) shows 20,290 employers in 1851 who continued to be employers in 1861. These tables are proprietor switches; they are not full matrices of status switching for the whole population because we are tracking only entry/exit of proprietors. Switching between worker and “other” categories is incomplete because these two statuses only occur in the table for those people who had been proprietors at one end of the link. In the population at large worker-to-worker changes will be the majority. The worker-to-worker links in table 1 refer only to those who became proprietors in the later linked years. This bottom right quadrant is excluded in tables 2 and 3, as indicated by the shading.
Table 2. Entry percentage from each status in 1851 to become employer and own-account proprietors in 1861 (each column sums to 100 percent)
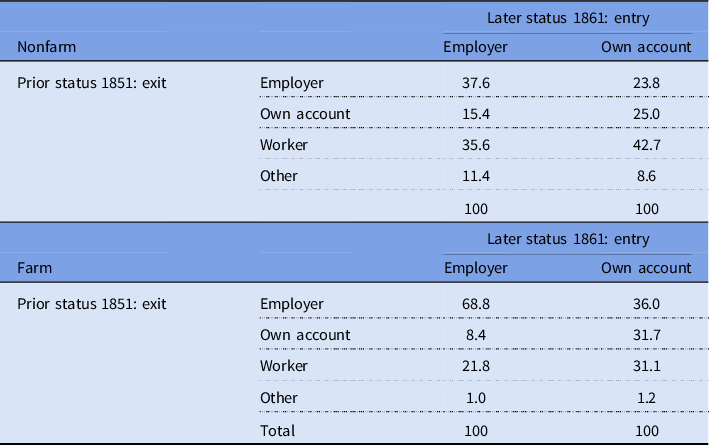
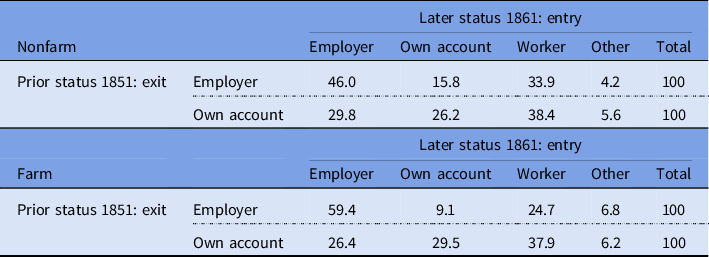
Table 3. Exit percentage from employers or own account in 1851 to other statuses in 1861 (each row sums to 100 percent)
“Other” in this table refers to an occupational status where linked proprietors were economically inactive, that is not employers, own account, or workers. It reflects various important features of the dynamics of proprietor development. The largest group, as expected, is for more than three-quarters who were too young to be previously occupied or were scholars or “farmer’s son” and so forth. Another group was the retired, unoccupied, and living on independent means reflecting exiting business in later years. A small group is “private means” and landowners, who were recorded as proprietors at one end of the link. They reflect those on large private incomes or having large estates, perhaps as an element of “gentlemanly capitalism.”
Change of Entry/Exit Rates over Time
Similar matrices for each year allow comparison of status change over time. However, to ensure comparability between links that have different sample sizes, as well as to limit the effect of the partial data for 1871, it is preferable to present results as percentages. Percentages for linkage can be calculated in two different ways: first, as the different exit statuses from a specific prior status (e.g., in table 1 the rows sum to 100 percent); and second, percentages of the sources of entry from all prior statuses (the columns in table 1 sum to 100 percent). These are referred to in the rest of the paper as entry and exit percentages; they are shown, respectively, in tables 2 and 3 for the 1851–61 changes, which correspond with the shading in table 1.
Entry statuses are shown in table 2. While many farm employers are stable (69 percent continue as farmers), nonfarm employers in 1861 originate almost as frequently from worker status as being previously employers in 1851. For own account the pattern is similar, with farmers more stable than nonfarmers, and workers a major prior entry source for each. In contrast, own-account nonfarm have a higher entry proportion (43 percent) from workers than farm (32 percent). As previously recognized by Crossick’s (Reference Crossick1978: 49–57) case study, the flows between worker and proprietor status are high. There may be some effects of 10-year intervals between censuses that may hide switches of status that conform to a “ladder” that we cannot observe, but it appears that moves between employer and worker status are frequent without going through an intermediate status of own account.
Exit status in table 3 was also relatively stable for employers: 46 percent of all nonfarm employers and 59 percent of farm employers remained as employers over the 10 years from 1851–61, with the main subsequent exit status being to worker, followed by own account. This is a strong contrast with own-account proprietors, where only 26 percent were stable in this status in nonfarm and 29.5 percent in farming, with the main exit status in each case being 38 percent to become workers.
Whilst the high level of stability in the same status on entry and exit is to be expected, incumbency offered many advantages and few incentives to change. And, as Marshall (Reference Marshall1891: 285) noted, agriculture and many small traders had few opportunities to upscale: the relatively large proportion of both employers and own account who moved out of or into workers demonstrates that a “ladder” on entry and business succession from employer status into own account was not necessary or most common. It also runs counter to more general comments on the lack of social mobility, upward or downward, observed in Victorian marriage patterns by Miles (Reference Miles1999: 177) or the father-son mobility examined by Mitch (Reference Mitch, Miles and Vincent1993), but fits with the findings of others who have focused more specifically on proprietors, such as Crossick (Reference Crossick1978) for 1851 London, that there was frequent flow between own-account and employee status. In this period our results show the flows between worker, employer, and own-account statuses are all large, and that own account was one of the least stable of categories over time. This confirms other literature that suggests that own account was a relatively fragile and more ephemeral way of earning a living, often associated with necessity entrepreneurship when wage options were not available, and that small traders and employers were increasingly under challenge (Marshall Reference Marshall1891: 283–4).
Using the two formats of tables 2 and 3 we can compare entry and exit over time. In this extension we also divide the tabulations between sexes to reflect the different labor markets involved, but also to allow for possible nonrepresentativeness of the 1871 female nonfarm linkage. For the following discussion we only attempt indicative interpretations over time; the limitations of 1871 data prevent detailed testing or strong conclusions being drawn. Nevertheless, some important potential indications of trends can be inferred. Figure 1 compares nonfarm proprietors; exit percentages (as in table 2) and entry percentages (as in table 3) are shown side by side for each linked year, then employers and own account are compared, separately by sex. Figure 2 shows the same analysis for farm entry and exit. Apart from the limitations of the 1871 data care needs also to be exercised because female sample sizes are smaller (6.1 percent of all nonfarm linked proprietors, and 5.7 percent of farm links).

Figure 1. Nonfarm proprietor entry and exit.
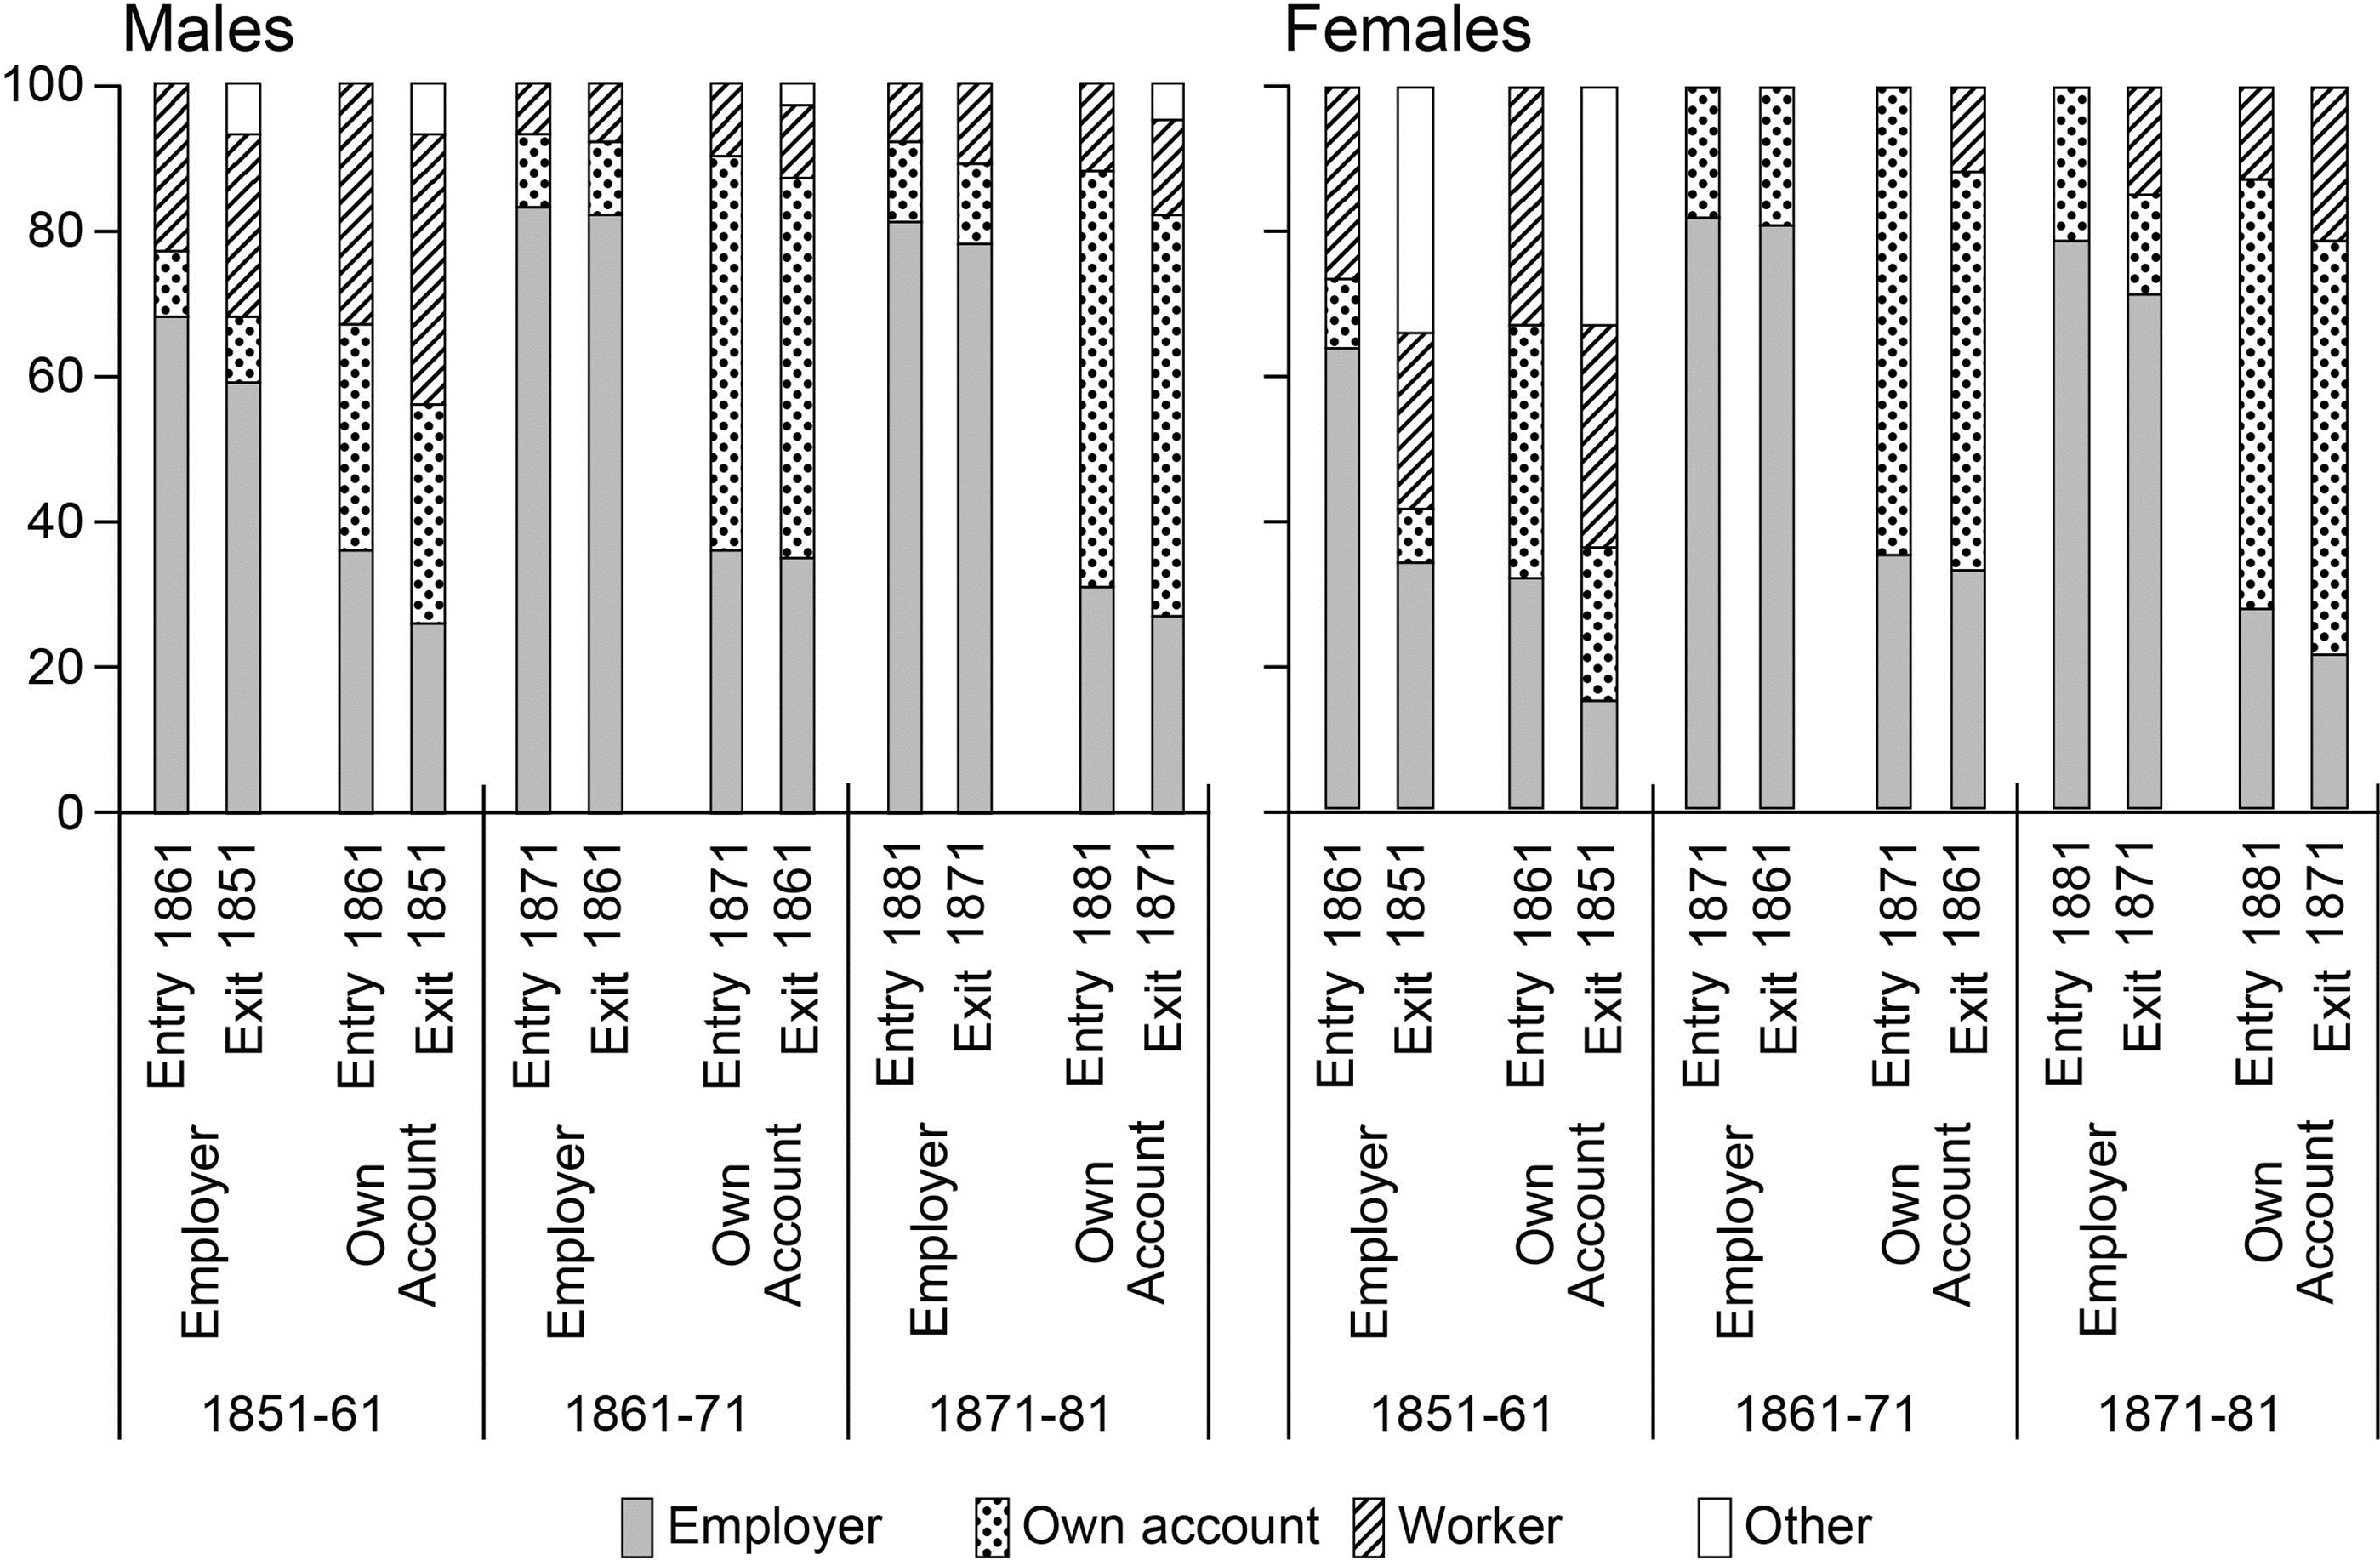
Figure 2. Farm proprietor entry and exit.
A notable feature of the results is that entry and exit frequencies are quite close in most categories, suggesting similar underlying factors in people’s entry and exit decisions. As indicated in the previous tables for 1851–61, employers have a higher level of stability than own account, and farmers have higher stability than nonfarmers. Stability in these figures is indicated by the section of the bar that has the same status as the column as a whole. Stability (comparing 1851 with 1881) appears to increase over time for both farm and nonfarm employers, and applies to both men and women, but stability only slightly increases for nonfarm own-account proprietors. Because of the partial 1871 data, the links of 1861–71 are less reliable as guides (the second group of columns) for exits, and 1871–81 less reliable for entry. Nevertheless, these 1871 links do confirm the broad direction of trends. The trends also show a contrast in the extent to which the major transfers between worker and proprietor status, recognized as important in 1851–61, continued. For the later years the high level of flow into and out of worker status from and to proprietorship is reduced, and there is greater flow between employers and own account. This is particularly true in farming for both genders. The exception for nonfarm women, where the worker proportions become larger over time, may reflect the lack of statistical representativeness of this set of female links noted earlier.
In addition to general trends, comparison between the figures allows important observations on differences between the proprietorship experiences of men and women. Indeed, for nonfarm these have the strongest contrasts. As noted earlier, women are much more likely than men to enter and exit proprietorship from/to “other” status. This is to be expected, as the majority of women who were employers were married/widowed and were likely to switch status between economically active and inactive as they dealt with different life-stage challenges (Davidoff Reference Davidoff2012; Garrett et al. Reference Garrett, Alice, Kevin and Simon2001; Kay Reference Kay2009; Wall Reference Wall2002). It also reflects any poorer recording of female economic activity in the census (Higgs and Wilkinson Reference Higgs and Amanda2016; You Reference You2020a, Reference You2020b). The contrasts between women and men are strongest for nonfarm, and generally greater for entry from “other.” For 1861 and 1871 entry into employer status, and 1861 own account entry, prior “other” is the largest entry category for nonfarm women. For farmers, the reverse tends to occur: that women are more likely to exit to “other,” particularly from 1851 status as either employer or own account. For later years exiting “others” are higher than entry, but the frequencies of both are very small.
Proprietor Age
The census allows considerable scope to assess demographic influences on business evolution. These are more fully investigated in the following text, but an important prior demographic analysis is the role of a person’s age. Because we are using combined links, forward and backward links have the same age distribution except that everyone adds 10 years. The analysis quotes the age at the start of the link. Figure 3 shows age distribution for male nonfarmers, comparing those who are stable and do not switch in or out of proprietor status with those that do; those under 15 and over 85 are excluded as a minor part of the data. There is a similar distribution for switchers and nonswitchers. However, switchers are older on average, and frequency of switching is slightly lower at younger, and higher at older ages than nonswitching (the switcher age distribution is lower and more spread than the nonswitcher). This indicates that generally individuals who entered in younger years (25–40) then remained stable only until about 50 on average. Hence, the period of male nonfarm proprietorship was often only part of the life cycle and was concentrated in early to middle years. Switching also seems to become slightly more prevalent in older ages over time. However, there was also extensive overlap at all ages.
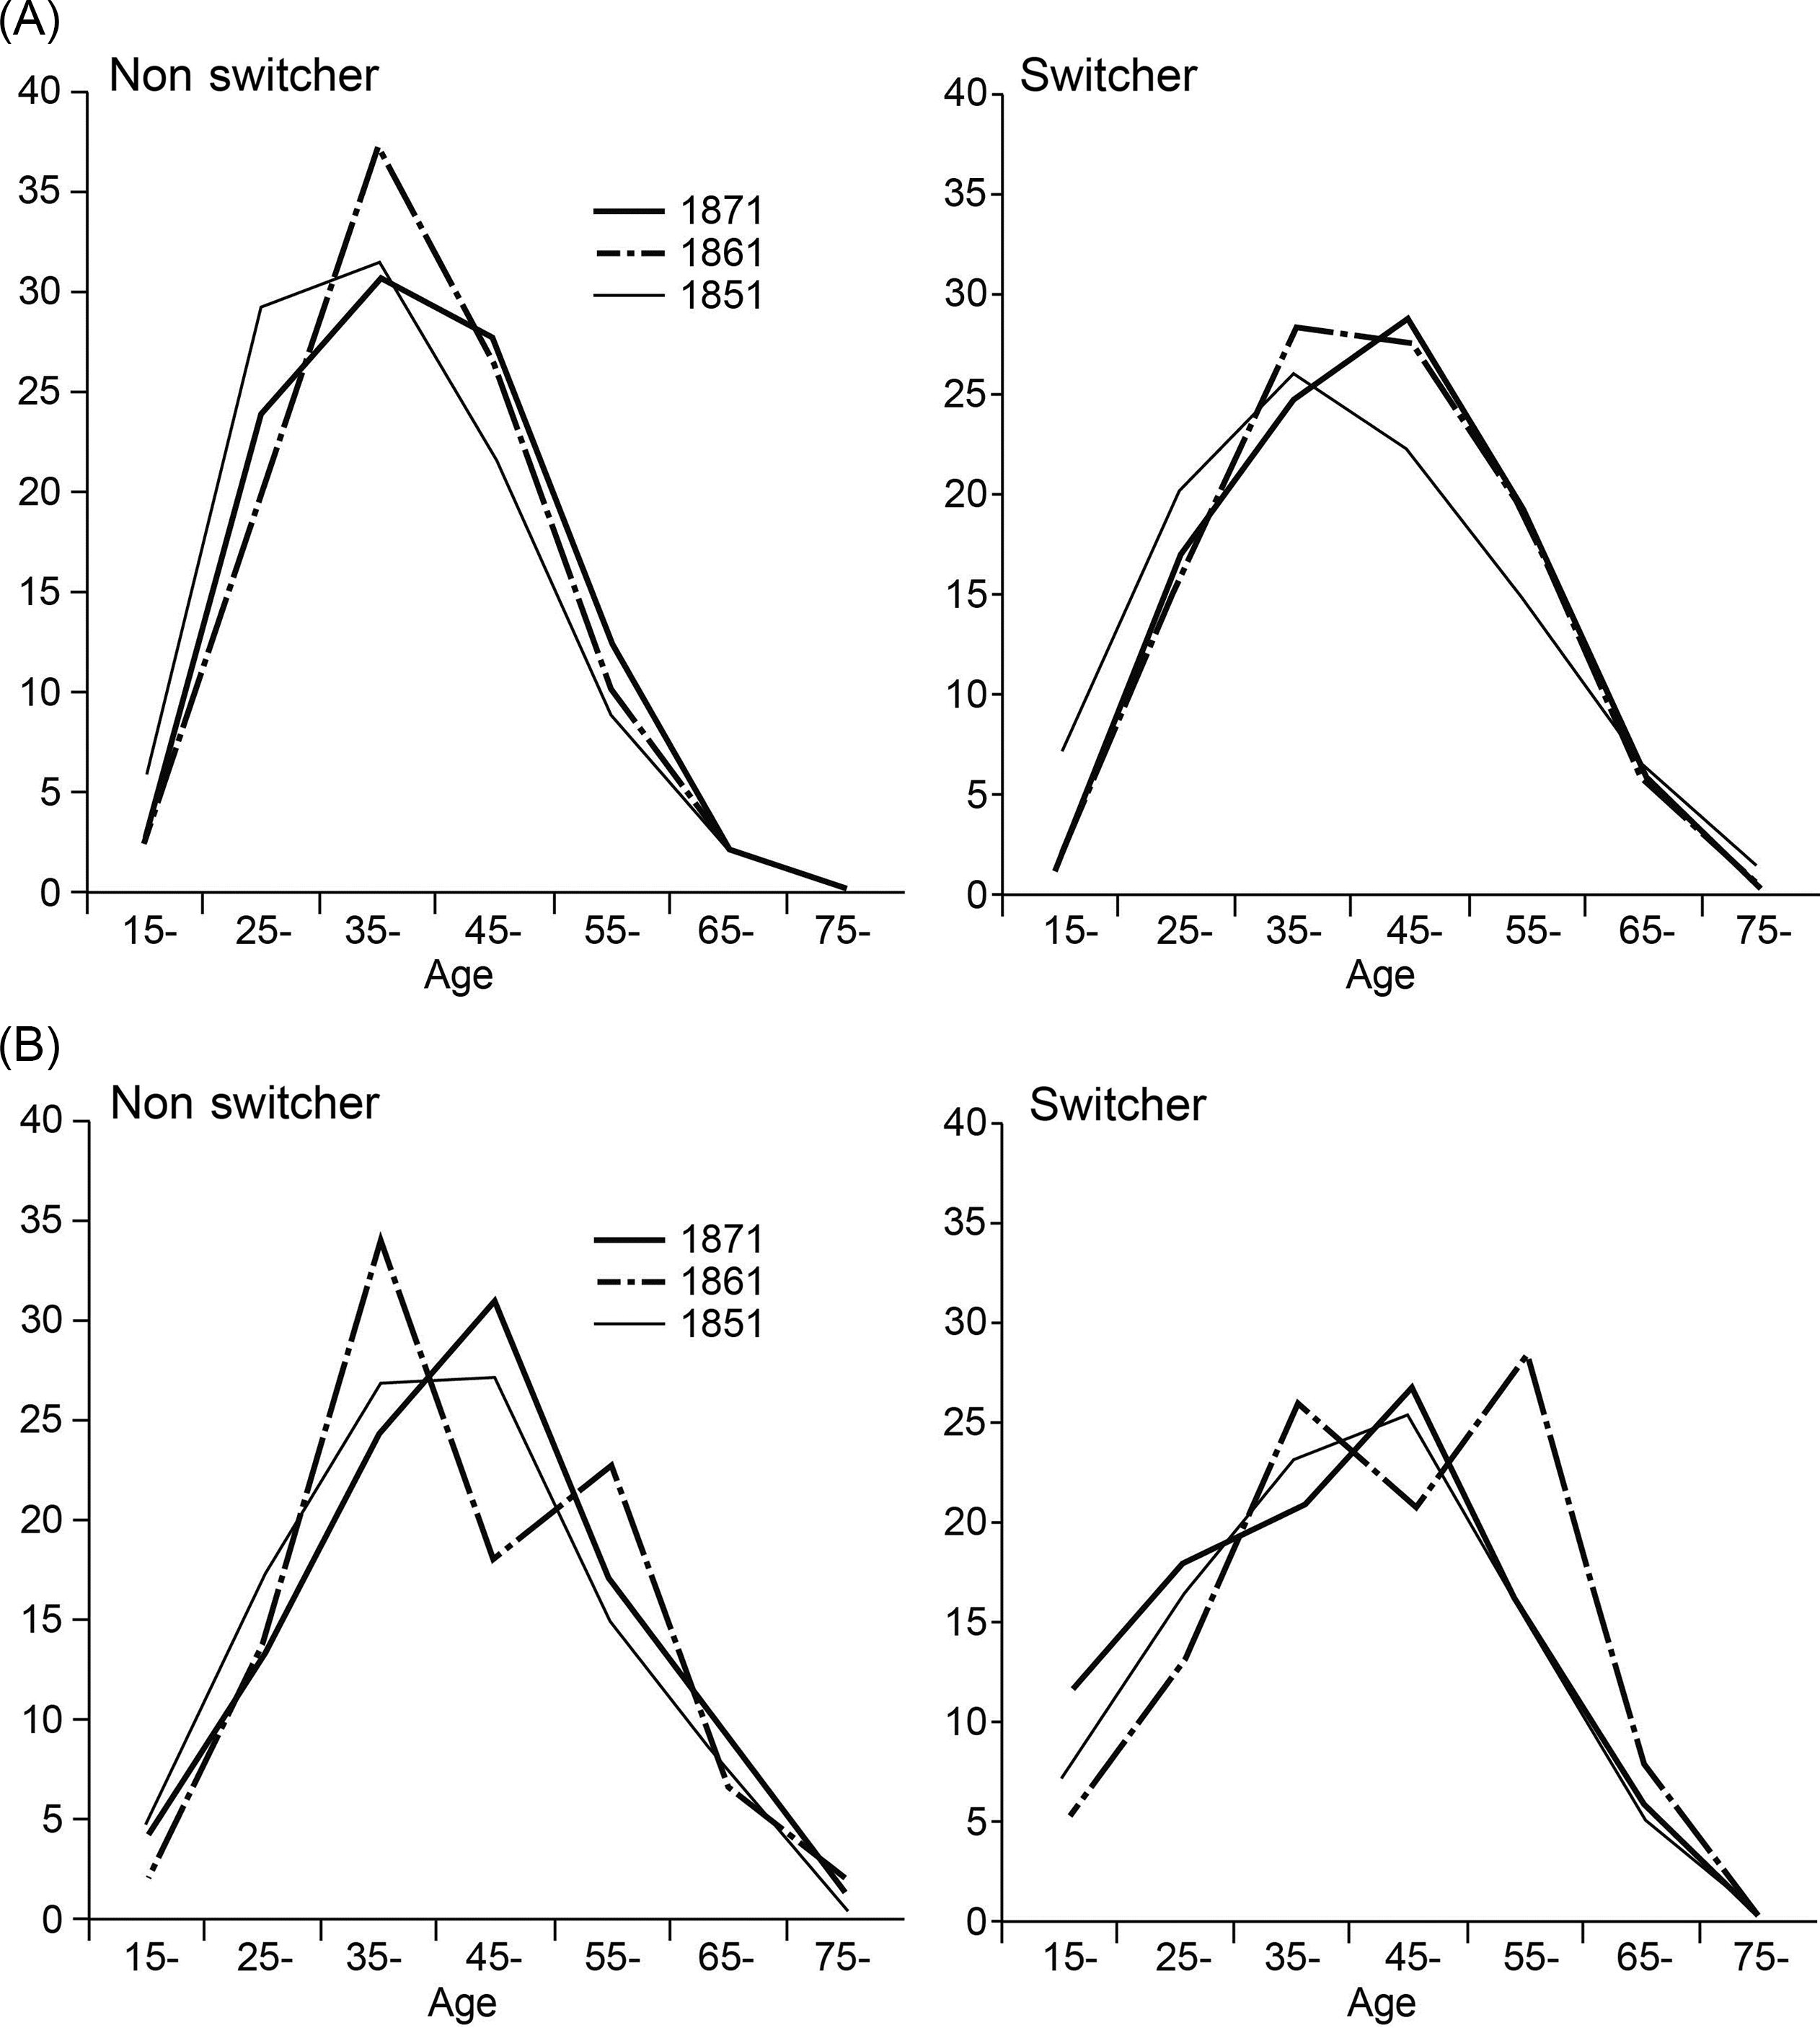
Figure 3. (A) Male nonfarm proprietor age distribution comparing nonswitchers and switchers between status by year. (B) Female nonfarm proprietor age distribution comparing nonswitchers and switchers between status by year.
For nonfarm women there is a more varied differentiation across the age range that partly reflects instability from smaller samples in some age categories especially in 1861–71 but also indicates the much more varied life histories of many women (figure 3 B). Most notable is that nonswitching women were only slightly younger than switchers, on average. This is a contrast to men. Also switching for women was generally over a wider and higher age range than men: they entered proprietorship slightly later on average and left older. However, for the very youngest categories there were more women entrants up to the age of about 20 than men. As with men, generally women who entered in younger years (25–35) remained before switching in later years mainly from 35 an upward but switching was also more frequent across most age groups than for men: the age distribution was slightly flatter and more spread out than nonswitching and for men. This is indicative of a pattern for women that interrelates with marriage and family commitments, investigated further.
For farmers (figure 4), the male patterns are similar to those of nonfarm, but the age profile was markedly less peaked around 25–45, mainly as a result of nonswitchers being much more frequent in older years than for nonfarm; that is switching occurred in farming on reaching earlier middle years and continued for more ages than it did in nonfarming. This also tended to increase for the later period. For women the pattern is much smoother than for nonfarm as the sample size is larger and less varied. Frequencies of female proprietorship in farming were much closer between switchers and nonswitchers than males, but the major contrast was the much greater peaking at higher ages of 45–65. This is indicative of wider family interdependencies for women, where they often took on a farm in middle or later years as widows. But the very tight and close alignment of the switchers and nonswitchers in the older age ranges shows they were more likely than men to pass on the farm rapidly to others, often family members. The major feature of contrast between farm and nonfarm as a whole derived from this older age female proprietor frequency.
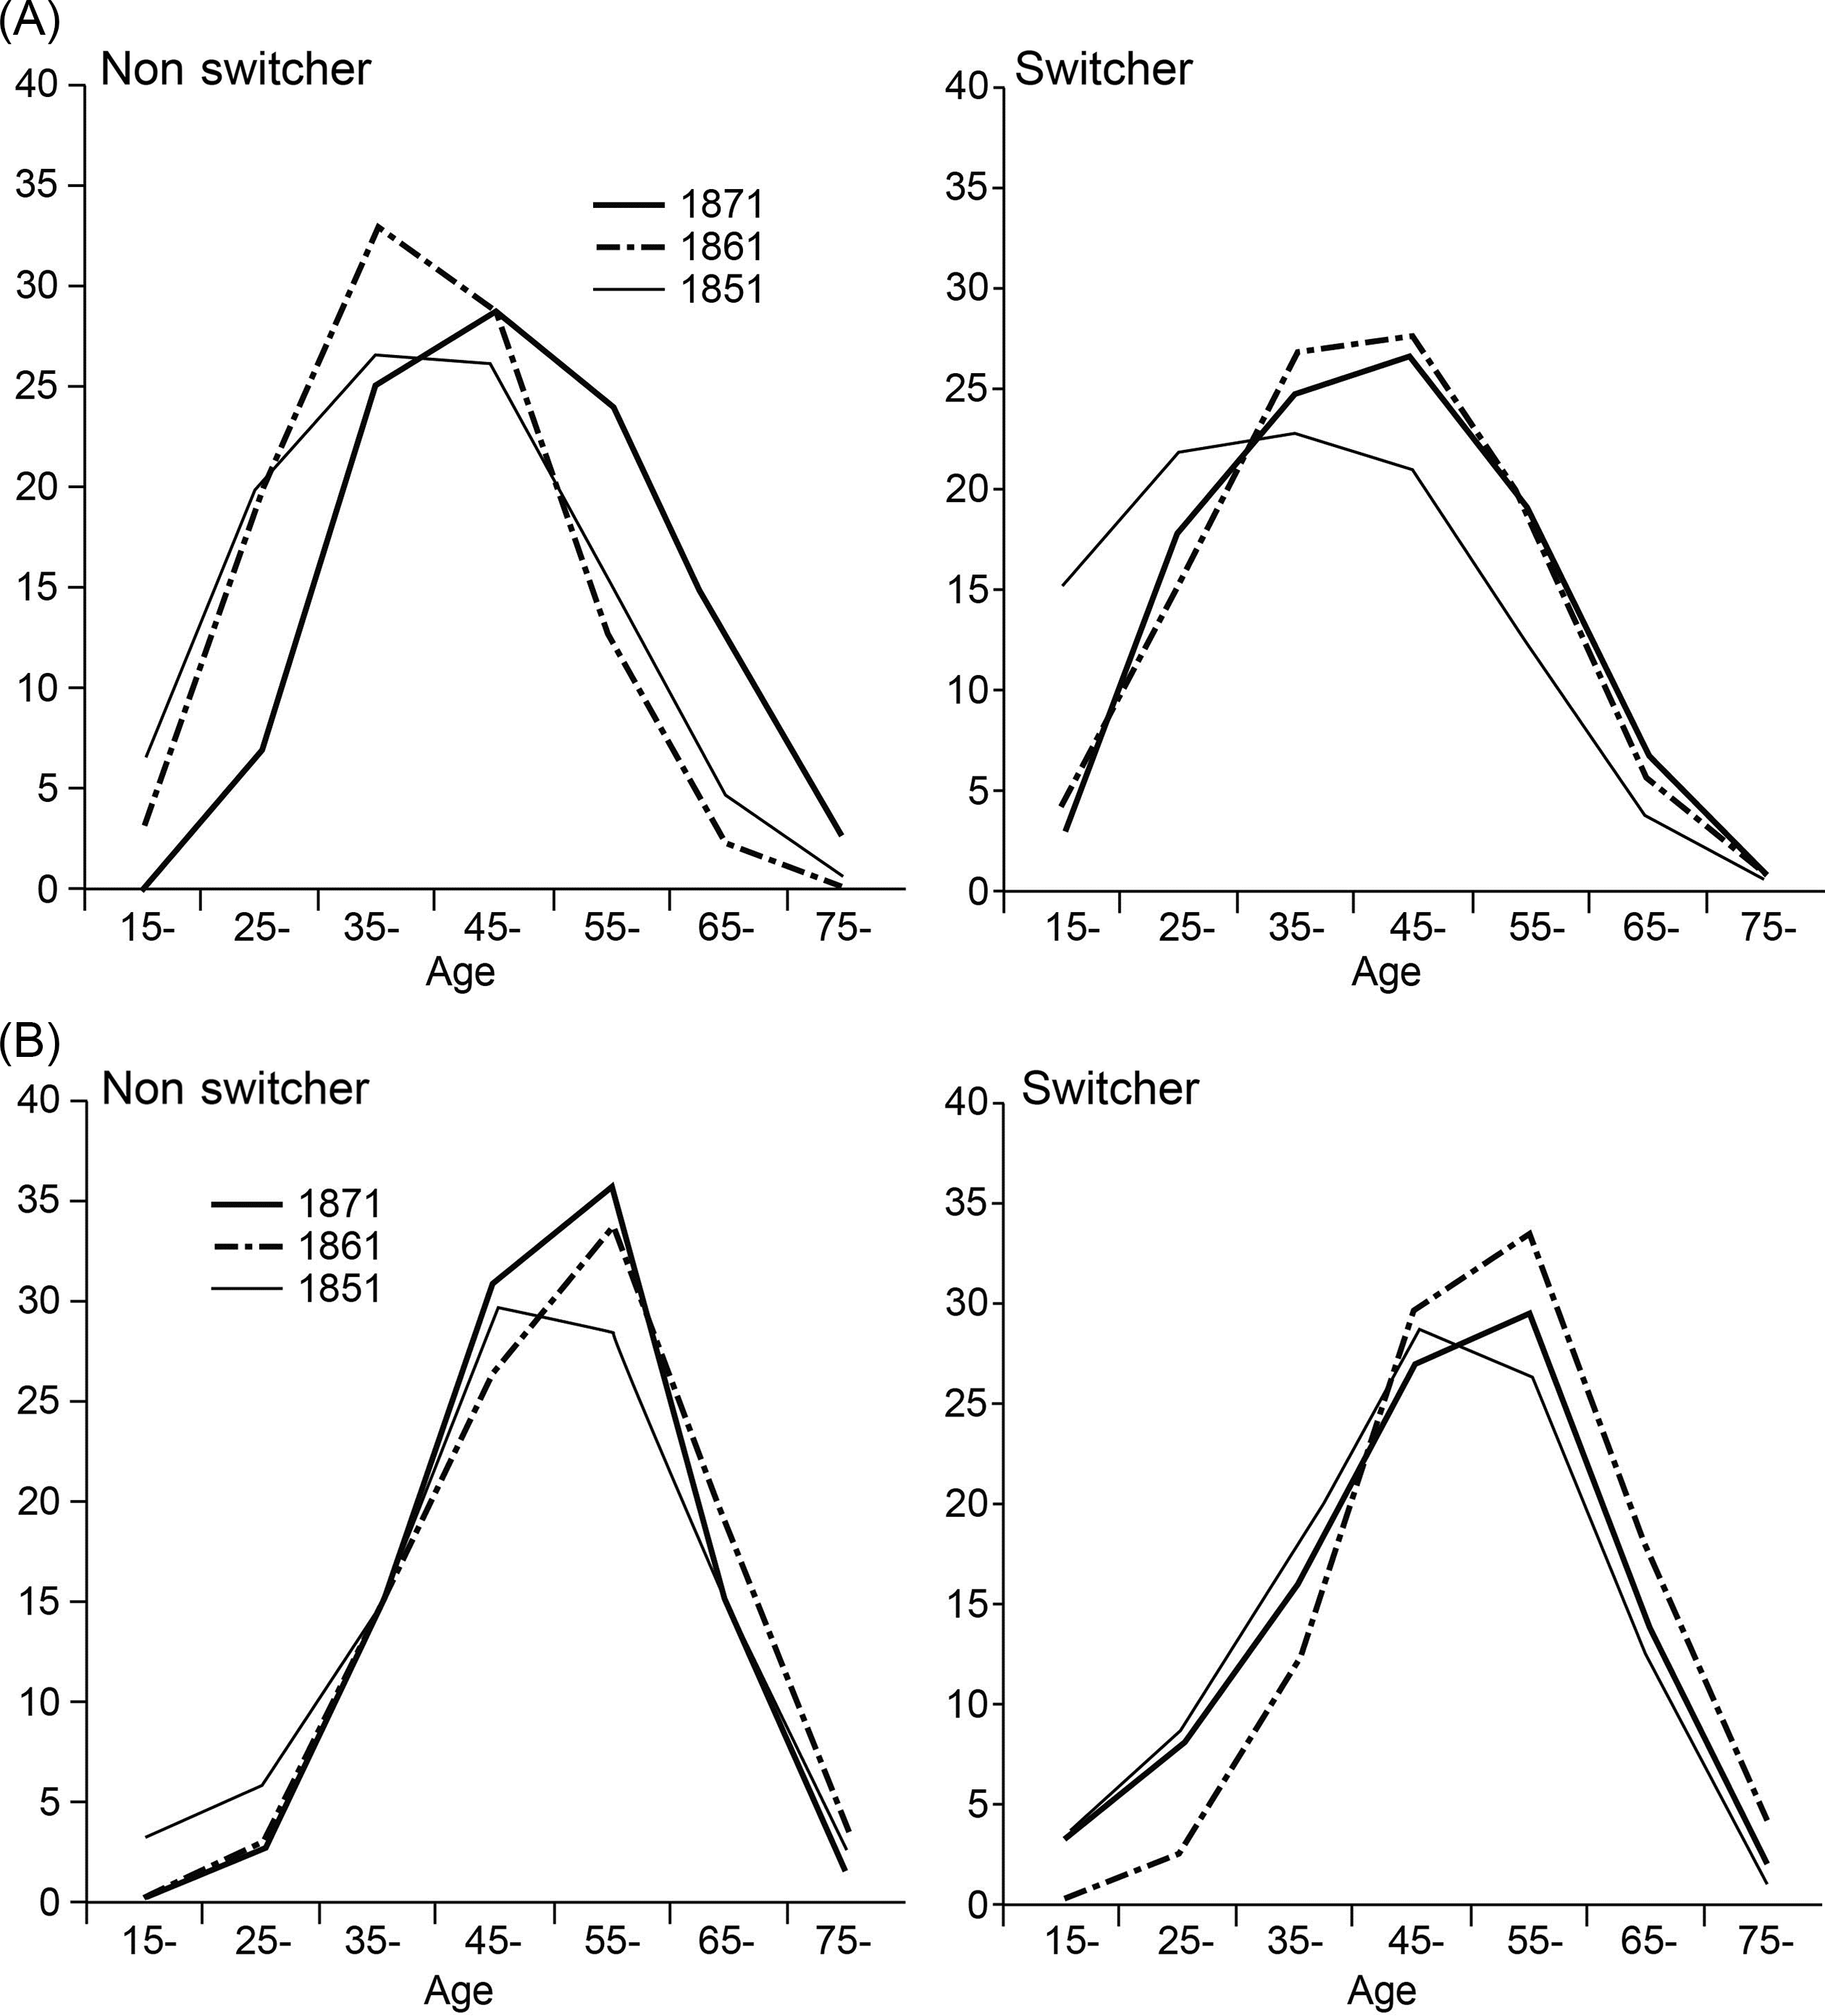
Figure 4. (A) Male farm proprietor age distribution comparing nonswitchers and switchers between status by year. (B) Female farm proprietor age distribution comparing nonswitchers and switchers between status by year.
Wider Covariates
The analysis is extended to investigate a full range of other variables to assess wider influences on career switches. Because of the constraints of the 1871 data, the estimates are limited here to 1851–61 linkages, which have the strongest data that satisfy the demands of multivariate analysis. However, estimates were also made for all cross-sections of linked years and, while not reported here because of space, they show comparable results.
The dependent variable we seek to understand is the status of different types of proprietor at entry and exit, defined as a categorical variable where an individual has switched or not switched status. This is estimated by a multivariate logit regression. A logit is similar to normal regression but the dependent variable is a category, not continuous. It estimates if an individual has switched status (a value of 1) compared to not switching (a value of zero). This is estimated for each status category (employer and own account) separately, and for entry and exit separately. Pi is the estimate of a switch of status for each linked individual i:
 $$\left( {{{\rm{P}}_{\rm{i}}} = {\rm{1}},0} \right) = {\rm{\beta}} _{0} + {{\rm{\beta}} _{\rm{1}}}{{\rm{X}}_{{\rm{1i}}}} + {{\rm{\beta}} _{\rm{2}}}{{\rm{X}}_{{\rm{2i}}}} + \ldots + {{\rm{\beta}} _{\rm{n}}}{{\rm{X}}_{{\rm{ni}}}} + {{\rm{e}}_{\rm{i}}} $$
The following analysis estimates the extent to which the series of covariate variables X1i explains the switching or nonswitching; β0, β1 …. βn are the estimated coefficients for each variable 1 … n, and ei is the random error term. Where the covariates are categories a base category has to be chosen against which the other categories are compared.
From the theoretical discussion we expect key covariate variables to be demographic and social, locational reflecting opportunity and necessity, and sector/occupational. Of the demographic and social variables, age has already been shown to have important distinctions between life-cycle effects on switching/nonswitching, with age squared also used to capture nonlinear effects—reflecting the rise and then fall of the general age profile of proprietorship and switching propensity (in figures 3–4). Other personal demographic variables included are all categorical: sex, to estimate different switching frequencies of proprietorship among women; marital status (single, married, widow/er); and relationship of individuals within their household, which affects their family and social position (defined at the start of the link). In the census, relationships are defined relative to head, who in a single conjugal unit (CFU is husband, wife, and children) is usually the husband; in more complex households this may be the senior male, senior female, or another person who took responsibility for filling in the census form. The head is used as the base case.Footnote 14
Other important covariates estimated relate to location to assess the role of local business opportunities and market conditions. As Marshall (Reference Marshall1891: 272–3, 286–8) recognized, localization remained key for small firms, with markets of different sizes and accessibility critical to business opportunities (see also Wilson and Popp, Reference Wilson and Andrew2003). This is measured by population density, density squared to capture nonlinear effects, and an urban/rural coding that distinguishes different sizes and types of town or rural area. Four urban/rural categories are developed from long-established definitions by Law (Reference Law1967) and Robson (Reference Robson1973); see Smith and Bennett (Reference Smith and Bennett2017): Urban: a population of ≥10,000 (the base category); Urban transition: urban fringe areas, namely nonurban parishes in Registration Sub-Districts (RSDs) having at least one urban parish; Transition: higher density RSDs that contained no Law–Robson town; and Rural: RSDs with low population density. Accessibility beyond the locality is assessed by two railway access variables: distance (kilometers) to the nearest rail station and distance to nearest rail line; lines may be more significant than stations for some businesses because there were many private sidings and drop-off/pick-up points. Business opportunities are expected to decrease as distance to rail increases. However, because by the start of the analysis in 1851 most of the country was accessible to rail, the effects may be small.
A key covariate is expected to be sector market conditions. As recognized by Marshall and Marshall (Reference Marshall and Marshall1879: 117) and Marshall (Reference Marshall1891: 284–90), and demonstrated by large-scale cross-sectional census analysis (Bennett et al. Reference Bennett, Harry, Carry, Piero and Gill2019b: 94–99, 142–50), sectors offered differing opportunities to sole traders and established businesses, reflecting their different competitive conditions, extent of market entry barriers, and capital needs. The contemporary census coding, now captured in I-CeM, gives 797 occupation categories (Schürer and Higgs Reference Schürer and Edward2014). These only imperfectly match business sectors, as criticized by contemporaries (e.g., Booth Reference Booth1886) and by modern researchers (e.g., Armstrong Reference Armstrong and Wrigley1972). To overcome this, the BBCE database offers a sector coding to 13 business sectors, which are aggregated to be approximately equivalent to an aggregation of modern SICs at a one-digit level.Footnote 15 Nonfarm and farm aggregates are estimated separately. The base sector for nonfarm is manufacturing, which had one of the lower switching rates for employers.
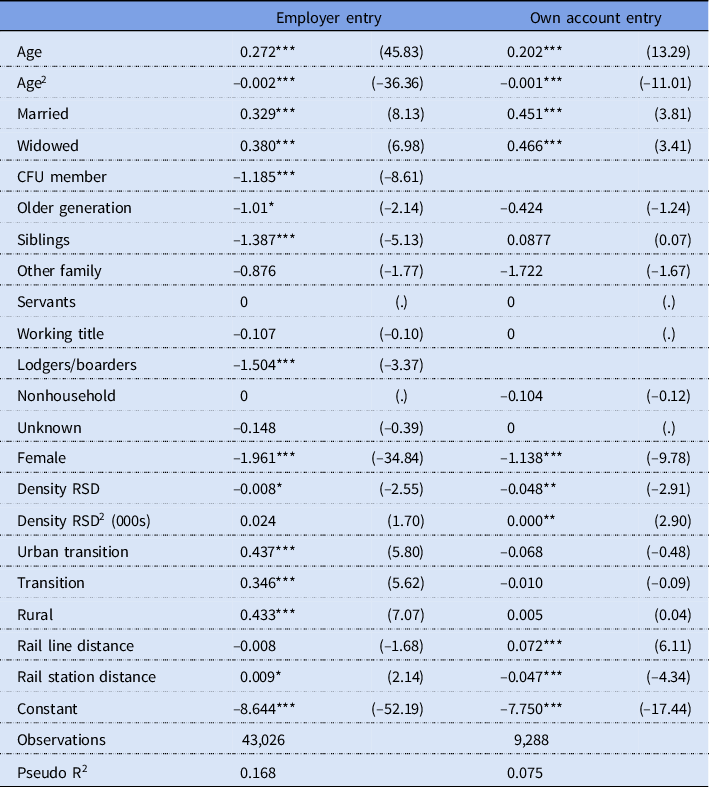
Nonfarm Proprietors
Entry by nonfarm employers and own account is compared in tables 4 and 5. The estimates are developed separately for employers (left columns) and own account proprietorship (right columns), and for entry (table 4) and exit (table 5). For entry to being employers in table 4, age and age squared are highly significant. They capture the rise and then fall in the frequency of being a proprietor and, as expected from figures 3 and 4, they confirm the strong statistical significance of age as a key factor in switching choices. Among the other demographic variables, being female significantly reduced the level of switching (compared to the male base), whilst being married or widowed significantly increased the frequency of switching (compared to being single), and more so for the widowed than married. These effects confirm the expectations from previous literature that entry was more likely into proprietorship for males, and more likely with the additional established resource support of a spouse. However, with the death of a spouse, entry into business increased even higher, probably as a result of two interacting influences: necessity for income for the survivor, and in many cases the only means of business continuation, especially for the role of widow(ers). In comparison to sex and marital status, the only other significant social or demographic variable is CFU status. Being an offspring of a family unit (compared to the head as base) was strongly negative for switching into proprietorship, confirming that family members were less likely to be the named employer where there was a surviving parent as head. As suggested by Crossick (Reference Crossick1978) and Anderson (Reference Anderson1971, Reference Anderson1988) this could be rather exploitative, holding back offspring who had otherwise no alternative but the leave home, though of course these sons and daughters might eventually take over a business. It is also reflects the fact that it was rare for children to run their own business while living with parents (Smith et al., Reference Smith and Bennett2020) and more common to set up their own household. Being another relative or nonrelative in the household does not appear significant influence on entry; this is a contrast to the wider role played in many family businesses prior to entry as proprietor found by Davidoff (Reference Davidoff2012), though this was based only on case studies.
Table 4. Logit estimates for entry to being nonfarm proprietors (1851–61)
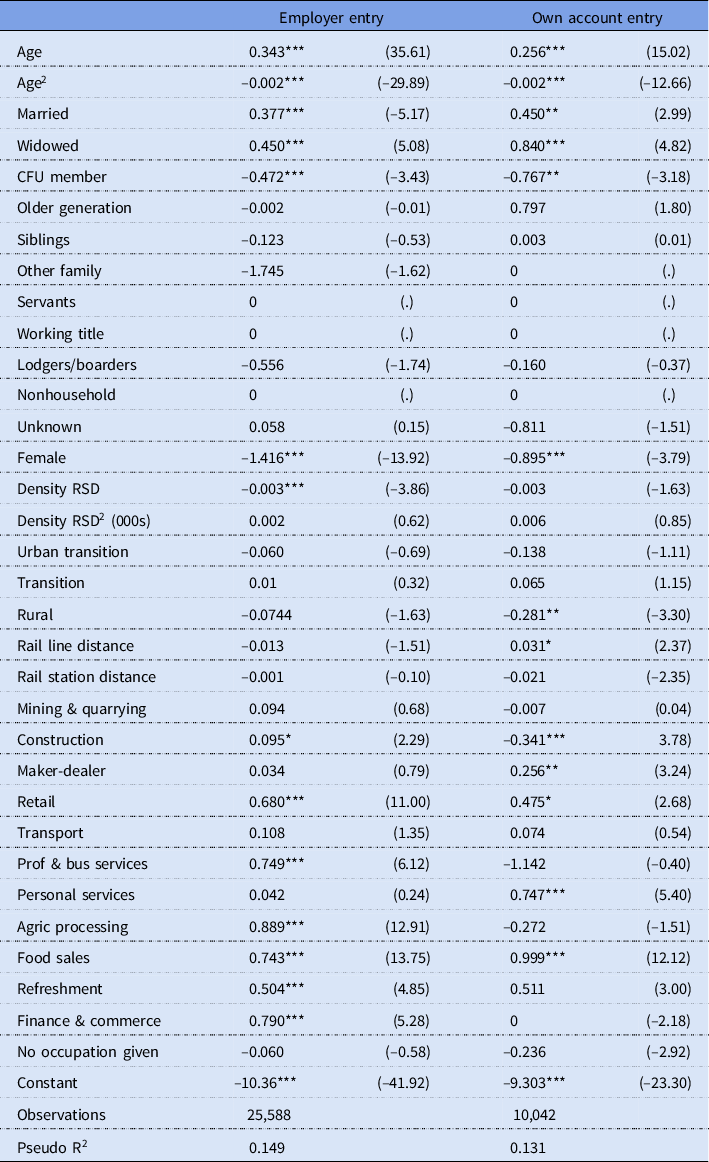
Note: Coefficients, with z-values in brackets; base categories: single, head, male, urban, manufacturing.
* p < 0.05; ** p < 0.01; *** p < 0.001.
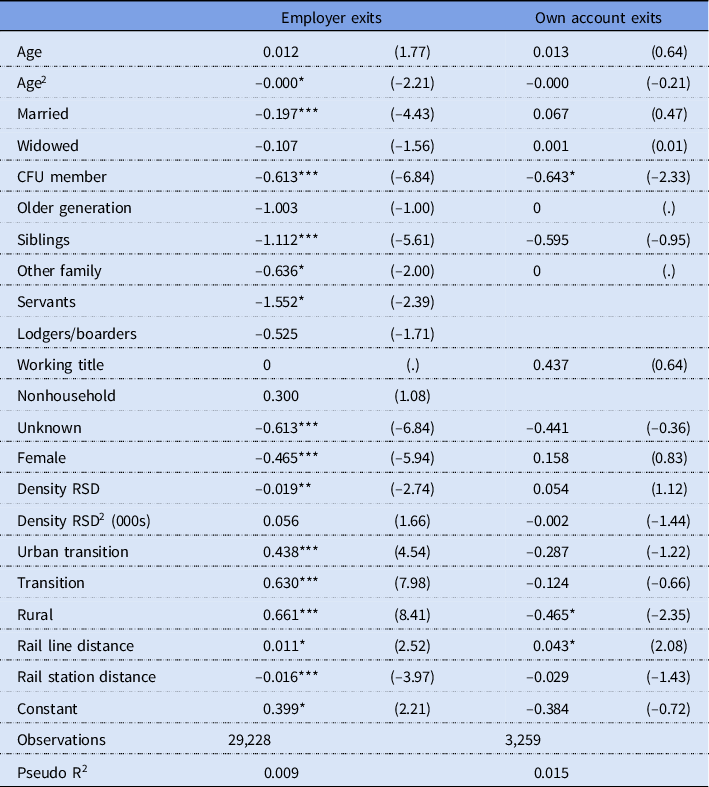
Table 5. Logit estimates for exit from being nonfarm proprietors (1851–61)
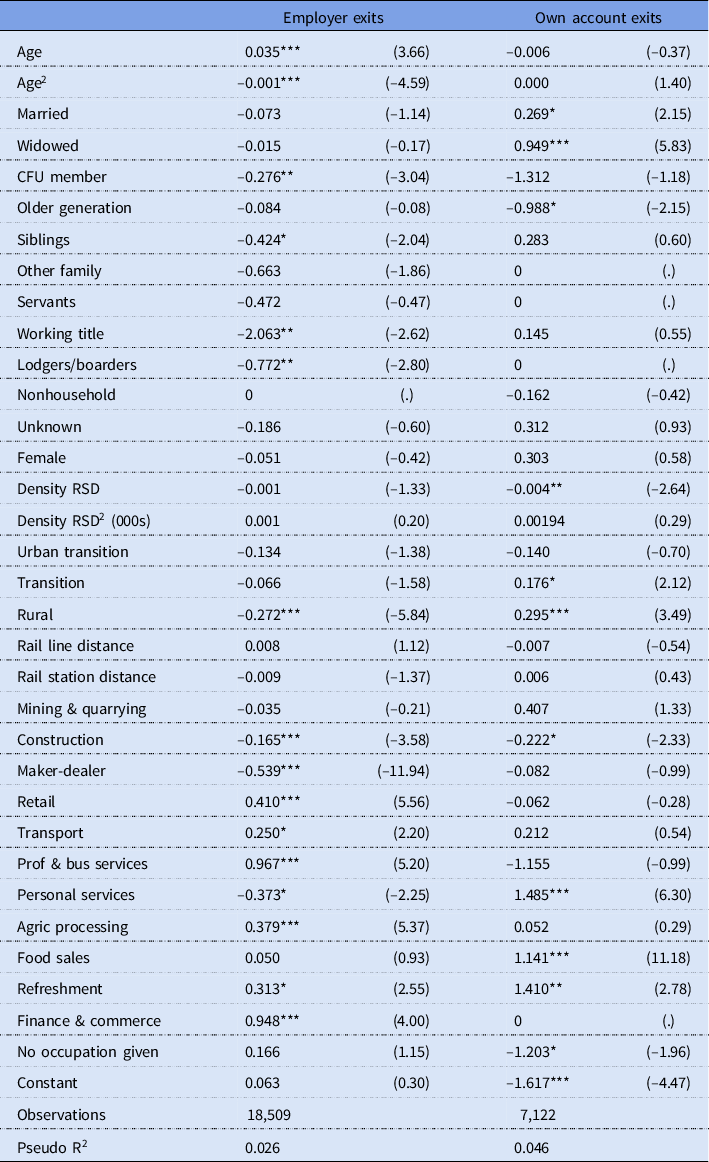
Note: Coefficients, with z-values in brackets; base categories: single, head, male, urban, manufacturing.
* p < 0.05; ** p < 0.01; *** p < 0.001.
Locational opportunity appears from this analysis to have rather restricted influence on nonfarm business entry. There is a strong negative influence of high population density for employers that indicates the powerful effect of waged alternatives in larger and denser locations such as towns and cities which reduced the incentives to establish a business. The broader differences between urban and rural areas were of little significance.
The effect of age on entry to own-account traders was marginally lower than for employers, but married and widowed status had larger effects. This confirms other analyses based on cross-sections of the census (Bennett et al. Reference Bennett, Harry, Carry, Piero and Gill2019b; van Lieshout et al. Reference van Lieshout, Harry, Piero and Bennett2019), that own account was more accessible at most ages, was particularly available to women, especially married women, and in some sectors offered many more women a route to proprietorship that men, though this was often stimulated by necessity of increasing family income. Switching into own account was less likely from being a CFU member; that is they usually sought internal support to a family business as employees or wage work elsewhere. There were minor effects of rural context reducing own account market entry, but as with employers opportunity the effects were small.
One of the key aspects of the analysis in table 4 is the strong contrasts between sectors, and between own account and employers, as expected from Marshall’s observations and from previous cross-sectional analysis (Bennett et al. Reference Bennett, Harry, Carry, Piero and Gill2019b). Employer entry was higher for most sectors than the manufacturing base, indicating significantly more ready market entry into six or seven sectors for employers, and into two or four (depending on significance level) for own account. For employers the service sectors were far more open to entry for those employing others than the manufacturing base. Significant sector effects overlap between own account and employers only for general retail and food sales—the two main retail activities—indicating these had similar entry possibilities at all scales (starting a shop was almost as easy as a sole proprietor as taking on employees, and easier for food sales). Otherwise own account mainly had significantly higher entry for personal services, whereas entry to construction was strongly less likely. These are all comparisons between switching and staying in a current status in that sector. Hence, the absence of switching of status from own account for construction indicates strong stability: these individuals changed status less than own-account manufacturers as there was little alternative in that sector to being own account.
Exits by nonfarm employers and own account in table 5 show some strong contrasts with entry. Age was still strongly significant for employers, but with a much flatter profile over the cohorts: exiting increased less steeply with age than entry (q.v. figure 3). Own-account exit was not significantly affected by age: it occurred at any point, depending on opportunity/need. Combined with the entry effects, this shows that own account was a more flexible choice, entered with increasing frequency as age increased, but with exits occurring at any time. Marital status was not significant for employer exit, but strongly positive for own account, especially for widowed. Thus although entry was high for the widowed, exit was also high suggesting it was often unstable as a career choice, was difficult to sustain the business, and that some were “caretakers” of a business that was passed to others at a later date (Davidoff Reference Davidoff2012; Wall Reference Wall2002). Women had no significant differences of exiting frequency compared to men. This is an important contrast with market entry. It supports the arguments that women suffered barriers to accessing occupations, but once in them their profile of experience differed little from men (Aston and Bishop Reference Aston and Bishop2020; Davidoff Reference Davidoff2012; Kay Reference Kay2009; Nenadic Reference Nenadic1991): business was business whatever the sex of the proprietor, as supported by modern analysis (Marlowe et al. Reference Marlow, Collette and Sarah2009). More relationships within the household were significant for exit. For employers, CFU status, sibling, boarder, and working title were all significantly less likely as categories for a proprietor to exit into than remaining as head. “Working title” is the I-CeM term for being an employee or assistant in the family business: proprietors were very unlikely to exit into such positions.
Locational opportunity generally played a minor role on exit as it did on entry, with no rail access effects significant. Density effects, which indicate different opportunities from greater or lesser locally concentrated markets negatively affected own account exit. As to be expected small businesses were more sustainable where there was larger market potential. This was the converse of rurality that increased own-account exiting as the markets were smaller and generally being eroded by the expansion of larger firms. Employer exits, however, were reduced by rurality; once established, a rural business that was significant enough to employ others tended to be sustainable and reduced the scope for others to enter, particularly small own-account traders. This indicates some effects of local monopolies as suggested by Marshall, with the lack of rail effects confirming that accessibility did not create significant pressures to exit.
Sector effects were important and contrasting. Employer exits were more frequent and higher than manufacturing in four sectors, but less in three. Own-account exits were strongly significant and positive in only three. It is important to note that own account had higher positive exit significance than employers in personal services, indicting increasing competition from larger enterprises in activities such as laundries, hairdressing, doctors, and school proprietorship. This is also suggested in maker-dealing where the coefficient is much higher for continued trading for employers than for own account. This confirms Marshall’s (Reference Marshall1891: 288) view that whilst the small manufacturer of shoes, dress, and other items who also retailed continued to survive, they were under increasing pressure from larger manufacturers and retail branch networks.
The logit estimates are important confirmation of previous analysis at aggregate sector level that has not had the benefit of individual career tracking (e.g., Clapham Reference Clapham1932; Checkland Reference Checkland1964; Lee 1971, Reference Lee1981). Sectors such as refreshments, maker-dealing, retailing, and personal services, which had very low entry costs and barriers, all show high entry rates compared to manufacturing, for both employers and own account. They also had a high and rapidly increasing share of employment and businesses (Lee 1971: 60–6; Bennett et al. Reference Bennett, Harry, Carry, Piero and Gill2019b: 94–100; 2021). Sectors with high exit costs, low elasticity, or high sunk capital and skills had higher stability or inertia from incumbency. These were mainly in manufacturing that usually had plant and physical investment, so that few sectors had lower exit levels than the manufacturing base. Those that did have significantly lower employer exits were maker-dealers, personal services, and construction. This reflected rapid expansion responding to population growth even though there were structural shifts of sector growth toward large manufacturers and retail networks; that is as Marshall observed, the maker dealer and many small firms could survive whilst nevertheless experiencing increasing competition.
Farm Proprietors
Farm proprietorship was rapidly shedding labor through the impact of major technological changes, accelerated by the agricultural depression of the 1870s. Over 1851–61, covered by the table 6 record-linkage, farm employer numbers were almost static but own account increased (Montebruno et al. Reference Montebruno, Bennett, Carry, Harry and Max2019). Entry for both types of proprietor had similar demographic effects, though lower coefficients, than for nonfarm. Married and widowed status again had much higher entry than single people (though slightly lower than nonfarm), with women having much lower rates (and much lower than nonfarm). Hence, as expected from the stable employer numbers, high levels of incumbency, and challenging conditions for farming, market entry was generally less attractive and more difficult than nonfarm, and especially for women (as also shown in figures 1–2). As a result, as to be expected, household members generally had significantly lower farm entry rates than nonfarm employers, with the comparable CFU entry very much lower.
Table 6. Logit estimates for entry to being farm proprietors (1851–61)
Note: Coefficients, with z-values in brackets; base categories: single, head, male, urban, manufacturing.
* p < 0.05; ** p < 0.01; *** p < 0.001.
Locational opportunity was generally much more significant for farm market entry than nonfarm, which shows that the effects of urban expansion and improved rail access were mainly influencing farming business opportunities. Entry fell as population density fell, as expected, but for employers this was only marginal compared to the significantly higher entry rates for all areas than the urban base. This reflects the fact that farms were being squeezed out of the remaining spaces within urban areas, but were buoyed by the rising population demands in all other situations. Both types of transitional areas were within direct market access of towns by horse and cart, so that direct selling from farm to consumer increased with urbanization, especially in dairy produce (Schwartz Reference Schwartz2010; Winstanley Reference Winstanley1996). Rail was also making many remoter rural areas accessible through milk trains, cattle wagons, increasingly sophisticated rail collection centers, and expanded wholesale facilities (Schwartz Reference Schwartz2010; Simmons Reference Simmons1986). However, rail distance, though not significant for employers, was highly significant for own account entry. This worked both ways, favoring entry to farms that were more remote from lines and reducing farm entry where there was a station because of increased competition from other sectors of activity, as indicated for refreshments by Simmons (Reference Simmons1986) and Davidoff (Reference Davidoff and Davidoff1995), and for agricultural processing by Clapham (Reference Clapham1932) and Checkland (Reference Checkland1964).
Exit from farm proprietorship was generally influenced by the same factors as entry, as shown in table 7, though age was now mostly insignificant, married status favored incumbency, and females once into farm proprietorship were much less likely to leave than men (q.v. figure 4). Locational effects were generally in the opposite direction to entry, indicating higher entry but lower exit rates for employers in denser areas, and in transition and rural areas than urban. Proximity to rail lines increased employer exit, whereas stations reduced exit. If a farm was still viable improved access often increased its income by diversification into a portfolio of business activities, of which accommodation, refreshments, and carriage were easy options for most farms using their existing buildings and carts (Radicic et al. Reference Radicic, Bennett and Gill2017; Schwartz Reference Schwartz2010; Winstanley Reference Winstanley1996).
Table 7. Logit estimates for exit from being farm proprietors (1851–61)
Note: Coefficients, with z-values in brackets; base categories: single, head, male, urban, manufacturing.
* p < 0.05; ** p < 0.01; *** p < 0.001.
Because of the limitations of the 1871 data, we have focused on 1851–61, which has the fullest data linkages. However, this can be tested for robustness against the broader linkage data for the whole period 1851–81 as a longitudinal cross-sectional time-series, reported in the appendix for panel estimation (see online supplemental materials). This tracks the same variables over time allowing joint estimation for all periods. It allows whole period 1851–81 estimation that can confirm the persistence of the same explanatory factors of proprietor choice we have estimated for the one period 1851–61. The results are very similar to those reported previously for all the same variables that can be included in the panel estimates. This confirms the robustness of the 1851–61 results, and their broad applicability to the whole period.
Further checks of robustness were made by estimating cross-sections for all years, and with solely the tagged data compared with the combined tagged and fully supplemented results shown in tables 4–7. These are not reported because of limited space, but were fully consistent in coefficient signs and most significance levels for all estimates made. Thus, although we have focused mainly on the 1851–61 links, and the fully supplemented data, they appear to be representative of all links for the period. However the limitations of the 1871 data prevent strong inferences on time trends. The overall significance of the various estimates is relatively low (from pseudo R2), which was expected because of the high variance in the data due chiefly to respondent sector reporting, as well as any defects of nonresponse supplementation. The robustness checks confirm that despite high variance, consistent estimation is possible that allows reasonably firm conclusions across the whole period 1851–81.
Conclusion
This article has shown the potential for linkage between the digital records of the nineteenth-century British censuses using the I-CeM, and the BBCE database of the proprietor population. This allows us to demonstrate that the British Victorian economy of this period was broadly accessible and open to those seeking proprietorship opportunities. Although interpretations are constrained by the 10-year gaps between censuses, switching into and out of proprietorship from worker status appears to have been frequent and possible in many sectors. For example, over the 10 years 1851–61 for the nonfarm sectors, 36 percent of employers had entered from worker status, and 15 percent from own account; entries into own account were 43 percent from workers. Incumbency and inertia was also high: 37 percent of employers and 25 percent of own-account proprietors were in that same status 10 years earlier (51 percent for combined proprietorship incumbency, with 49 percent switching in/out of proprietorship). Farm incumbency was even higher: 69 percent for employers and 32 percent for own account (75 percent combined, with 25 percent switching in/out of proprietorship). There is some evidence of a “ladder” between worker to own account to employer status, but moving directly into employment from worker status was as frequent or more frequent than from own account. Similarly, the evidence of a progressive disengagement from employer to own account to worker before retirement appears to be a minor aspect of career changes.
The new estimates also allow the dynamism of the Victorian economy to be compared for the first time with modern entry rates to self-employment. Combined employer and own account entry was only 2–3 percent per year in 1990s Britain (Parker Reference Parker2012: 40–52). This equates to about 25 percent for decadal changes (assuming no compounding), far lower than the 49 percent switching found into nonfarm sectors in the 1850s–1860s. The relative openness of Victorian entrepreneurship echoes Marshall’s (Reference Marshall1919: 92–3) observation that the mid-nineteenth century had “an unprecedented combination of advantages [that] enabled businessmen to make money even when they were not throwing themselves with energy” into their business. It also confirms Cain and Hopkins’s (Reference Cain and Hopkins1993) view that the period analyzed covered one of the highpoints of the British economy. Our results present a picture of a more economically open economy than suggested by Miles (Reference Miles1999) or Mitch (Reference Mitch, Miles and Vincent1993). We broadly confirm Long’s (Reference Long2013) study, also based on record linkage, of a “surprising” level of social mobility in Victorian Britain. The high proportion of people moving in and out of employer status also suggests that Morris’s (Reference Morris2005) suggestion that stable middle-class lifestyles was the preserve of a small elite that applied only to the largest and most wealthy employers should be revised; however, for many, such status was indeed relatively short-lived, especially for the own account; as Morris notes the opportunities to cement that position through capital accumulation were often slim. Indeed own-account proprietorship is confirmed as a relatively ephemeral and short-lived career step for many, often later in life (especially for women), but offering important opportunities to expand family income, particularly among married women and the widowed.
This article also demonstrates that the main motivations for entering self-employment were closely aligned with those found for modern entrepreneurship, indicating important continuities over time that have never before been open to comment. Internal motivations deriving from demography were an important element of career change in the nineteenth century, reflecting their first ranked frequency in modern analysis. Age as a surrogate for life-cycle effects was particularly important, showing a clear career progression to more frequent levels of proprietorship up to middle years and then declining in later life. Married and widowed individuals were more likely to enter and less likely to exit proprietorship than single people who were mainly waged. Sex was very important in restricting women’s entry, spreading entry over a wider range of years with a degree or irregularity; but sex was not significant on exit, as agued in many smaller scale studies of female entrepreneurship (e.g., Aston Reference Aston2016; Davidoff Reference Davidoff and Davidoff1995, Reference Davidoff2012; Kay Reference Kay2009; Nenadic Reference Nenadic1991, Reference Nenadic1993). An important finding is that once into business, women’s proprietorship development in the nineteenth century was similar to men’s with no significant differences in exit frequencies, once other variables (particularly sector) are taken into account. This reflects women’s modern business experiences (Marlowe et al. Reference Marlow, Collette and Sarah2009). Support of family was also a key feature, but CFU position as an offspring generally reduced the frequency of entry. This gives some evidence of the potentially exploitative effects of the family observed by Crossick (Reference Crossick1978) and Anderson (Reference Anderson1971); many individuals had to wait a long time to take over the proprietorship of their parents’ business.
Sector was generally the next most significant aspect of career changes after age, which echoes its third-ranked frequency in modern surveys, and its critical importance observed in cross-sectional analysis (Bennett et al. Reference Bennett, Harry, Carry, Piero and Gill2019b: 142–50). Contrasts between sectors generally reflect expected effects of entry barriers and the benefits of incumbency. Compared to manufacturing most sectors had easier market entry for employers because much lower levels of capital and start-up costs were required; particularly retail, professional services, agricultural processing, food sales, refreshment, and finance and commerce. However, for own account, easier market entry was mainly limited to retail, food, and personal services. Exits show some effects of large firm incumbency and growth. For example, own-account proprietors had higher exit significance than employers in personal services, indicting increasing competition from larger enterprises, whilst in maker-dealing there were similar but much smaller negative effects. Whilst small maker-dealers were under increasing pressure from larger firms, they continued to survive in this period, as Marshall argued. It was in later editions of his 1891 text that Marshall (Reference Marshall1920) changed his view that competition was displacing more of these smaller maker-dealers, as taken up by Chandler (Reference Chandler1962): when economies from mechanization of stitching and stamping offered scale effects to large firms that were difficult to match by small local crafts.
Examples of Marshall’s contemporary observations on maker-dealers and small traders are numerous. George Beken, a saddle and harness maker in the growing medium-sized town Ashford, Kent (population 8,230 in 1861, 12,369 in 1881), increased his business from one apprentice in 1861 when he was 29, to two men in 1871, and to three apprentices in 1881. Saddle manufacture was one of the lowest profit businesses of the time, but was still relatively immune from machine competition. Joseph Blacker in Emley village in the West Riding was a joiner employing one boy (presumably his son) in 1861 when aged 41, employed one man in 1871, and had expanded to two men and one boy and added a small farm of 11.5 acres in 1881 when he was 61; he expanded and diversified as opportunity offered in a large but relatively remote village (population 1,406 in 1881) where he commanded a virtual monopoly on joinery. Similarly, John Pleass a carpenter of Cheddon Fitzpaine, Somerset, own account in 1861, employed one man and one boy in 1871, and reverted to own account in 1881, adapting as his family and other circumstances demanded in a relatively buoyant village of 295 people in the expanding fringe of the town of Taunton (population 16,614 in 1881).
Opportunity, and its converse, necessity for entering self-employment, of course are reflected in sector and internal variables but have been mainly measured in this analysis through location. This shows that population density significantly reduced entry in locally concentrated markets where alternative waged employment was readily available, but differences in urban, rural, and transitional locations were only partly significant for nonfarm sectors. Differences in access to rail lines and stations also provided only marginal opportunities for nonfarm business entry. However, for farm businesses, density and urban–rural contrasts were all highly significant for employer entry and incumbency/exit. They were only marginal significant for own account, however; except that, in contrast to employers, rail access was more important for own account usually negatively—by increasing competition and reducing business potential. Exits from employer status, and some estimates from own account, indicate that once established many businesses were significant enough to limit access for others through effects of local monopoly, particularly in more rural areas.
The relatively small effects for rail, and its main influence being for farms, confirms the findings by Simmons (Reference Simmons1986) and Schwartz (Reference Schwartz2010) that by 1851 most of the country was sufficiently accessible that business impacts mainly derived from technical and managerial improvement to rail rather than access to lines: new waggons and specific services for farm products such as development of collection sites. Hence, although Britain was becoming an integrated market, we confirm the observations by Marshall (Reference Marshall1891), Lee (1971, Reference Lee1981), and Crafts and Mulatu (Reference Crafts and Abay2005) that some important local market barriers/monopolies continued, especially for farm businesses.
This article focuses on linkage to give a whole population overview, but the deposited database of all business proprietors, and separate downloads of the linked individuals, can be used for more detailed case studies and expanded to investigate beyond first-order linkage to wider family and social networks. The results here indicate a level of mobility between employment statuses in the nineteenth century that offers a rich field for further study.
Supplementary material
To view supplementary material for this article, please visit https://doi.org/10.1017/ssh.2021.48
Acknowledgments
This research was supported by ESRC project grant ES/M010953: “Drivers of Entrepreneurship and Small Businesses.” Data for 1881 was supported by Leverhulme Trust grant RG66385: “The long-term evolution of Small and Medium-Sized Enterprises (SMEs).” Coding the 1871 census data was supported by the ESRC and Isaac Newton Trust research grant 17.07(d): “Business Employers in 1871.” The database used for 1851–1911 derives from an updated version of Kevin Schürer and Edward Higgs (Reference Schürer and Edward2014) The Integrated Census Microdata (I-CeM). UKDS, SN-7481. We are grateful to Kevin Schürer, Alice Reid, and other contributors for advice and permission to use this version. The figures were drawn by Phil Stickler. We are grateful for referee comments on earlier versions of the text and feedback at the EBHA conference, Rotterdam, 2019.


 Open access