
Abstract
One of the major drawbacks of cheminformatics is a large amount of information present in the datasets. In the majority of cases, this information contains redundant instances that affect the analysis of similarity measurements with respect to drug design and discovery. Therefore, using classical methods such as the protein bank database and quantum mechanical calculations are insufficient owing to the dimensionality of search spaces. In this paper, we introduce a hybrid metaheuristic algorithm called CHHO–CS, which combines Harris hawks optimizer (HHO) with two operators: cuckoo search (CS) and chaotic maps. The role of CS is to control the main position vectors of the HHO algorithm to maintain the balance between exploitation and exploration phases, while the chaotic maps are used to update the control energy parameters to avoid falling into local optimum and premature convergence. Feature selection (FS) is a tool that permits to reduce the dimensionality of the dataset by removing redundant and non desired information, then FS is very helpful in cheminformatics. FS methods employ a classifier that permits to identify the best subset of features. The support vector machines (SVMs) are then used by the proposed CHHO–CS as an objective function for the classification process in FS. The CHHO–CS-SVM is tested in the selection of appropriate chemical descriptors and compound activities. Various datasets are used to validate the efficiency of the proposed CHHO–CS-SVM approach including ten from the UCI machine learning repository. Additionally, two chemical datasets (i.e., quantitative structure-activity relation biodegradation and monoamine oxidase) were utilized for selecting the most significant chemical descriptors and chemical compounds activities. The extensive experimental and statistical analyses exhibit that the suggested CHHO–CS method accomplished much-preferred trade-off solutions over the competitor algorithms including the HHO, CS, particle swarm optimization, moth-flame optimization, grey wolf optimizer, Salp swarm algorithm, and sine–cosine algorithm surfaced in the literature. The experimental results proved that the complexity associated with cheminformatics can be handled using chaotic maps and hybridizing the meta-heuristic methods.
Introduction
The prediction and analysis of molecules are essential tasks in cheminformatics, which use methods from mathematics and computer science to enhance their performance. The implementation of these methods depends on databases. The processes that generate most of the affectations are the storage and retrieval of molecular structures and properties (e.g., pharmacogenomics data). Typically, the behavior of the compounds can be investigated using molecular analysis. The molecular analysis helps to develop and test molecules for decreasing the effects of specific diseases1. One drawback associated with cheminformatics is the exponential increment of the search space owing to features in the dataset2. However, cheminformatics is still being widely used in drug design, where the protein structures are estimated and the interactions of molecules and biological targets can be determined by considering the basis of the cellular processes1.
A drug is an organic molecule that can inhibit the effects of a disease. The main points for drug design and discovery are: (1) structure optimization3, (2) establishment of the quantitative structure-activity relationship (QSAR)4, and (3) docking of the ligand into a receptor denovo design of ligands5. Thus, drug design and discovery aim to develop new medicines based on the knowledge about a biological target6. The features contained in the datasets are essential for cheminformatics, but due to the big amount of generated information, it results in complicated to handle them in most of the cases7.
Generally speaking, feature selection (FS) is an important preprocessing step for performance enhancement in data mining. FS is especially used for classification and regression problems. FS approaches are widely used to eliminate the irrelevant and redundant features from the original dataset, therefore, the dimensionality of the dataset is reduced8. As was mentioned cheminformatic datasets are huge and the use of FS is mandatory in order to identify the best subset of information. Typically, the FS approaches can be divided into wrapper and filter methods9. The wrapper-based approaches often cope with the filters, because the proposed subset of features is directly assessed using feedback from the learning algorithm as to its accuracy10,11. In the wrapper techniques, the option of using machine learning algorithms is wide open, then it is possible to find implementations of the most popular algorithms including support vector machines (SVMs) and K-nearest neighbor (KNN), among others. Nevertheless, in order to find an efficient FS technique, researchers have put significant efforts, particularly those working with metaheuristic algorithms (MAs). In this regard, a wide spectrum of MAs are either used alone12 or with others to form hybrid methods13 for efficient results, since a comprehensive list can be easily found in this review14.
Due to the success of MAs in solving complex problems15, they can be employed in cheminformatics. Harris hawks optimization (HHO) is a recent method introduced in16. Apart from its novelty, HHO is a powerful optimization tool that is robust, exhibits smooth transitions between exploration and exploitation, and provides competitive results to complex problems17. However, there is no perfect MA, and HHO has some disadvantages. In HHO, exploration, and exploitation are unbalanced and it has premature convergence when the problems are highly multimodal18. In this context, the cuckoo search (CS) algorithm is inspired by the breeding behavior of the cuckoo birds. It has been introduced as an alternative method for global optimization19. Since its publication, CS has been widely used by the scientific community20,21,22. In addition, CS is applied for secondary protein structure prediction23. Generally, the advantages of CS are that it ensures global convergence and maintains a well balance between exploration and exploitation24. The use of L\(\acute{e}\)vy flights in CS permits them to perform a successful global search, which is reflected in their capabilities to obtain space using sub-optimal solutions. However, chaos is part of the nonlinear dynamic systems. Chaos is described as a behavior of complex systems, where small, random, and unpredictable changes can be observed over time with respect to the initial conditions. The concepts of chaos are helpful in optimization because they help to generate accurate solutions. Chaos is commonly used instead of random distributions to improve MA performance25. The inclusion of chaotic maps in optimization methods increases the diversity of solutions by avoiding local solutions and speeding up the convergence.
In the basic HHO, the control energy parameter E, as well as the position vectors, called \(X_{rand}\) and \(X_{rabbit}\) plays the main role in avoiding the local optima and balancing the exploitation and exploration. Therefore, in this study, we introduce a hybrid method that combines the benefits of HHO with those of CS and chaotic maps (C); this algorithm can be referred to as CHHO–CS. The concept of the CHHO–CS is to enhance the search process of HHO to obtain near-optimal solutions. To be specific, a new formulation of the initial escape energy \(E_{0}\), escaping energy factor E and the initialization of solutions with chaotic maps are presented. The inclusion of chaotic maps may avoid the local optima and accelerates the convergence. Additionally, in CHHO–CS method, CS is used to control the position vectors called \(X_{rand}\) and \(X_{rabbit}\) of the basic HHO. The objective (or fitness) function is then shared in the entire optimization process. It means that the CS works with the same objective function used by HHO. Finally, the CHHO–CS is combined with the support vector machine (SVM) to select the appropriate chemical descriptors (features) and compounds activities. In addition, this study investigates the influence of the chaotic map with respect to the cheminformatics problems. Several experiments and comparisons have been conducted with respect to different versions to select the version which provides the most accurate solutions. Furthermore, twelve datasets are used to evaluate the efficiency of CHHO–CS compared to seven well-known metaheuristic algorithms, including: HHO16, CS19, particle swarm optimization (PSO)26, moth-flame optimization (MFO)27, grey wolf optimizer (GWO)28, salp swarm algorithm (SSA)29, and sine–cosine algorithm (SCA)30. The CHHO–CS method achieves the best results of classification accuracy and the number of selected features when compared with the remaining competitor algorithms. The major contributions of this work are as follows:
-
1.
A new CHHO–CS method is proposed based on combining HHO with the benefits of CS and chaotic maps. CS and chaotic maps (C) are used to enhance the limitations of the original HHO.
-
2.
The SVM classifier is utilized in the CHHO–CS to select the chemical descriptors and chemical compound activities.
-
3.
Several experiments are conducted on various datasets to confirm the superiority of the proposed CHHO–CS method in combination with SVM compared with other metaheuristic algorithms.
The rest of this paper is structured as follows. Literature review is presented in “Related work” section. “Materials and methods” section introduces the necessary material and methods used in the study, such as QSAR, SVM, HHO, the theory of Cuckoo search (CS) algorithm, and the chaotic maps. Meanwhile, “The proposed CHHO–CS” section explains the pre-processing process and introduces the proposed CHHO–CS method. The experimental result and discussion are presented in “Results” section. Finally, the conclusion of the paper is provided in “conclusion” section.
Related work
A previously conducted study has investigated drug design and discovery, exhibiting differences in efficiency31. The available tools used to identify chemical compounds which are known as computer-aided drug design (CADD) allows the reduction of different risks associated with the subsequent rejection of lead compounds. CADD has an important role and exhibits high success rates for the identification of the hit compounds32.
The CADD methodology has two related concepts: ligand/hit optimization and ligand/hit identification. Methods hitting identification/optimization are based on the efficiency of the virtual screening techniques used to achieve the target binding sites. They are known to dock huge libraries for small molecules including chemical information or ZINC database, to identify the compounds based on the pharmacophore modeling tools (docking) to predict the optimal medicines and proteins obtained using the information from the ligand. The Pymol software33 is useful in selecting the optimal ligand as the optimal drug, and the AutoDock software is employed to calculate the energy5. Thus, genetic algorithms (GAs) are applied in the AutoDock software and AutoDock Vina34. Also, in35, fuzzy systems have been introduced to address the optimization of the chemical product design. Another important method for drug design called QSAR is derived from CADD to extract the description of the correlation among different structures from a set of molecules and the response to the target36.
Drug design and discovery are the main aspects of cheminformatics37. Cheminformatics can be divided into two sub-processes. The first process considers three-dimensional information; this process is called encoding. The second process, which is called mapping, comprises building a model using machine learning (ML) techniques38. In the encoding process, the molecular structure is transformed based on the calculation of the descriptors36. Moreover, the mapping process aims to discover different mappings created between the feature vectors and their properties. In cheminformatics and drug discovery, the mapping can be performed using various machine learning2,39.
Chaotic maps are random-like deterministic methods that constitute dynamic systems. They have nonlinear distributions indicating that chaos is a simple deterministic dynamic system and a source of randomness. Chaos has random variables instead of chaotic variables and absolute searches can be performed with higher speeds when compared with stochastic search methods mainly based on probabilities. In a previous study40, chaotic maps have been considered to improve the performance of the whale optimization algorithm and balance the exploration and exploitation phases. Also, a grey wolf optimizer and flower pollination algorithm have been enhanced using ten chaotic maps to extract the parameters of the bio-impedance models41. Meanwhile, in42, the grasshopper optimization algorithm with chaos theory is employed to accelerate its global convergence and avoid local optimal. In43 the schema of the CS algorithm based on a chaotic map variable value is introduced.
In fact, the methodology of hybridizing MAs is widely used in different domains of optimization other than feature selection44. In this vein, combinations of different ML techniques and MAs (e.g., search strategies) have been applied in many fields with modifications and hybridization to benefit from one technique in uplifting search efficiency. For instance, the salp swarm algorithm combined with k-NN based on QSAR is an interesting alternative, which provides competitive solutions45. Also, Houssein et al.37 introduced a novel hybridization approach for drug design and discovery-based hybrid HHO and SVM. However, in this study, we applied hybridization to select the chemical descriptor and compound activities in cheminformatics. Particularly, this study proposes an alternative classification approach with respect to cheminformatics, termed as CHHO–CS-based SVM classifier, for selecting the chemical descriptor and chemical compound activities; the hybrid HHO and CS were enhanced based on the chaos (C) theory.
Materials and methods
In this section, we briefly discus the QSAR model, the basics of SVM, the original HHO, the original CS, and the chaotic map theory.
Quantitative structure-activity relationship
QSAR provides information based on the relation between the mathematical models associated with the biological activity and the chemical structures. QSAR is widely used because it can detect major characteristics of the chemical compounds. Therefore, it is not necessary to test and synthesize compounds. The inclusion of ML methods to study QSAR helps to predict whether the compound activity is similar to a drug-like activity in case of a specific disease or a chemical test. The compounds possess complex molecular structures, containing many attributes for their description. Some of the features include characterization and topological indices. Therefore, molecular descriptors are highly important in pharmaceutical sciences and chemistry4.
Support vector machine
SVM is an important supervised learning algorithm commonly used for classification46. SVM extracts different points from the data and maps them in a high-dimensional space using a nonlinear kernel function. SVM works by searching for the optimal solution for class splitting. The solution can be used to maximize the distance with respect to the nearest points defined as support vectors, and the result of SVM is a hyperplane. For obtaining optimal results, SVM has some parameters that have to be tuned. The C controls the interaction between smooth decision boundaries and the accurate classification of the training points. If the C has a significant value, more training points will be accurately obtained, indicating that more complex decision curves will be generated by attempting to fit in all the points. The different values of C for a dataset can be used to obtain a perfectly balanced curve and prevent over-fitting. \(\Gamma \) is utilized to characterize the impact of single training. Low gamma implies that each point will have a considerable reach, whereas high gamma implies that each point has a close reach. The implementation of SVM has been extended to cheminformatics. In this work, steps of SVM are presented in Algorithm 1, and its graphical description is presented in Fig. 1.


General structure of a decision boundary in SVMs classification.
Harris hawks optimization
HHO16 is a metaheuristic algorithm and is implemented as a competitive solution for complex problems. HHO is inspired by the attitude of Harris hawks, which are intelligent birds. This species possesses a mechanism that allows them to catch prey even when they are escaping. This process is modeled in the form of a mathematical expression, allowing its computational implementation. HHO is a stochastic algorithm that can explore complex search spaces to find optimal solutions. The basic steps of HHO can be obtained with respect to various states of energy. The exploration phase simulates the mechanism when Harris’s hawk cannot accurately track the prey. In such a case, the hawks take a break to track and locate new prey. Candidate solutions are the hawks in the HHO method, and the best solution in every step is prey. The hawks randomly perch at different positions and wait for their prey using two operators, which are selected on the basis of probability q as given by Eq. (1), where \(q<0.5\) indicates that the hawks perch at the location of other population members and the prey (e.g., rabbit). If \(q\ge 0.5\), the hawks are at random positions around the population range. For facilitating the understanding of HHO, a list of symbols used in this algorithm is defined as follows:
-
1.
Vector of hawks position (search agents) \(X_{i}\)
-
2.
Position of Rabbit (best agent) \(X_{rabbit}\)
-
3.
Position of a random Hawk \(X_{rand}\)
-
4.
Hawks average position \(X_{m}\)
-
5.
Maximum number of iterations, swarm size, iteration counter T, N, t
-
6.
Random numbers between (0, 1) \(r_{1}\), \(r_{2}\), \(r_{3}\), \(r_{4}\), \(r_{5}\), q
-
7.
Dimension, lower and upper bounds of variables D, LB, UB
-
8.
Initial state of energy, escaping energy \(E_{0}\), E
The exploration step is defined as:
The average location of the Hawks \(X_m\) is represented by:
where \(X_{i}(t)\) shows the positions in the iteration for each Hawk t and N identifies the total number of Hawks. The average position can be obtained by using different methods, but this is the simplest rule. A good transition from exploration to exploitation is required, here a shift is expected between the different simulated exploitative behaviors based on the escaping energy factor E of the prey, which diminishes dramatically during the escaping behavior. The energy of the prey is computed by Eq. (3).
where E, \(E_0\), and T represent the initial escape energy, the escape energy and the maximum number of iterations, respectively.
The soft besiege is an important step in HHO, it is shown if \(r\ge 0.5\) and \(|E|\ge 0.5\). In this scenario, the rabbit has all sufficient energy. When it occurs, the rabbit performs random misleading shifts to escape, but in the metaphor, it cannot. The besiege step is defined by the following rules:
where \(\Delta X(t)\) is the difference locations vector for all rabbits and for presently positions in the iteration t, and \(J=2(1-r_{5})\) Is the rabbit’s spontaneous jumping ability throughout the escaping phase. The J value varies randomly in each iteration to represent the rabbit’s behavior. In the extreme siege stage when \(r\ge 0.5\) and \(|E|<0.5\), The prey is exhausted and has no escaping strength. The Harris hawks are hardly circling the trained prey, and they can make an assault of surprise. For this case, the current position is changed using:
Consider the behavior of hawks in real life, they will gradually choose the best dive for the prey if they want to capture specific prey in competitive situations. This is simulated by:
The soft besiege presented in the previous Eq. (7) is performed in progressive rapid dives only if \(|E|\ge 0.5\) but \(r<0.5\). In this case, the rabbit has sufficient energy to escape and is applied for a soft siege before the attack comes as a surprise. The HHO models have different patterns of escape for a leap frog and prey movements. The Lévy flights (LF) are launched here to emulate the various movements of the Hawk and rabbit dives. Eq. (8) computes such patterns.
where S represents the random vector for size \(1\times D\) and LF is for the levy flight function, using this Eq. (9):
Here u, v are random values between (0, 1), \(\beta \) is the default constant set to 1.5.
The final step in the process is to update positions of the hawks using:
where Y and Z are obtained using Eqs. (7) and (8).
During progressive fast dives, HHO is also hard-pressed, where it may happen if \(|E|< 0.5\) and \(r<0.5\). Here the strength of the rabbit to escape is not sufficient and the hard siege is suggested before the numerous surprise attacks are made to catch and kill the prey. In this step, Hawks seek to reduce the various distances between their prey and the average position. This operator is explained as follows:
The values of Y and Z are proposed by using new rules in Eqs. (12) and (13), where \(X_{m}(t)\) is obtained using Eq. (2).
Cuckoo search
Fundamentally, Cuckoo Search (CS) is a metaheuristic algorithm used often for solving complex problems of optimization19. The cuckoo quest hypothesis is inspired by a bird known as the cuckoo. Cuckoos are interesting creatures not only because they can make beautiful sounds but also for their aggressive strategy of reproduction. In the nests of other host birds or animals, adult cuckoos lay their eggs. Cuckoo search is based on three main rules:
-
1.
Growing cuckoo lays one egg at a time and dumps the egg in a nest selected randomly.
-
2.
The best nest with high-quality eggs will be delivered to the next generation.
-
3.
The number of host nests available is set and the host bird finds the egg laid by a cuckoo with a probability \( \rho _{a} \in [0, 1]\).
The probability is based on these three rules such that the host bird can either throw away the egg or leave the nest and build a completely new nest. This statement may be approximated by a fraction \(\rho _{a}\) of n nests that are replaced by new nests (with new random solutions). The pseudo-code of CS is shown in Algorithm 2.

Chaotic maps
The majority of MAs have been established based on stochastic rules. These rules primarily rely on certain randomness obtained using certain distributions of probabilities, which are often uniform or Gaussian. In principle, the replacement of this randomness with chaotic maps can be beneficial because of the significant dynamic properties associated with the behavior of chaos. This dynamic mixing is important to ensure that the solutions obtained using the algorithm are sufficiently diverse to enter any mode in the objective multimodal landscape. These approaches, which use chaotic maps, are called chaotic optimization instead of random distributions. The mixing properties of chaos will perform the search process at higher speeds than traditional searches based on the standard probability distributions47. One-dimensional non-invertible maps will be used to produce a set of variants of chaotic optimization algorithms to achieve this ability. Table 1 presents some of the prominent chaotic maps used in this study. In addition, chaotic maps are obliged to result in 0/1 based on the normalization concept.
The main task of chaotic maps is to avoid the local optima and speed up the convergence. Here, it is important to mention that the nature of chaotic maps could also increase the exploration due to the intrinsic randomness. It is necessary to properly select the best map that helps each algorithm for a specific problem. Another important point to be considered is that chaotic maps do not take decision about the exploration and exploitation of the algorithms. However, along with the iterations, the chaotic values generated by the maps permit to change the degree of exploration or exploitation of the search space.
The proposed CHHO–CS
In this section, the proposed CHHO–CS is explained in detail, which is used to improve the search-efficiency of basic HHO. Typically, HHO has the characteristics of acceptable convergence speed and a simple structure. However, for some complex optimization problems, HHO may fail to maintain the balance between exploration and exploitation and fall into a local optimum. Especially in the face of high dimension functions and multi-modal problems, the shortcomings of HHO are more obvious. The optimization power of the basic HHO depends on the optimal solution57. In this paper, we introduced two strategies (Chaotic maps, and CS) to enhance the performance of the basic HHO.
The following points are worthwhile:
-
Chaotic maps influence: applying chaos theory to the random search process of MAs significantly enhances the effect of random search. Based on the randomness of chaotic local search, MAs can avoid falling into local optimum and premature convergence. In the basic HHO algorithm, the transition from global exploration to local exploitation is realized according to Eq. (3). As a result, the algorithm will easily fall into a local optimum. Hence, in the CHHO–CS algorithm, a new formulation of initial escape energy \(E_{0}\) and escaping energy factor E with chaotic maps are employed as demonstrated in Algorithm 3. Figure 2 shows the influence of a chaotic map on the energy parameter E obtained by the proposed method versus the basic HHO. Notably, the curve in the left-side linearly decreasing versus the proposed non-linear energy parameter defined by the new formulation of E, which clearly focuses on providing the search direction towards the middle of the search process to infuse enough diversity in population during the exploitation phase.
-
CS method influence: in the basic HHO, the position vectors \(X_{rand}\) and \(X_{rabbit}\) are responsible for the exploration step defined by Eq. (1), which plays a vital role in balancing the exploitation and exploration. More significant values of position vectors expedite global exploration, while a smaller value expedites exploitation. Hence, an appropriate selection of \(X_{rand}\) and \(X_{rabbit}\) should be made, so that a stable balance between global exploration and local exploitation can be established58. Accordingly, in the CHHO–CS algorithm, we borrow the merits CS method to control the position vectors of HHO. At the end of each iteration T, CS trying to find the better solution (if better solution found then update \(X_{rabbit}\) and \(X_{rand}\); otherwise left obtained values by HHO unchanged). Consequently, CS will determine the fitness value of the new solution, if it is better than the fitness value of the obtained from HHO, then the new solutions will be set; otherwise the old remains unchanged.
Figure 2 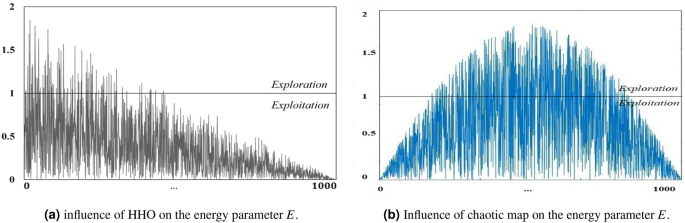
Influence of proper selection of energy parameter E.

To be specific, the steps of the CHHO–CS algorithm are executed as; chaotic maps are employed to avoid falling into local optimum and premature convergence. Moreover, a balancing between exploration and exploitation is performed by CS. Then, SVM is used for classification purposes. The flowchart of the proposed CHHO–CS method is represented in Fig. 3. The pseudo-code of the proposed CHHO–CS method is illustrated in Algorithm 3. Here is important to mention that for SVM and feature selection, in the CHHO–CS each solution of the population is encoded as a set of indexes that correspond to the rows of the dataset. For example, if a dataset has 100 rows a possible candidate solution in the population for five dimensions could be [10, 20, 25, 50, 80], such values are rows with the features to be evaluated in the SVM. The location vector in the soft and hard besiege with progressive rapid dives in HHO is updated as follows:


General flowchart of the proposed CHHO–CS method.
Feature selection
FS is a data pre-processing step, which is used in combination with the ML techniques. FS permits the selection of a subset without redundancies and desired data. FS can effectively increase the learning accuracy and classification performance. Therefore, the prediction accuracy and data understanding in ML techniques can be improved by selecting the features that are highly correlated with other features. Two features show perfect correlation; however, only one feature is introduced to sufficiently describe the data. Therefore, classification is considered to be a major task in the ML techniques; in classification, data are classified into groups depending on the information obtained with respect to different features. Large search spaces are a major challenge associated with FS; therefore, different MAs are used to perform this task.
Fitness function
Each candidate solution is evaluated along with the number of iterations to verify the performance of the proposed algorithm. Meanwhile, in classification, the dataset needs to be divided into training and test sets. The fitness function of the proposed CHHO–CS method is defined by the following equation:
and
where R refers to the classification error and C is the total number features for a given dataset D. \(\beta \) refer to the subset length and \(\alpha \) represents the classification performance defined in the range [0, 1]. T is a necessary condition and G is a group column for the specific classifier. Each step in the algorithm is compared with T, where the obtained fitness value must be greater than in order to maximize the solution. It is important to remark that the fitness (or objective) function in Eq. (15) is also used by the CS to compute the the positions of \(X_{rand}\) and \(X_{rabbit}\).
Results
To perform the experiments and comparisons, it is necessary to set up the initial values of the problem. In this way, the number of search agents is 30, the problem dimensions 1,665 for the first dataset, and 41 for the second dataset. Meanwhile, the number of iterations is set to 100 and 1,000, number experiments (runs) 30, \(\alpha \) is the fitness function 0.99, \(\beta \) in the fitness function 0.01, lower bound 0 and upper bound 1. For comparative purposes, seven meta-heuristics algorithms including the standard Cuckoo Search (CS) and Harris Hawks Optimizer (HHO), also ten chaotic maps to verify which of them provides better results are used to verify the proposed method but due to the lack of space we have added the results of the best map only. The selected meta-heuristics and the proposal have the same elements in the population and all of them are randomly initialized. The internal parameters for all the algorithms are provided in Table 2.
A common machine learning classifier has been used in experiments including called SVM also was combined with the proposed CHHO–CS method for the classification purpose.
Performance analysis using UCI datasets
Description and pre-processing of the datasets, results, and comparison of the proposed CHHO–CS is described in the following subsections.
UCI Data description
The proposed algorithm is examined on ten benchmark datasets obtained from the UCI machine learning repository59 illustrated in Fig. 3 and it is available at “https://www.openml.org/search”.
Statistical results
SVM is used for the classification task. Following the previous methodology, in this experiment, iterations are set to 1,000 for each of the 30 runs. The experimental results are reported in Tables 4 and 5. In this experiment, the CHHO–CS-Piece based on SVM achieves the best mean and Std.
Classification results
Since SVM is one of the most promising methods of classification, its performance needs to be analyzed. In this experiment, the number of iterations are set to 1,000, also the obtained results are reported in Tables 6 and 7. Notably, the CHHO–CS-Piece based on SVM obtains the best classification accuracy, sensitivity, specificity, recall, precision, and F-measure.
Performance analysis using chemical datasets
Description of chemical datasets
In this study, two different datasets are used to experimentally evaluate the performance of the proposed method. (1) The MAO dataset comprises 68 molecules and is divided into two classes: 38 molecules that inhibit MAO (antidepressants) and 30 molecules that do not. MAO is available at http://iapr-tc15.greyc.fr/links.html. Each molecule should have a mean size of 18.4 atoms, and the mean degree of the atoms is 2.1 edges. In addition, the smallest molecule contains 11 atoms, whereas the largest one contains 27 atoms; each molecule has 1,665 descriptors. (2) The QSAR biodegradation dataset comprises 1,055 chemical compounds, 41 molecular descriptors, and one class; it is available at http://archive.ics.uci.edu/ml/datasets/QSAR+biodegradation. These chemical compounds are obtained from the National Institute of Technology and Evaluation of Japan (NITE). The MAO dataset is transformed into a line notation form to describe the structure of the simplified molecular-input line-entry system (SMILES) using the open babel software60; E-dragon61 is subsequently applied to obtain the molecular descriptor. Information obtained with respect to the second QSAR biodegradation dataset was preprocessed by the Milano Chemometrics and QSAR Research Group, University of Milano-Bicocca and is available at http://www.michem.unimib.it/
Data preprocessing
Here, the required steps to preprocess the data set information are presented. The information obtained from the molecules is transferred to the features representing chemical compounds36,39. The data obtained from the proteins are stored in a special chemical format. Further, the software should be used to transfer the information into the isomeric SMILES. The data set contains different instances with specific multidimensional attributes (commonly two-dimensional 2D and 3D according to the QSAR model. The E-dragon software is used to compute the descriptors from this dataset. The descriptors contain physicochemical or structural information as solvation properties, molecular weight, aromaticity, volume, rotatable bonds, molecular walk counts, atom distribution, distances, interatomic, electronegativity, and atom types. They are used for determining values of generations and instances which belong to a class as shown in Fig. 4.

Mapping from a molecular to a space of features.
Statistical results
Here, the SVM is used for the classification task. Following the previous methodology, in the first experiment, iterations are set to 100 for each of the 30 runs. The experimental results are reported in Tables 8. In this experiment, the CHHO–CS-Piece based on SVM obtains the best mean and Std. The same rank is obtained for maximizing the classification accuracy solution, Sensitivity, Specificity, Recall, Precision, and F measure. In this case, the HHO–CS with SVM is the second-ranked in mean value, Std, and maximizing the classification accuracy solution, sensitivity, specificity, recall, precision, and F-measure. The iterations are configured to 1,000; the idea is to obtain the best solutions. In this case, the results are presented in Table 9, where the CHHO–CS-Piece combined with the SVM is the fist ranked approach for the mean value, and Std, the same occurs for maximizing the classification accuracy solution, sensitivity, specificity, recall, precision, and F-measure. Meanwhile, the second algorithm in the rank is the HHO–CS with SVM for mean value, Std, and maximizing the classification accuracy solution.
Classification results
Since SVM is one of the most promising methods of classification, its performance needs to be analyzed. In the first experiment, iterations are set to 100; the experimental results are reported in Table 10. In this experiment, the CHHO–CS-Piece based on SVM obtains the best results. In this case, the HHO–CS with SVM is the second-ranked in most of the assessment criteria. A final experiment for SVM is performed by using 1,000 iterations and the reported values in Table 11 confirms that the CHHO–CS-Piece combined with the SVM is the first ranked approach. Meanwhile, HHO–CS with SVM is the second-ranked algorithm in most of the assessment criteria.
The convergence analysis
This section aims to analyze the convergence of the proposed CHHO–CS based chaotic maps presented in this paper. Figures 5 and 6 shows the convergence curves for the competitor algorithms over the ten UCI Machine Learning Repository datasets along the iterative process 100, and 1,000 iterations respectively. Over the ten UCI datasets, the convergence curves plotted in Figs. 5 and 6 provides evidence that the proposed CHHO–CS method using SVM obtained the best results compared with the original HHO and CS algorithms and the other competitor algorithms along with the two-stop criteria (100 and 1,000 iterations).

Convergence curves for the best CHHO–CS-based chaotic map and the competitor algorithms using SVM on ten UCI datasets with 100 iterations.

Convergence curves for the best CHHO–CS-based chaotic map and the competitor algorithms using SVM on ten UCI datasets with 1,000 iterations.
On the other hand, the convergence curves plotted in Fig. 7a–d provide evidence that the proposed CHHO–CS method with SVM classifier obtained over the two datasets (MAO and QSAR biodegradation) the best results compared with the original HHO and CS algorithms and the other competitor algorithms along with the two-stop criteria (100 and 1,000 iterations).

Convergence curves for the best CHHO–CS-based chaotic map and the competitor algorithms using SVM on MonoAmine Oxidase (MAO) and QSAR Biodegradation datasets. (a,b) MAO dataset with 100, and 1,000 iterations respectively. On the other hand, (c,d) QSAR biodegradation dataset with 100, and 1,000 iterations respectively.
Discussion
According to the aforementioned results for both of the UCI datasets and the two chemical datasets (MonoAmine Oxidase (MAO) and QSAR biodegradation datasets), the CHHO–CS maximizes the accuracy and reduces the number of selected features. Also, the obtained Std values are increasing directly when the number of iterations increases for the proposed CHHO–CS method with the SVM classifier. The statistic metrics as mean, Std, best, and worst, as well as the classification assessment, indicate that chaotic maps introduce better results in comparison with the standard approaches. The evidence of this fact can be observed in the convergence curves as shown in Figs. 5, 6 and 7, where the CHHO–CS method based chaotic map with SVM is applied over the UCI datasets and the two chemical datasets (MOA and QSAR).
In worthwhile, the convergence curve is presented because it is a graphical form to study the relationship between the number of iterations and the fitness function. It declares the best-performed algorithm by comparison between various approaches and when increasing the number of iterations, it represents a direct correlation. The convergence curves plotted in Fig. 5a–j revealed that the proposed CHHO–CS-Piece method achieved better results compared with the competitor algorithms. Also, in the same context, the convergence curves plotted in Fig. 6a–j revealed that the proposed CHHO–CS-Piece method achieved better results compared with the competitor algorithms.
To sum up, the experiments were conducted on MOA and QSAR biodegradation datasets and the obtained results are interesting and due to the lack of space, we have added the results of the best map only. For example, in the first MOA dataset with the SVM classification technique in different stop conditions 100, and 1,000 iterations as shown in Fig. 7a–d, respectively. Moreover, on the MAO dataset, with 100 and 1,000 iterations, it is interesting that CHHO–CS-Piece with SVM is better than the other competitor algorithms. Meanwhile, for the second QSAR biodegradation dataset, the optimal solutions with SVM are computed with 100, and 1,000 iterations as stop condition, it is interesting that the version CHHO–CS-Piece with SVM provides the optimal solutions in comparison with the other metaheuristic algorithms.
Conclusion
metaheuristic algorithms and machine learning techniques are important tools that can solve complex tasks in the field of cheminformatics. The capabilities of MAs and ML to optimize and classify information are useful in drug design. However, these techniques should be highly accurate to obtain optimal compounds. In this paper, a hybrid metaheuristic method termed CHHO–CS which combined the Harris hawks optimizer (HHO) with operators of the cuckoo search (CS) and chaotic maps (C) in order to enhance the performance of the original HHO. Moreover, the proposed CHHO–CS method was combined with the support vector machine (SVM) as machine learning classifiers for conducting the chemical descriptor selection and chemical compound activities. The main tasks of the proposed method are to select the most important features and classify the information in the cheminformatics datasets (e.g., MAO and QSAR biodegradation). The experimental results confirm that the use of chaotic maps enhances the optimization process of the hybrid proposal. It is important to mention that not all the chaotic maps are completely useful, and it is necessary to decide when to use one or another. As expected, this is dependent on the dataset and the objective function. Comparisons of the proposed CHHO–CS method with the standard algorithms revealed that the CHHO–CS yields superior results with respect to cheminformatics using different stop criteria. In the future, the proposed CHHO–CS method can be used as a multi-objective global optimization or feature selection paradigm for high-dimensional problems containing many instances to increase the classification rate and decrease the selection ratio of attributes.
References
Velagapudi, S. P., Gallo, S. M. & Disney, M. D. Sequence-based design of bioactive small molecules that target precursor micrornas. Nat. Chem. Biol. 10, 291 (2014).
Lavecchia, A. Machine-learning approaches in drug discovery: Methods and applications. Drug Discov. Today 20, 318–331 (2015).
Hassan Baig, M. et al. Computer aided drug design: Success and limitations. Curr. Pharm. Des. 22, 572–581 (2016).
Ruiz, I. L. & Goémez-Nieto, M. A. Advantages of relative versus absolute data for the development of quantitative structure-activity relationship classification models. J. Chem. Inf. Model. 57, 2776–2788 (2017).
Forli, S. et al. Computational protein-ligand docking and virtual drug screening with the autodock suite. Nat. Protoc. 11, 905–917 (2016).
Katsila, T., Spyroulias, G. A., Patrinos, G. P. & Matsoukas, M.-T. Computational approaches in target identification and drug discovery. Comput. Struct. Biotechnol. J. 14, 177–184 (2016).
Liu, H. & Motoda, H. Computational Methods of Feature Selection (CRC Press, Boca Raton, 2007).
Hussien, A. G., Houssein, E. H. & Hassanien, A. E. A binary whale optimization algorithm with hyperbolic tangent fitness function for feature selection. In 8th International Conference on Intelligent Computing and Information Systems, 166–172 (IEEE, 2017).
Zainuddin, Z., Lai, K. H. & Ong, P. An enhanced harmony search based algorithm for feature selection: Applications in epileptic seizure detection and prediction. Comput. Electr. Eng. 53, 143–162 (2016).
Hastie, T., Tibshirani, R., Friedman, J. & Franklin, J. The elements of statistical learning: Data mining, inference and prediction. Math. Intell. 27, 83–85 (2005).
Wang, Y., Feng, L. & Zhu, J. Novel artificial bee colony based feature selection method for filtering redundant information. Appl. Intell. 48, 868–885 (2018).
Neggaz, N., Houssein, E. H. & Hussain, K. An efficient henry gas solubility optimization for feature selection. Expert Syst. Appl. 152, 113364 (2020).
Wan, Y., Wang, M., Ye, Z. & Lai, X. A feature selection method based on modified binary coded ant colony optimization algorithm. Appl. Soft Comput. 49, 248–258 (2016).
Xue, B., Zhang, M., Browne, W. N. & Yao, X. A survey on evolutionary computation approaches to feature selection. IEEE Trans. Evol. Comput. 20, 606–626 (2015).
Hashim, F. A., Houssein, E. H., Mabrouk, M. S., Al-Atabany, W. & Mirjalili, S. Henry gas solubility optimization: A novel physics-based algorithm. Future Gener. Comput. Syst. 101, 646–667 (2019).
Heidari, A. A. et al. Harris hawks optimization: Algorithm and applications. Future Gener. Comput. Syst. 97, 849–872 (2019).
Bao, X., Jia, H. & Lang, C. A novel hybrid harris hawks optimization for color image multilevel thresholding segmentation. IEEE Access 7, 76529–76546 (2019).
Jia, H., Lang, C., Oliva, D., Song, W. & Peng, X. Dynamic harris hawks optimization with mutation mechanism for satellite image segmentation. Remote Sens. 11, 1421 (2019).
Yang, X.-S. & Deb, S. Cuckoo search via lévy flights. In World Congress on Nature and Biologically Inspired Computing, 210–214 (IEEE, 2009).
Rakhshani, H. & Rahati, A. Snap-drift cuckoo search: A novel cuckoo search optimization algorithm. Appl. Soft Comput. 52, 771–794 (2017).
Rakhshani, H., Dehghanian, E. & Rahati, A. Hierarchy cuckoo search algorithm for parameter estimation in biological systems. Chemometr. Intell. Lab. Syst. 159, 97–107 (2016).
Rakhshani, H. & Rahati, A. Intelligent multiple search strategy cuckoo algorithm for numerical and engineering optimization problems. Arab. J. Sci. Eng. 42, 567–593 (2017).
Rakhshani, H., Rahati, A. & Dehghanian, E. Cuckoo search algorithm and its application for secondary protein structure prediction. In 2015 2nd International Conference on Knowledge-Based Engineering and Innovation (KBEI), 412–417 (IEEE, 2015).
Fister, I. Jr., Fister, D. & Fister, I. A comprehensive review of cuckoo search: Variants and hybrids. Int. J. Math. Model. Numer. Optim. 4, 387–409 (2013).
Caponetto, R., Fortuna, L., Fazzino, S. & Xibilia, M. G. Chaotic sequences to improve the performance of evolutionary algorithms. IEEE Trans. Evol. Comput. 7, 289–304 (2003).
Kennedy, J. & Eberhart, R. Particle swarm optimization. In International Conference on Neural Networks, Vol. 4, 1942–1948 (IEEE, 1995).
Mirjalili, S. Moth-flame optimization algorithm: A novel nature-inspired heuristic paradigm. Knowl.-Based Syst. 89, 228–249 (2015).
Mirjalili, S., Mirjalili, S. M. & Lewis, A. Grey wolf optimizer. Adv. Eng. Softw. 69, 46–61 (2014).
Mirjalili, S. et al. Salp swarm algorithm: A bio-inspired optimizer for engineering design problems. Adv. Eng. Softw. 114, 163–191 (2017).
Mirjalili, S. SCA: A sine cosine algorithm for solving optimization problems. Knowl.-Based Syst. 96, 120–133 (2016).
Jia, B. et al. CARD 2017: Expansion and model-centric curation of the comprehensive antibiotic resistance database. Nucleic Acids Res. 45, D566–D573 (2016).
Katsila, T. et al. Computational approaches in target identification and drug discovery. Comput. Struct. Biotechnol. J. 14, 177–184 (2016).
Yuan, S., Chan, H. S., Filipek, S. & Vogel, H. PyMOL and Inkscape bridge the data and the data visualization. Structure 24, 2041–2042 (2016).
Wang, Z. et al. Comprehensive evaluation of ten docking programs on a diverse set of protein-ligand complexes: The prediction accuracy of sampling power and scoring power. Phys. Chem. Chem. Phys. 18, 12964–12975 (2016).
Ng, L. Y., Chemmangattuvalappil, N. G. & Ng, D. K. Robust chemical product design via fuzzy optimisation approach. Comput. Chem. Eng. 83, 186–202 (2015).
Masand, V. H. & Rastija, V. Pydescriptor: A new pymol plugin for calculating thousands of easily understandable molecular descriptors. Chemometr. Intell. Lab. Syst. 169, 12–18 (2017).
Houssein, E. H., Hosney, M. E., Oliva, D., Mohamed, W. M. & Hassaballah, M. A novel hybrid harris hawks optimization and support vector machines for drug design and discovery. Comput. Chem. Eng. 133, 106656 (2020).
Jamali, A. A. et al. DrugMiner: Comparative analysis of machine learning algorithms for prediction of potential druggable proteins. Drug Discov. Today 21, 718–724 (2016).
Lo, Y.-C., Rensi, S. E., Torng, W. & Altman, R. B. Machine learning in chemoinformatics and drug discovery. Drug Discov. Today 23, 1538–1546 (2018).
Kaur, G. & Arora, S. Chaotic whale optimization algorithm. J. Comput. Des. Eng. 5, 275–284 (2018).
Yousri, D. et al. Chaotic flower pollination and grey wolf algorithms for parameter extraction of bio-impedance models. Appl. Soft Comput. 75, 750–774 (2019).
Arora, S. & Anand, P. Chaotic grasshopper optimization algorithm for global optimization. Neural Comput. Appl. 31, 4385–4405 (2019).
Wang, L. & Zhong, Y. Cuckoo search algorithm with chaotic maps. Math. Probl. Eng. 2015, 1–14 (2015).
Hussien, A. G., Hassanien, A. E., Houssein, E. H., Bhattacharyya, S. & Amin, M. S-shaped binary whale optimization algorithm for feature selection. In Recent Trends in Signal and Image Processing (eds Bhattacharyya, S. et al.) 79–87 (Springer, Berlin, 2019).
Hussien, A. G., Hassanien, A. E. & Houssein, E. H. Swarming behaviour of salps algorithm for predicting chemical compound activities. In 2017 Eighth International Conference on Intelligent Computing and Information Systems (ICICIS), 315–320 (IEEE, 2017).
Rodríguez-Peérez, R., Vogt, M. & Bajorath, J. Support vector machine classification and regression prioritize different structural features for binary compound activity and potency value prediction. ACS Omega 2, 6371–6379 (2017).
dos Santos Coelho, L. & Mariani, V. C. Use of chaotic sequences in a biologically inspired algorithm for engineering design optimization. Expert Syst. Appl. 34, 1905–1913 (2008).
Ott, E. Chaos in Dynamical Systems (Cambridge University Press, Cambridge, 2002).
Li, Y., Deng, S. & Xiao, D. A novel hash algorithm construction based on chaotic neural network. Neural Comput. Appl. 20, 133–141 (2011).
Peitgen, H.-O., Jürgens, H. & Saupe, D. Chaos and Fractals: New Frontiers of Science (Springer, Berlin, 2006).
Devaney, R. L. et al. A first course in chaotic dynamical systems: Theory and experiment. Comput. Phys. 7, 416–417 (1993).
Tavazoei, M. S. & Haeri, M. Comparison of different one-dimensional maps as chaotic search pattern in chaos optimization algorithms. Appl. Math. Comput. 187, 1076–1085 (2007).
Hilborn, R. C. Chaos and Nonlinear Dynamics: An Introduction for Scientists and Engineers (Oxford University Press on Demand, Oxford, 2000).
May, R. M. Simple mathematical models with very complicated dynamics. Nature 261, 459–467 (1976).
He, D., He, C., Jiang, L.-G., Zhu, H.-W. & Hu, G.-R. Chaotic characteristics of a one-dimensional iterative map with infinite collapses. IEEE Trans. Circuits Syst. I Fund. Theory Appl. 48, 900–906 (2001).
Tomida, A. G. Matlab toolbox and gui for analyzing one-dimensional chaotic maps. In International Conference on Computational Sciences and Its Applications, 321–330 (IEEE, 2008).
Chen, H. et al. Multi-population differential evolution-assisted harris hawks optimization: Framework and case studies. Future Gener. Comput. Syst. (2020).
Gupta, S., Deep, K., Heidari, A. A., Moayedi, H. & Wang, M. Opposition-based learning harris hawks optimization with advanced transition rules: Principles and analysis. Expert Syst. Appl. 158, 113510 (2020).
Asuncion, A. & Newman, D. UCI machine learning repository. https://archive.ics.uci.edu/ml/datasets.php (2020).
Andersen, J. L., Flamm, C., Merkle, D. & Stadler, P. F. A software package for chemically inspired graph transformation. In International Conference on Graph Transformation, 73–88 (Springer, Berlin, 2016).
Khan, A. U. et al. Descriptors and their selection methods in QSAR analysis: Paradigm for drug design. Drug Discov. Today 21, 1291–1302 (2016).
Author information
Authors and Affiliations
Contributions
All authors contributed equally to this paper, where E.H.H. participated in sorting the experiments, discussed and analyzed the results, and wrote the paper. M.E.H. performed the experiments and analyzed the results. M.E. discussed the results and wrote the paper. D.O. discussed the results and wrote the paper. W.M.M. discussed the results and wrote the paper. M.H. analyzed the results and revised the paper. All authors approved the work in this paper.
Corresponding authors
Ethics declarations
Competing interests
The authors declare no competing interests.
Additional information
Publisher's note
Springer Nature remains neutral with regard to jurisdictional claims in published maps and institutional affiliations.
Rights and permissions
Open Access This article is licensed under a Creative Commons Attribution 4.0 International License, which permits use, sharing, adaptation, distribution and reproduction in any medium or format, as long as you give appropriate credit to the original author(s) and the source, provide a link to the Creative Commons license, and indicate if changes were made. The images or other third party material in this article are included in the article's Creative Commons license, unless indicated otherwise in a credit line to the material. If material is not included in the article's Creative Commons license and your intended use is not permitted by statutory regulation or exceeds the permitted use, you will need to obtain permission directly from the copyright holder. To view a copy of this license, visit http://creativecommons.org/licenses/by/4.0/.
About this article

Cite this article
Houssein, E.H., Hosney, M.E., Elhoseny, M. et al. Hybrid Harris hawks optimization with cuckoo search for drug design and discovery in chemoinformatics. Sci Rep 10, 14439 (2020). https://doi.org/10.1038/s41598-020-71502-z
Received:
Accepted:
Published:
DOI: https://doi.org/10.1038/s41598-020-71502-z
This article is cited by
-
An Improved Gannet Optimization Algorithm Based on Opposition-Based Schemes for Feature Selection Problems in High-Dimensional Datasets
SN Computer Science (2024)
-
A Memetic Approach to Multi-Disciplinary Design and Numerical Optimization Problems using Intensify Slime Mould Optimizer
Applied Intelligence (2024)
-
An efficient improved exponential distribution optimizer: application to the global, engineering and combinatorial optimization problems
Cluster Computing (2024)
-
Determination of wheat types using optimized extreme learning machine with metaheuristic algorithms
Neural Computing and Applications (2023)
-
HHO-EAS: a new metaheuristic bio-inspired of the win–win hunting synergy between the two predators crow and wolf
Artificial Intelligence Review (2023)
Comments
By submitting a comment you agree to abide by our Terms and Community Guidelines. If you find something abusive or that does not comply with our terms or guidelines please flag it as inappropriate.
