
Abstract
Genome-wide association studies (GWAS) test hundreds of thousands of genetic variants across many genomes to find those statistically associated with a specific trait or disease. This methodology has generated a myriad of robust associations for a range of traits and diseases, and the number of associated variants is expected to grow steadily as GWAS sample sizes increase. GWAS results have a range of applications, such as gaining insight into a phenotype’s underlying biology, estimating its heritability, calculating genetic correlations, making clinical risk predictions, informing drug development programmes and inferring potential causal relationships between risk factors and health outcomes. In this Primer, we provide the reader with an introduction to GWAS, explaining their statistical basis and how they are conducted, describe state-of-the art approaches and discuss limitations and challenges, concluding with an overview of the current and future applications for GWAS results.
Introduction
Genome-wide association studies (GWAS) aim to identify associations of genotypes with phenotypes by testing for differences in the allele frequency of genetic variants between individuals who are ancestrally similar but differ phenotypically. GWAS can consider copy-number variants or sequence variations in the human genome, although the most commonly studied genetic variants in GWAS are single-nucleotide polymorphisms (SNPs). GWAS typically report blocks of correlated SNPs that all show a statistically significant association with the trait of interest, known as genomic risk loci. After 15 years of GWAS1, many replicated genomic risk loci have been associated with diseases and traits1, such as FTO2 for obesity and PTPN22 (ref.3) for autoimmune diseases. These results have sometimes provided hints into disease biology; for example, a GWAS implicated the IL-12/IL-23 pathway in the development of Crohn’s disease4, which supported subsequent clinical trials for drugs targeting the IL-12/IL-23 pathway5.
Results from GWAS can be used for a range of applications. For example, trait-associated genetic variants can be used as control variables in epidemiology studies to account for confounding genetic group differences6. Further, results can be used to predict an individual’s risk for physical and mental disease based on their genetic profile. Indeed, a recent study showed that genomic risk prediction using genome-wide polygenic risk scores (PRSs) for coronary artery disease, atrial fibrillation, type 2 diabetes, inflammatory bowel disease and breast cancer can identify disease risk as well as monogenic risk prediction strategies based on rare, highly penetrant mutations7. Genomic risk prediction may soon be allowed for clinical use as a stratification tool and a genetically based biomarker7.
More than 5,700 GWAS have now been conducted for more than 3,300 traits8 and a push for more statistical power has thrust GWAS sample sizes well beyond a million participants9,10, yielding numerous associated and replicable variants for many heritable traits. Now that reliable genetic associations for various phenotypes are known, we are faced with the next big challenge: interpreting these associations in a biological and genomic context. Previous GWAS have shown that most traits are influenced by thousands of causal variants11 that individually confer very little risk, are often associated with many other traits8 and are correlated with causal and non-causal variants that are physically close as a result of linkage disequilibrium12, making direct biological, causal inferences complicated13. Further, genetic associations may differ across ancestries, complicating direct comparisons between groups of individuals. Some of these limitations hamper drawing unambiguous conclusions about the biological meaning of GWAS results, sometimes limiting their utility to produce mechanistic insights or to serve as starting points for drug development1.
In this Primer, we aim to provide the reader with a comprehensive overview of GWAS, covering practical considerations, such as experimental design, robust data analysis and data deposition, ethical implications and reproducibility of results. We also provide guidance on how to interpret results from GWAS using several post-GWAS strategies and functional follow-up experiments, as well as a discussion of the above-mentioned limitations and future challenges of GWAS.
Experimentation
The experimental workflow of a GWAS involves several steps, including the collection of DNA and phenotypic information from a group of individuals (such as disease status and demographic information such as age and sex); genotyping of each individual using available GWAS arrays or sequencing strategies; quality control; imputation of untyped variants using haplotype phasing and reference populations; conducting the statistical test for association; conducting a meta-analysis (optional); seeking an independent replication; and interpreting the results by conducting multiple post-GWAS analyses (Fig. 1). At each step, possible biases and errors may enter the study, and therefore careful planning is required when setting up a GWAS, and adherence to standardized quality control and analysis protocols is advised. We detail these steps below. We note that most of the issues that may arise when conducting GWAS, such as carefully selecting participants or the steps that are needed in quality control, apply both to GWAS that include common variants and to studies that include rare variants such as whole-exome sequencing (WES) studies and whole-genome sequencing (WGS) studies; the sections below concern the analysis of common variants, except when explicitly stated (Box 1).
a | Data can be collected from study cohorts or available genetic and phenotypic information can be used from biobanks or repositories. Confounders need to be carefully considered and recruitment strategies must not introduce biases such as collider bias. b | Genotypic data can be collected using microarrays to capture common variants, or next-generation sequencing methods for whole-genome sequencing (WGS) or whole-exome sequencing (WES). c | Quality control includes steps at the wet-laboratory stage, such as genotype calling and DNA switches, and dry-laboratory stages on called genotypes, such as deletion of bad single-nucleotide polymorphisms (SNPs) and individuals, detection of population strata in the sample and calculation of principle components. Figure depicts clustering of individuals according to genetic substrata. d | Genotypic data can be phased, and untyped genotypes imputed using information from matched reference populations from repositories such as 1000 Genomes Project or TopMed. In this example, genotypes of SNP1 and SNP3 are imputed based on the directly assayed genotypes of other SNPs. e | Genetic association tests are run for each genetic variant, using an appropriate model (for example, additive, non-additive, linear or logistic regression). Confounders are corrected for, including population strata, and multiple testing needs to be controlled. Output is inspected for unusual patterns and summary statistics are generated. f | Results from multiple smaller cohorts are combined using standardized statistical pipelines. g | Results can be replicated using internal replication or external replication in an independent cohort. For external replication, the independent cohort must be ancestrally matched and not share individuals or family members with the discovery cohort. h | In silico analysis of genome-wide association studies (GWAS), using information from external resources. This can include in silico fine-mapping, SNP to gene mapping, gene to function mapping, pathway analysis, genetic correlation analysis, Mendelian randomization and polygenic risk prediction. After GWAS, functional hypotheses can be tested using experimental techniques such as CRISPR or massively parallel reporter assays, or results can be validated in a human trait/disease model (not shown).
Conducting GWAS
Selecting study populations
GWAS often require very large sample sizes to identify reproducible genome-wide significant associations and the desired sample size can be determined using power calculations in software tools such as CaTS14 or GPC15. Study designs can involve the inclusion of cases and controls when the trait of interest is dichotomous, or quantitative measurements on the whole study sample when the trait is quantitative. In addition, one can choose between population-based and family-based designs. The choice of data resource and study design for a GWAS depends on the required sample size, the experimental question and the availability of pre-existing data or the ease with which new data can be collected. GWAS can be conducted using data from resources such as biobanks or cohorts with disease-focused or population-based recruitment, or through direct to consumer studies. Assembling data sets of a sufficient size to run a well-powered GWAS for a complex trait requires major investments of time and money that go beyond the capacity of most individual laboratories. However, there are several excellent public resources available that provide access to large cohorts with both genotypic and phenotypic information, and the majority of GWAS are conducted using these pre-existing resources. Even when new data have been collected in-house, these will typically be co-analysed with data from pre-existing resources; collecting new data is usually required when more refined phenotyping is desired.
For all study designs, recruitment strategies must be carefully considered as these can induce collider bias and other forms of bias in the resultant data16. For example, widely used research cohorts such as the UK Biobank recruit participants through a volunteer-based strategy, which results in participants who are, on average, healthier, wealthier and more educated than the general population17. Further, cohorts that enrol participants from hospitals based on their disease status (such as BioBank Japan) will have different selection biases to cohorts recruited from the general population18. Different ethnicities can be included in the same study, as long as the population substructure is considered to avoid false positive results. Individual cohorts with detailed clinical measures may not be able to meet the required sample size; in these cases, ‘proxy’ phenotypes that are easier to measure and for which there are more data can be used (for example, educational attainment can be used as a proxy for intelligence, or depressive symptoms can be used as a proxy for a clinical diagnosis of depression)19.
Genotyping
Genotyping of individuals is typically done using microarrays for common variants or next-generation sequencing methods such as WES or WGS that also include rare variants. Microarray-based genotyping is the most commonly used method for obtaining genotypes for GWAS owing to the current cost of next-generation sequencing. However, the choice of genotyping platform depends on many factors and tends to be guided by the purpose of the GWAS; for example, in a consortium-led GWAS, it is usually wise to have all individual cohorts genotyped on the same genotyping platform. Ideally, WGS — which determines nearly every genotype of a full genome — is preferred over WES and microarrays, and is expected to become the method of choice over the next couple of years with the increasing availability of low-cost WGS technology.
Data processing
Input files for a GWAS include anonymized individual ID numbers, coded family relations between individuals, sex, phenotype information, covariates, genotype calls for all called variants and information on the genotyping batch. Following input of the data, generating reliable results from GWAS requires careful quality control. Some example steps include removing rare or monomorphic variants, removing variants that are not in Hardy–Weinberg equilibrium, filtering SNPs that are missing from a fraction of individuals in the cohort, identifying and removing genotyping errors, and ensuring that phenotypes are well matched with genetic data, often by comparing self-reported sex versus sex based on the X and Y chromosomes. Software tools such as PLINK have been specifically designed to analyse genetic data and can be used to conduct many of these quality control steps20 (further software for quality control analysis and other stages of GWAS are summarized in Table 1). Once sample and variant quality control have been performed on GWAS array data, variants usually undergo phasing and are imputed using a sequenced haplotype reference panel such as the 1000 Genomes Project or TOPMed21,22, which involves the statistical inference of genotypes that have not been assayed directly (Box 2). GWAS consortia routinely follow pipelines for conducting quality control steps and imputation, using, for example, RICOPILI23 or similar software, or upload their data to imputation servers (for example, the Michigan Imputation Server or the TOPMed Imputation Server) where these standardized pipelines have been implemented. Because genetic data sets are typically large and analysis pipelines can be run in parallel, computer clusters or cloud environments that can distribute jobs to many computers are often used. To achieve the large sample sizes typical in genetic studies in a logistically feasible manner that follows data protection rules, the above steps are often done separately for many different cohorts of varying sample size (see section Genome-wide association meta-analysis (GWAMA)).
Ancestry and relatedness must be carefully considered and accounted for in GWAS, and indeed all genetic studies — particularly in data sets from participants of diverse backgrounds to avoid false positive or negative genetic signals and biased test statistics owing to population stratification24,25,26,27. In GWAS, these signals can lead to overestimated SNP-based heritability28 and biased PRSs29,30. They also may bias the results of Mendelian randomization studies31. Cases and controls should be matched by ancestry to avoid confounding; for example, a GWAS for chopstick use where cases are defined as ‘using chopsticks regularly’ and controls as ‘not using chopsticks’ would likely result in cases being drawn more often from an East Asian population than controls. Not accounting for ancestry in this study would identify associations among variants more common in East Asian populations than other populations, such as those at specific human leukocyte antigen (HLA) alleles, not because those variants contribute to dexterity but because cultural practices, in this case, act as a confounder32. Ancestry is usually considered in GWAS through an iterative process using principal component analysis; the genotypes of all individuals are used to define clusters of individuals with similar genotypes. This is done first to identify and exclude outliers, and then to compute and include principal components as covariates in subsequent GWAS regression models33.
Testing for associations
The theory of genetic association is based on the biometrical model (see Supplementary Note for more details). Typically in GWAS, linear or logistic regression models are used to test for associations, depending on whether the phenotype is continuous (such as height, blood pressure or body mass index) or binary (such as the presence or absence of disease), respectively. Covariates such as age, sex and ancestry are included to account for stratification and avoid confounding effects from demographic factors, with the caveat that this may reduce statistical power for binary traits in ascertained samples34. Including an additional random effect term — which is individual-specific in linear or logistic mixed models to account for genetic relatedness among individuals — can improve statistical power for genomic discovery and increase control for stratification at the cost of requiring greater computational resources35,36 (although this limitation can be addressed by using tools such as fastGWA37). When conducting a GWAS, it should be noted that the genotypes of genetic variants that are physically close together are not independent as they tend to be in linkage disequilibrium; this dependency of tests should also be considered when conducting a GWAS.
Linear regression models for GWAS can be written as follows:
where, for each individual, Y is a vector of phenotype values, W is a matrix of covariates including an intercept term, α is a corresponding vector of effect sizes, Xs is a vector of genotype values for all individuals at SNP s, βs is the corresponding fixed effect size of genetic variant s (also known as the SNP effect size), g is a random effect that captures the polygenic effect of other SNPs, e is a random effect of residual errors, \({\sigma }_{{\rm{A}}}^{2}\) measures the additive genetic variation of the phenotype, \({\boldsymbol{\psi }}\) is the standard genetic relationship matrix, \({\sigma }_{e}^{2}\) measures residual variance and I is an identity matrix. In logistic regression models, a logit link function is used for binomially distributed case–control phenotypes to model outcome odds.
Accounting for false discovery
Testing millions of associations between individual genetic variants and a phenotype of interest requires a stringent multiple-testing threshold to avoid false positives. The International HapMap Project and other studies have shown that there are approximately 1 million independent common genetic variants across the human genome on average, resulting in a Bonferroni testing threshold of P < 5 × 10⁻⁸ (representing a false discovery rate of 0.05/106)38. The appropriate threshold might vary depending on the population; for example, a more stringent threshold may be needed for populations with larger effective population sizes or if the minor allele frequency thresholds for inclusion in a GWAS are lowered as sample sizes increase, as low minor allele frequency variants are typically not in linkage disequilibrium with common variants and, therefore, add a greater multiple testing burden. Complex traits such as height, schizophrenia or type 2 diabetes tend to be highly polygenic and, as a result, many genetic variants with small effects contribute to the phenotype. In these cases, winner’s curse is common, and effect size estimates close to the discovery threshold tend to be overestimated in initial GWAS.
Comparing effect sizes between discovery and independent replication cohorts is the gold standard for accounting for false discovery and winner’s curse by calibrating effect size estimates. Replication cohorts are ideally considered at the outset of the GWAS and should give sufficient statistical power to correct for winner’s curse and multiple testing; however, effect sizes will, of course, be unknown before the GWAS. When comparing effect sizes between a discovery cohort and a replication cohort, the effect statistics and corresponding error terms should be used (for example, the regression coefficient, odds ratio and so on) for each cohort, particularly when different software has been used to perform each GWAS. Replication cohorts must be completely independent from the discovery cohort, with no shared individuals or genetic relationships between individuals from the cohorts.
Genome-wide association meta-analysis
To increase sample size, GWAS is typically carried out in the context of a consortium such as the Psychiatric Genomics Consortium, the Genetic Investigation of Anthropometric Traits (GIANT) consortium or the Global Lipids Genetics Consortium where data from multiple cohorts are analysed together using tools such as METAL39, N-GWAMA or MA-GWAMA40 and quality control pipelines such as those implemented in RICOPILI23 or EasyQC41. For a detailed description of the quality control procedures specific to GWAMA, we refer readers to ref.42. The crucial steps for GWAMA are to first ensure individual cohorts follow the same predefined data analysis plan, use harmonized phenotypes and communicate their results in a standardized way. This can include scaling effect sizes to a standard normal distribution, as phenotypic measurements and their estimated absolute effect sizes sometimes cannot be compared across cohorts. Next, cohort-level inspection of submitted results using a predefined quality control protocol is carried out by at least two independent analysts, with any issues resolved within the individual cohorts. Finally, meta-analysis is performed on the summary statistics. Meta-analyses can be performed using a fixed effect model — which assumes error variances are equal across cohorts — or a random effect model to test for heterogeneity in the results; for example, testing whether one or two cohorts clearly deviate from the rest. Combining the contributions of all cohorts allows for a more precise estimation of effect sizes and the significance of effects in GWAS by weighting each individual cohort’s results by their sample size or by using the inverse variance method39. Sequencing data sets can identify rare variants, although current sequencing data sets are typically too underpowered to test their effects on a phenotype individually; instead, their effects are usually measured in aggregate, such as in genes or gene sets through rare variant burden testing43,44.
Populations used in GWAS
Population-based GWAS
Genetic and phenotypic observations used in GWAS are often derived from a population-based cohort where individuals are assumed to be a random draw from the population. Phenotypes corresponding to either continuous or binary dependent variables can be tested for association with genotyped or imputed variants. A common GWAS design is a case–control study, in which cases and controls are defined based on the presence or absence of a certain phenotype, respectively. In many case–control studies, case and control cohorts are actively selected such that the frequency of the cases does not match the population-based frequency, and this should be reflected in the statistical analyses; for example, covariate adjustment will need additional consideration34,45. Using controls from a population cohort of unknown disease status can allow for the presence of cases at the population frequency in the ‘control’ population, although this will have little effect for diseases with population frequencies below 1%. Alternatively, controls can be actively matched to cases with respect to sex and ancestry. If the population frequency of the disease is low (<20%), the latter approach has been shown to be adequately powered and cost-effective46. In terms of increasing statistical power and a limited amount of financial resources, active recruitment of cases and controls is usually preferred.
If cases and controls are not genotyped together on the same chip, extra effort must be made during quality control and subsequent analyses to minimize artefacts (for example, by adding the genotyping batch as a covariate in the analyses). It should be noted that although samples are assumed to be a random draw from the population, this assumption is not the case in the presence of participation bias and unmatched socio-demographic factors17,47.
Family-based GWAS
Family-based association tests that make use of first-degree relatives were frequently used in the early days of GWAS, largely owing to the availability of well-phenotyped twin and other family cohorts48. Family-based GWAS require larger sample sizes than GWAS of unrelated individuals to achieve the same statistical power49 but avoid issues with population stratification. Recently, there has been renewed interest in conducting within-family studies as concerns about uncorrected stratification in population-based GWAS have grown31,50,51. Within-family methods typically use variations on the transmission disequilibrium test to examine the segregation of an allele within a family. Various forms of this test can be applied in PLINK52, such as a test for quantitative phenotypes that combines within-family and between-family association53,54, although, importantly, only the within-family part is immune to population stratification. Similarly, linear mixed model-based approaches such as GEMMA55, SAIGE35 and REGENIE56 use both within-family and between-family information and are therefore not completely immune to stratification; however, if close relatives are available, these can be included to increase power. A benefit of using family data in GWAS is that they can be used to interrogate the effects of an allele on an individual’s phenotype from its indirect effects on close family members57,58,59,60. Further, making use of phenotypic information from non-genotyped family members — a method sometimes known as GWAS by proxy — has been shown to substantially boost power for some traits, particularly when studying late-onset diseases for which the collection of large data sets is challenging61,62. A note of caution here is that GWAS by proxy tends to rely on self-reported family history, which may not always be accurate.
Isolated populations
There are some advantages to conducting GWAS in populations that have become isolated owing to a founder event such as geographic or cultural barriers, have remained isolated for a prolonged period and have restricted gene flow with neighbouring populations63. A key advantage is that otherwise rare functional variants may be present in higher frequencies within isolated populations64,65,66 and these populations can therefore give increased power for association studies for such variants. The long-range linkage disequilibrium67 typical for isolated populations improves imputation accuracy and power over similarly sized non-isolated cohorts68,69,70,71, particularly if even a small number of individuals from the isolated population are included in the reference panel72. Owing to the high relatedness in isolated populations, a linear mixed model-based approach to GWAS is commonly used. Isolated populations tend to have high genetic homogeneity owing to the extinction of alleles through genetic bottlenecks, which can increase the power of burden tests by reducing the number of neutral variants73. Discoveries in isolated populations can be difficult to replicate in other populations if the variant is too rare, although other variants implicating the same genes can add additional support; for example, variants implicating APOA5 associated with triglyceride levels in a Sardinian population74 could be supported by those implicating myocardial infarction in other European populations75.
Biobanks
Many large, open-access population biobanks are available to researchers. Biobanks contain data from thousands of genotyped individuals who have been deeply phenotyped either through questionnaires, laboratory measurements and/or linkage to electronic health records and were not selected for particular disease traits. A notable example is the UK Biobank, which includes data from approximately 500,000 individuals76 and has enabled well-powered GWAS of hundreds of quantitative traits, including anthropometric traits77, blood cell traits78, metabolites79, cognitive traits80, brain imaging traits81 and depressive symptoms (as described in ref.82), as well as boosting sample sizes for GWAS of common diseases83,84,85.
Although biobanks and twin studies have historically been focused on populations with European ancestry, large biobanks of data from individuals with non-European ancestries are being built86 and many new studies are based on ethnically diverse communities (Table 2) (see Ethical challenges section for a detailed discussion of diversity-related issues). Most biobanks have used imputed genotype data for common variants, although WES data are already available for 50,000 UK Biobank participants87. In the next few years, WES and WGS data will be generated for all UK Biobank participants, greatly increasing power to assess the role of rare variants.
Results
The primary output of a GWAS analysis is a list of P values, effect sizes and their directions generated from the association tests of all tested genetic variants with a phenotype of interest. These data are routinely visualized using Manhattan plots and quantile–quantile plots (Fig. 2), generated using software tools such as R or web platforms such as FUMA88 or LocusZoom89. Further analysis is then needed to interpret this list of P values, determining the most likely causal variants, their functional interpretation and possible convergence in meaningful biological pathways (Fig. 3). We discuss these post-GWAS analyses below.

a | Manhattan plot showing significance of each variant’s association with a phenotype (body mass index in this case77). Each dot represents a single-nucleotide polymorphism (SNP), with SNPs ordered on the x axis according to their genomic position. y axis represents strength of their association measured as –log10 transformed P values. Red line marks genome-wide significance threshold of P < 5 × 10⁻⁸. b | Quantile–quantile plot showing distribution of expected P values under a null model of no significance versus observed P values. Expected –log10 transformed P values (x axis) for each association are plotted against observed values (y axis) to visualize the enrichment of association signal. Deviation from the expectation under the null hypothesis (red line) indicates the presence of either true causal effects or insufficiently corrected population stratification. In the case of true causal effects, one would expect to observe this deviation mostly at the right side of the plot, whereas population stratification causes the deviation to start closer to the origin. In this case, BMI is extremely polygenic and the genome-wide association study (GWAS) was highly powered, which may also cause the deviation to start close to the origin, making it difficult to visually spot stratification. LDSC may be used to assess whether this inflation is due to bias or polygenicity.

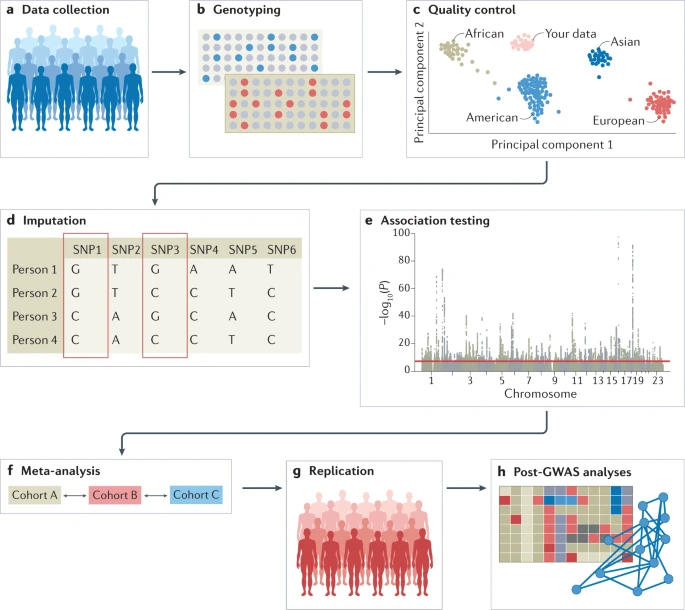
a | Genome-wide association studies (GWAS) are conducted to identify associated variants, often visualized as a Manhattan plot to show their genomic positions and strength of association. b | To prioritize likely causal variants, statistical fine-mapping is applied to identify a set of variants that are likely to include the causal variant (blue box) as well as the most likely causal variant (rs12345; blue dot). Massively parallel reporter assays can be used to measure whether alleles differ in their ability to drive gene expression or other molecular activity for each variant (not shown). c | Functional annotations of the genome can be integrated with GWAS data to identify epigenetic mechanisms that may be perturbed by the causal variant, including enhancers, promoters or other functional elements. Additional approaches include mapping molecular quantitative trait loci (molQTL) or in vitro assays (not shown). d | Target gene for a GWAS locus can be prioritized by mapping expression quantitative trait loci (eQTLs) (left) and their co-localization (right) to identify loci where the causal variant from GWAS is also a causal variant affecting gene expression. For GWAS variants in enhancers, high-throughput chromosome conformation capture (Hi-C) data and maps of enhancer target genes can be used together with simple prioritization by distance to identify genes affected by the causal variant (below). e | To identify pathways whose perturbation may mediate the trait in question (red box), one can analyse the enrichment of multiple GWAS-implicated genes in predefined pathways. Additional approaches include trans-eQTL mapping and CRISPR perturbation of GWAS loci/genes followed by cellular phenotyping (not shown). For these analyses, the context of a relevant tissue, cell type and cell state needs to be carefully considered and analysed. ATAC-seq, assay for transposase-accessible chromatin using sequencing; H3K27Ac, histone H3 acetylated at K27; SNP, single-nucleotide polymorphism.
Statistical fine-mapping
Many non-causal variants are significantly associated with a trait of interest owing to linkage disequilibrium; whether these reach the significance threshold depends on their level of correlation with and the strength of association of the causal variant12. The output of GWAS is therefore clustered in risk loci — sets of correlated variants that all show a statistically significant association with the trait of interest — and linkage disequilibrium typically prevents pinpointing causal variants without further analysis.
Fine-mapping is an in silico process designed to prioritize the set of variants that are most likely to be causal to the target phenotype within each of the genetic loci identified by GWAS, based on observed patterns of linkage disequilibrium and association statistics90,91. The set of variants that most parsimoniously explain regional association signals are defined as credible variants. The lead variant with the most significant association would be expected to be the most credible causal variant, although there are several situations where the most significant association may be non-causal. For example, where multiple independent risk variants are present in a locus, the combination of multiple signals can shift the most significant association from causal variants to a neighbouring non-causal variant. This can also occur owing to heterogeneity in variant genotype imputation quality, which induces fluctuations in the association signal statistics among neighbouring variants in linkage disequilibrium.
The simplest fine-mapping analysis is a conditional association analysis of the regional variants, which adjusts the regional association signals according to the set of variants in the locus by including the lead variant as a covariate in genotype–phenotype regression models. When multiple association signals exist, forward stepwise selection is commonly used until no associations remain. This method, known as stepwise conditional analysis, is limited to searching all of the combinatory patterns of potential credible variants. This is because the variant search pattern in each iterative step is strongly dependent on the previously selected variant sets and the lead initial step often includes the lead variant. When full genotype data are not available, conditional association analyses can be conducted on summary statistics using GCTA-COJO software92.
Several sophisticated fine-mapping approaches are based on Bayesian models, including CAVIAR93, FINEMAP94, PAINTOR95 and SuSIE96. These approaches optimize the selection of variables for a regression model by using a prior probability distribution, or prior, to estimate a posterior probability distribution, or posterior. An advantage of using Bayesian models over conditional association analysis is that priors can consider additional information such as imputation accuracy in addition to association signals; however, sets of credible variants output using Bayesian modelling are generally not consistent across different methods, especially when multiple independent association signals exist within a locus. In general, the statistical power to correctly detect credible variant sets declines as the number of independent signals increases96.
In silico fine-mapping can find credible variants that modulate the expression patterns and functions of causal genes (SNP to gene mapping) or contribute to the development of the target phenotype (SNP to biology mapping). A basic principle of successful fine-mapping is to expand the coverage of the genetic variants assessed by using, for example, WGS-based genotype imputation reference panels97. Reference panels with large samples sizes and/or that include other types of non-SNP genetic variants such as insertions, deletions and copy number variants can further expand the coverage of variants for fine-mapping. Recently released large-scale WGS resources with detailed variant annotations (such as the gnomAD98 and TOPMed22 databases, which contain >10,000 and >90,000 whole-genome sequences, respectively) serve as valuable resources for high-resolution fine-mapping. It should be noted that structural variants and short tandem repeats are not always accurately captured by current WGS technologies. Further, there are several regions where WGS-based imputation estimates genotypes inaccurately and custom imputation approaches may be needed to fine-map such regions. For example, the genomic region corresponding to the HLA complex (also known as the major histocompatibility complex (MHC)) is highly pleiotropic for various human traits related to the immune system and infectious disease99. The complicated linkage disequilibrium structure in this region prevents WGS-based SNP imputation from unambiguously determining their genotypes. The construction of HLA reference panels and custom imputation methods targeting HLA polymorphisms, such as the software packages SNP2HLA (refs100,101,102), HIBAG103 and HLA*IMP104, have provided a catalogue of HLA variant–phenotype association maps105. Customized regional imputation methods have also been reported for targeting missing variants at other gene loci; for example, the KIR*IMP software for the killer-cell immunoglobulin-like receptor (KIR) gene locus106. Specific resources also exist for use with mitochondrial genomes107.
Prioritization of a credible SNP over highly correlated SNPs with absolute linkage disequilibrium is challenging. Fine-mapping of associations from a GWAS for inflammatory bowel disease implicated a single candidate causal variant in only 12% of loci and 1–5 candidate causal variants in 30% of loci108, and fine-mapping of a breast cancer GWAS showed similar figures109. Prioritizing variants can be improved by integrating functional annotations of the SNPs — for example, expression quantitative trait loci (eQTLs) or epigenomic motifs — into the priors of the Bayesian fine-mapping models. A trans-ethnic GWAS meta-analysis can also help fine-mapping of highly correlated SNPs as differences in linkage disequilibrium structure among ancestries can narrow down the regional windows of associations91.
Functional inference from GWAS
A major motivation for conducting GWAS is to use the identified associations to determine the biological cause of heritable phenotypes and provide a starting point for investigating potential therapeutic interventions. Although GWAS have led to the identification of thousands of complex trait-associated genetic variants110 and fine-mapping has provided sets of credible SNPs, the biological implications of these variants are typically not easily inferred (with some exceptions111). After fine-mapping, the full mechanistic dissection of a locus identified by a GWAS includes identifying the immediate effects of causal variants (for example, on protein or enhancer function), the affected gene or genes in the locus that mediate the disease association, the downstream network or pathway effects that lead to changes in cellular and physiological function, and the relevant tissue, cell type and cell state for all these effects. Currently, this information exists for only a few loci, such as FTO112 and SORT1 (ref.113). However, a diverse set of approaches have been developed to infer the molecular effects of variants identified by GWAS.
Determining the affected gene
Prioritizing the likely affected gene is perhaps the most crucial part of the functional interpretation of GWAS loci. For the 2–3% of GWAS loci fine-mapped to coding variants1, tools such as ANNOVAR114 or VEP115 can be used to infer their potential effect on genes. However, the vast majority of associated, fine-mapped SNPs are located outside coding regions, do not affect protein structure and have unknown regulatory functions116,117. The causal gene or genes in the locus — those for which regulatory changes mediate disease association — are often those closest to the association signal118,119, although a recent preprint article suggests this is not always the case120. One approach for identifying regulatory target genes of genetic variants is molecular quantitative trait loci (molQTLs) analysis, which associates genetic variants with specific molecular phenotypes; for example, eQTL analysis identifies loci associated with RNA expression. The same approach can be applied to other molecular phenotypes such as splicing, chromatin accessibility or methylation status. By integrating this information with GWAS results, trait-associated variants can be mapped to the genes they are likely to regulate in specific tissues and the molecular processes mediating these associations121,122. Comprehensive, accessible QTL catalogues are available for community use; for example, the Genotype–Tissue Expression (GTEx) resource catalogues eQTL and splicing QTL for 49 tissues122, the eQTLGen resource provides a map of both cis-eQTL and trans-eQTL123 associations in blood with data from more than 30,000 donors and the eQTL Catalogue has compiled multiple eQTL data sets, as reported in a recent preprint article124. The eQTL framework can be extended to transcriptome-wide association studies125,126, where gene expression levels are imputed into data from GWAS and tested for association with a trait.
eQTL and splicing QTL approaches suffer from some limitations. As any non-causal variant in high linkage disequilibrium with a truly causal variant will likely show a statistical association with a trait, assigning a functional or regulatory effect to a variant does not automatically mean that the variant is causal. eQTLs should be integrated with GWAS data using co-localization approaches to pinpoint loci where the regulatory association and disease association share the same causal variant127,128,129. Further, eQTLs often affect several genes and, therefore, other data sources or functional annotations can be used to prioritize those genes that mediate disease. Finally, molQTL catalogues lack data from many relevant tissues, and data from specific cell types and molecular phenotypes other than expression and splicing are limited. Thus, although molQTL mapping is a powerful and popular approach for creating hypotheses for the regulatory mechanisms and target genes behind GWAS loci, such gene mapping approaches are not as conclusive as those for coding variants (although it should be noted that detectable coding variants for most genes are rare).
As an alternative to molQTL mapping, fine-mapped GWAS variants in enhancers can be linked to genes using methods based on chromatin conformation capture (3C), such as chromosome conformation capture on chip (4C), chromosome confirmation capture carbon copy (5C) and high-throughput chromosome conformation capture (Hi-C), which define regions of chromatin that are frequently in close spatial proximity and may reflect enhancer–promoter loops that control proximal or distal genes130,131. Other approaches include correlating enhancer and gene activities132 and performing large-scale experimental perturbation of enhancers133, although enhancer–gene catalogues are far from complete. There is still a need for methods that integrate different types of data for probabilistic prioritization of target genes at GWAS loci.
Recently, the development of highly scalable experimental assays for perturbation of the genome has expanded the functional genomics toolkit. These assays include massively parallel regulatory assays134, which test synthetic regulatory sequences by screening variants in thousands of untranscribed or untranslated sequences for functional effects in a single experiment, and CRISPR techniques that allow for the introduction of mutations into the genome and perturbation of regulatory element activity133,135. These approaches are increasingly popular and informative, but substantial work is still needed to improve the scalability and interpretability of the data. Although not restricted to existing genetic variation in linkage disequilibrium, they rely, to a large extent, on cellular model systems that may not always recapitulate cells in vivo. Furthermore, the integration of data from both human populations and experimental perturbations is still in its infancy.
Determining regulatory pathways and cellular effects
Highly polygenic signals from GWAS for any given trait converge on a limited number of biological processes, and the pathway-level effects of genetic variants can be determined and linked to cellular and physiological functions. One approach to achieve this is to test genes identified from GWAS and post-GWAS analyses for convergent functions using tools such as MAGMA136 and DEPICT137. These tools test sets of genes involved in specific biological pathways or linked to specific tissues, cell types, developmental stages or protein networks that are putative, proximal causes of the studied trait for association with that trait. The way gene sets are defined is critical; for example, a randomly chosen set of genes would not be biologically meaningful and sets created based on biological annotations rely on the accuracy of those annotations. We refer readers to a recent resource for defining gene sets13. Another approach is to associate genetic variants with molecular changes using trans-molQTL approaches to identify distal genes that are regulated by the GWAS locus. trans-eQTL have been shown to be strongly enriched among GWAS loci and have the potential to pinpoint distal genes regulated by the GWAS locus, although this approach requires molecular data from a large number of samples and the analysis and interpretation can be challenging122,138. Finally, experimental perturbation of genes followed by cellular phenotyping is becoming increasingly scalable and informative for interpretation of GWAS loci and genes139,140.
Considering the tissue type, cell type or cell state is essential for all functional interpretation work, and particularly important when analysing network effects as genes may have pleiotropic effects across different cellular contexts. For example, tissue-level molecular data can blend cell type-specific signals, further complicating interpretation or masking true signals from rare cell types. Upcoming single-cell and cell type-specific functional genomic data sets123,141 are therefore likely to advance GWAS interpretation.
Applications
Above, we have described how GWAS can pinpoint statistically associated variants and be used to understand the role of these variants in a biological context. The results of GWAS can also be used for applications such as predicting disease risk and understanding the genetic architecture of traits. We discuss several of these applications of GWAS below.
Risk prediction
PRSs are commonly used to predict the risk of disease in a target cohort using the GWAS summary statistics of an independent discovery cohort (Fig. 4). PRSs can be used to identify individuals at a high risk of disease for clinical interventions and provide additional information over traditional clinical risk scores for stratified screening. They are calculated as weighted sum scores of risk alleles, with weights based on the effect sizes from GWAS142,143. There are many methods for computing a PRS; the simplest and most practical method is pruning and thresholding, which involves selecting subsets of SNPs based on P values of statistical association with the trait144,145. More complex methods include those that model the linkage disequilibrium structure, incorporate functional information, weigh the results of multiple discovery cohorts in proportion to genome-wide admixture proportions and consider additional types of genomic or functional information; these methods can improve PRS prediction accuracy through improved estimation of marginal effect sizes146,147,148,149,150,151. Accuracy of the PRS can be assessed by various metrics, with the choice of metric based on downstream goals and whether the phenotype is continuous or binary. Accuracy measurements can be inflated if the discovery GWAS and the target cohort share individuals. For continuous traits, the phenotypic variance explained by the PRS is typically quantified as a coefficient of determination (R2). When computing effects of PRSs in GWAS regression models, covariates such as age, sex and ancestry are typically included, and PRS effects are assessed by comparing the difference in explained variance in two models, which can be written as follows:
where H0 represents the model used in the null hypothesis with no effect of the PRS, H1 represents the model used in the alternative hypothesis that does include an effect of PRS on the phenotype and e denotes an error term. Analysis of variance comparing these two models can be performed to determine the phenotypic variance explained specifically by the PRS term and not the other covariates included in the comparison model. For binary traits, pseudo-R2 values are typically computed using logistic regression models. To ensure that pseudo-R2 values are comparable across studies and scaled appropriately, these are typically interpreted on the liability scale by adjusting for the prevalence of a trait or disease152,153. The maximum predictive accuracy of polygenic scores is determined by the SNP-based heritability of the disease — the proportion of phenotypic variance explained by all SNPs — and the performance of PRS analysis depends on the polygenicity of the disease and the magnitude of the effect sizes of causal variants. One of the best-performing PRSs to date has been developed for glaucoma; individuals in the top decile of the score distribution have a 4.2-fold increase in risk compared with the bottom 90%154. A commonly used metric for assessing PRS accuracy is the area under the receiver operating characteristic curve (AUC). The AUC quantifies the performance of the models when the aim is to discriminate between two groups. For the best-performing model, a threshold must be set at which to classify individuals as high risk; choosing a threshold is based on weighing the costs and benefits of false positives versus false negatives, and is thus context-specific and often subjective (see ref.155 for software that can aid in selecting thresholds). Importantly, metrics such as the AUC or pseudo-R2 do not necessarily reflect clinical utility156,157. A high AUC or odds ratio (the odds of an event given an exposure versus the odds in the absence of an exposure) does not promise an enrichment of high-risk individuals in the top percentile of the score distribution158; a study converting odds ratios into other screening performance measures found that, at a 5% false positive rate, the polygenic score for coronary artery disease proposed in a recent study7 would miss 85% of individuals with diseases. Reclassification measures such as the net reclassification index are more clinically relevant than odds ratios or AUC curves and can assess the extent to which polygenic scores improve the reclassification of both patients and controls over existing clinical risk predictors159,160,161,162.

Step 1: genome-wide association studies (GWAS) summary statistics are obtained, which detail the effect of each single-nucleotide polymorphism (SNP) on the phenotype of interest. Step 2: genotype data for a set of individuals are referenced against GWAS summary statistics. Here, genotype data for four SNPs are shown for four individuals. Step 3: polygenic risk scores (PRSs) can be calculated for each individual by summing up the effect sizes of all risk alleles for each individual. Step 4: linear regression analysis is performed on the calculated PRS to assess the effect of the PRS on the outcome measure.
An obstacle to equitable clinical implementation of PRSs is that their accuracy decays with increasing ancestral distance between GWAS discovery cohorts and the target cohorts. As most discovery cohorts are European, this often results in PRSs that diminish in accuracy with ancestral distance from Europe163,164,165. The predictable basis of these disparities can be explained by differences in factors such as minor allele frequencies and linkage disequilibrium across populations. Further, subtle population stratification even within a single population is known to induce regional biases in the baseline values of PRS estimation29,166. Increasing diversity in GWAS discovery cohorts is the most impactful approach for improving PRS accuracy for all populations, with most benefit for populations currently under-represented in GWAS cohorts167,168.
The Polygenic Risk Score Reporting Standards169 and the Polygenic Score Catalog170, a database of PRSs, have recently been developed to improve the dissemination of PRSs and encourage their application and translation into clinical care. Such continued standardization of PRS reporting and deposition promises to increase the reproducibility of PRSs in the future.
Understanding trait genetic architecture
Determining the genetic architecture of a trait involves estimating the number of causal variants, their corresponding effect sizes and their frequencies, and allows the estimation of heritability, or the proportion of variation in the trait that can be explained by genetic variation in the population. Modern large-scale human genetics data sets commonly estimate heritability in genotyped data sets of unrelated individuals. There are numerous statistical methods and computational tools for quantifying heritability171. Approaches are typically delineated into broad-sense heritability (H2) — which measures the fraction of phenotypic variation explained by both additive and dominance effects — and narrow-sense heritability (h2), which considers additive effects only172. Population-based methods can estimate SNP-based heritability using individual-level genotype and phenotype data; for example, genome-based restricted maximum likelihood, as implemented in genome-wide complex trait analysis173, partitions variance component models with a genomic relationship matrix, which allows the regression of the level of phenotypic similarity on the level of genotypic similarity. Alternatively, linkage disequilibrium score regression can be used to estimate SNP-based heritability from GWAS summary statistics and a panel of linkage disequilibrium scores174. Importantly, SNP-based heritability only measures the variance explained by additive effects of the genotyped or imputed SNPs. Data discussed in a recent preprint article have highlighted the importance of including rare variants when assessing SNP-based heritability175. Indeed, whereas common variants contribute more to SNP-based heritability in a population176, rare variants can nevertheless have large effects in individuals177. Regardless of approach, heritability is importantly not a fixed entity and varies with age178, sex179, social factors180, phenotype precision and other complex factors. Ancestry heterogeneity is also important to consider, as population structure can inflate heritability estimates181.
Although it is informative to know heritability for a single trait, it is often more useful to understand the genetic relationships between multiple traits, as SNPs are often associated with many, sometimes seemingly unrelated, phenotypes8,182. Both linkage disequilibrium score regression and genome-wide complex trait analysis allow the estimation of genetic correlations, or the extent to which genetic variants that account for a trait are also important for another trait, provided that the effects are in the same direction. Tools such as superGNOVA183, ρ-HESS184 and LAVA185 from a recent preprint article allow the estimation of local correlations, determining which specific genomic regions exert genetic effects on the correlated phenotypes in the same or opposing directions. Genetic correlations should be interpreted in the context of SNP-based heritabilities; for example, if these are low for the respective phenotypes, genetic correlation is not expected to play a major part in explaining why two traits correlate at the phenotypic level. Further, genetic correlation does not provide information about causation between two traits. Indeed, genetic correlation can be caused by vertical pleiotropy, where trait A causes trait B; horizontal pleiotropy, where a variant directly influences two traits; linkage disequilibrium-induced horizontal pleiotropy, where two different variants that are in linkage disequilibrium each influence one of two traits; or polygenicity-induced pleiotropy, where multiple variants influence both traits and the underlying patterns are a mix of the above186.
Mendelian randomization can be employed to assess causal relations between different phenotypes using GWAS summary statistics187. Mendelian randomization is an epidemiological technique that uses genetic variants as instrumental variables acting as proxy measures for an environmental exposure. These techniques can be applied when a randomized control trial is not feasible. Although Mendelian randomization is a powerful design, there are several strong assumptions: the genetic variants used as instrumental variables need to be associated with the exposure; those genetic variants should not be associated with any confounding variables; and those genetic variants are only associated with the outcome through their effect on the exposure188.
Reproducibility and data deposition
GWAS for most traits require large (>10,000) sample sizes to yield reproducible results. Such sample sizes can only be generated through collaboration and data sharing agreements. Further, reproducible results depend on sound study design and robust methodology. To further the usefulness of GWAS results, a minimum set of statistics need to be reported. We discuss these considerations below.
Collaboration and data sharing in GWAS
One of the key factors driving the success of GWAS was an early commitment to collaboration and data sharing. In 1997, the Bermuda Principles set out that “all human genomic sequence information, generated by centres funded for large-scale human sequencing, should be freely available and in the public domain”. These principles were enforced in the 2003 Fort Lauderdale Agreement189, which proposed the continued prepublication release of genomic data as a community resource and suggested a system of responsibility where funders, data generators and data users all carry responsibility to foster the responsible sharing of genomic data before publication. Sharing of prepublication genomic data is now a standard condition of funding for genomics research projects. The existence of many genetics consortia and initiatives such as the Psychiatric Genomics Consortium and the recently formed COVID-19 Host Genetics Initiative190 build on these initial agreements and are enabled by the willingness of contributors to share and aggregate data. Attempts at fostering the interoperability of genomic databases through the agreement of shared principles and practices for data governance, for instance through the Global Alliance for Genomics and Health191, have strengthened the ability of researchers to share and use publicly available genomic data.
Data protections increasingly rely on specific consent by individuals before data can be shared or used. In the European Union, increased privacy protections introduced with the General Data Protection Regulation have introduced stringent requirements for de-identification and consent192, which complicates sharing of genomic data both within and between countries. Other jurisdictions, including some in Africa, have equally moved to increase privacy protections193. To address concerns about the impact of data protection legislation on research, researchers globally have argued for the development of codes of conduct for the sharing of genomic data in ways that are aligned with legislated data protection principles194. Codes of conduct would encourage data controllers or processors such as genomic research institutes to apply data protection provisions effectively and allow them to demonstrate compliance in a way that promotes national and international transfers of data. To date, the development of such codes of conduct has proven to be time and resource intensive, and it is not clear how perceived tensions between privacy concerns and sharing of research data will be adequately resolved. Other potential solutions are the introduction of separate privacy consent forms that particularly cover the use of personal information in research, the preparation of data privacy notices for participants and the completion of data privacy impact assessments for each research project. Several universities across Europe and North America have issued guidance to researchers for the preparation of privacy documents and templates for data privacy documents are available online.
To foster effective collaboration and to increase the use of genomic data — especially for rare conditions — it is essential that genomic data sets are interoperable. In recent years, steps have been taken to develop the tools and approaches that allow for interoperability. Central to this aim are the FAIR (findability, accessibility, interoperability, reusability) principles for scientific data management and stewardship195, which are now a condition of funding for many GWAS.
Data equity
An important ethical challenge relating to the sharing of genomic data relates to ensuring fairness for researchers. A key consideration is that data can be shared in a way that affords researchers across the world equal opportunities to analyse and publish results, including researchers in smaller institutions or based in lower-income and middle-income countries196. To address these concerns, initiatives such as the Ebola Data Platform and the H3Africa Consortium have identified principles and practices for governing genomics data to advance equity for researchers from lower-resourced countries197,198, including solidarity, reciprocity, transparency and trust199. Other broader concerns relate to mitigating harmful uses of publicly available data and ensuring public benefit. To address these various concerns, many international genomic research collaborations have turned to the use of governance frameworks. A recent analysis of these initiatives found five key functions of good governance for data sharing, namely that the governance framework enables data access, ensures legal compliance, supports appropriate data use and mitigates harms, promotes equity in the use of genomic data and uses genomic data for public benefit200.
In addition to the sharing of individual-level data, there is also an evolution towards the sharing of GWAS summary statistics. Databases such as the GWAS Catalog110 and GWAS Atlas8 allow easy access to summary statistics for thousands of traits (Table 3). Access to and use of GWAS summary statistics can further be improved through adoption of universal data formats, such as the recently proposed GWAS-VCF format201. Summary statistics should include the genomic build, SNP ID and location, allele, strand information, effect size and associated standard error, P value, test statistics, minor allele frequency and sample size.
Preregistration in GWAS
Preregistration of GWAS can improve reproducibility. In preregistration202, all analyses, variables, available protocols, data sets and analytic decisions are pre-specified and recorded before the study is conducted to prevent post hoc rationalizing and ‘HARKing’ (hypothesizing after results are known)203,204, which could potentially invalidate statistical inferences and inflate type I error rates. Indeed, these practices have contributed to a lack of reproducible results in genetic association studies205. Today, GWAS are generally performed in a hypothesis-free manner, and corrected, reported and published regardless of the results; however, post-GWAS analyses have many more researcher degrees of freedom and are, nowadays, more determinant of publication than the mere number of GWAS hits. Hence, there are more incentives and possibilities for questionable research practices206 and the benefit of preregistration is greater for these analyses. Analysis plans can be uploaded at the Open Science Framework with a preset moratorium. In a format known as registered reports207, peer review occurs before data are collected or analysed and is based on the introduction and methods sections alone. As a consequence, publication is conditional on methodological rigour as opposed to results, which aids in attenuating publication bias208. In contrast to preregistration, registered reports are submitted to specific journals that offer this scheme (more details can be found at the Open Science Framework Registered Reports resource). Preregistrations and registered reports are mostly used in data-generating research but can also be beneficial for the more common analysis of secondary data209,210.
Limitations and optimizations
GWAS have proven to be a highly successful method for identifying trait-associated variants, yet several outstanding methodological challenges still need to be addressed, such as population stratification and high polygenicity. Additionally, GWAS raise a range of ethical issues that require careful consideration, which we discuss below.
Methodological challenges
Population stratification
Although current methods can address unaccounted-for population stratification, it can still cause spurious or biased associations — particularly in the meta-analyses of multiple cohorts211,212. Effects are most pronounced in the analyses of polygenic scores that include thousands of SNPs below genome-wide significance29,213. Population stratification can occur even in homogeneous populations; for example, studies have uncovered population stratification and related bias in the UK Biobank, which is predominantly composed of white British participants214,215. As current methods for correcting the effects of stratification are based on common variants, such as principal component analysis or linear mixed models, they are insufficient when many rare variants are included in the analyses, especially when population stratification is driven by recent demographic changes26,30. Family-based association studies31,50,216 can avoid stratification, although they tend to be underpowered compared with population-based studies. Significant variants can be identified in population-based GWAS and effect sizes re-estimated in family-based studies to try to obtain estimates that are not confounded by population structure50,51,211,217. However, this approach cannot completely eliminate population stratification in PRS data if the lead SNPs identified in the original GWAS are correlated with the environment30,51. Further work is needed to better correct for population structure in GWAS and associated analyses. Methods based on principal component analysis of rare variants or identity by descent may be appropriate in cases of recently acquired population substructure.
Polygenicity
The extreme polygenicity of many traits8,11,218,219,220 can pose a challenge when attempting to uncover underlying biological mechanisms, particularly in cases where thousands of variants each have a small effect on a trait13,221. To avoid these issues, WES and WGS studies are increasingly being used to discover rare variants of large effect — particularly coding variants from exome sequencing — for which causal mechanisms are generally easier to elucidate87,222,223,224. Rare variants of large effect have yet to be reported for all traits and looking for convergence of the effects of thousands of variants remains the best strategy for traits not linked to rare variants of large effect. Further novel methods are needed that address polygenicity and facilitate translating the findings of GWAS into mechanistic insight. High polygenicity also implies that individuals with the same disease may have unique genetic profiles that map distinct biological routes towards the same disease. If genetic heterogeneity is also linked to treatment sensitivity, the development of novel treatments should take this into account. However, as it is mostly unknown how patients should be genetically stratified, this remains an outstanding challenge, with treatments not yet fully tailored to relevant genetic profiles.
Ethical challenges
In addition to the data protection and equity issues discussed in the Reproducibility and data deposition section, GWAS raise ethical issues relating to consent for future use of samples and data, storage and reuse of samples and data, privacy challenges and sharing data with individual participants. Over the past decade, apparent consensus amongst researchers and bioethicists suggests that broad and tiered consent models that seek permission for sample and data storage and unspecified future use are appropriate225,226,227. There is also apparent agreement in the research community that individual genetic research results that are medically actionable, robustly associated with the phenotype and predictive of conditions that are unlikely to have been otherwise diagnosed should be fed back to research participants if they consent to receive such results228,229, although this may not yet be possible in resource-scarce contexts230.
Arguably, the primary ethical challenge facing GWAS today relates to issues of diversity and inclusion, ensuring that GWAS result in fair opportunities to promote health and well-being for all humans regardless of race, gender or geographical location231,232. This means, amongst other factors, proactively working to ensure that the samples and data used for GWAS are representative of the global human population and that the genomics workforce is diverse. Equally important is the leadership that indigenous researchers in different parts of the world have shown in designing culturally appropriate approaches to indigenous genomics233,234 and the real-time tracking of diversity in GWAS235.
The increasing research on and clinical use of PRSs raise questions about the communication of risk information236,237 and raise issues regarding genetic determinism, the perception that traits are unavoidable and unalterable. First, PRSs have been proposed as a means for embryo selection based on GWAS results, which has proved to be highly controversial238. Second, genetic determinism may lead to stigma for patients or their family members239,240. Robust community engagement and the development of mitigation strategies are imperative in mitigating the possibility of stigmatization, as is ensuring that research teams have a high degree of cultural competence234. Additionally, researchers must not sensationalize or link their findings to pejorative stereotypes; an example of the latter is linking study findings to a supposed ‘warrior predisposition’ of the Maori241.
Finally, the growth of direct to consumer laboratory testing242 by companies offering genetic risk profiles or genetic ancestry information with sometimes questionable scientific validity243 and recruitment practices where scientists or companies recruit participants via the Internet244 raise important ethical challenges, including those around scientific evidence, the quality of the informed consent process, maintaining privacy and confidentiality, benefit sharing arrangements and challenges relating to social justice and equity. There are few agreed international guidelines or standards for ethical conduct in situations where GWAS and commercial interests are interwoven and there is great need for their development.
Outlook
Following the publication of the first GWAS 15 years ago, an impressive number of trait-associated variants have been revealed, along with important insights into biology. Current trends in GWAS include an increasingly interdisciplinary approach, covering statistics, data science, genetics and molecular biology. As sample sizes reach more than 1 million participants and genotyping and sequencing costs reduce, GWAS are increasingly using WES and WGS to allow the identification of rare variants, which could potentially explain much of the missing heritability in complex traits175,245,246 (however, see ref.246 for a discussion of potential methodological issues in ref.175). Minimal phenotyping may be a cost-effective and quick way of gaining power247 and deep phenotyping and item-level analyses248 are becoming important to further our understanding of distinct symptoms as opposed to diagnoses, which tend to be a collection of symptoms. Finally, the GWAS field is expanding to better represent the global community through the inclusion of under-represented populations.
GWAS could improve on the current low success rates and increasing costs and time required for drug development249. Retrospective reviews of drug development projects have shown that studies targeting GWAS disease risk genes were less likely to fail owing to lack of efficacy250. Drug discovery efforts have been especially successful when targeting rare variants identified by Mendelian pedigree studies; for example, the indication of an inhibitor of the key cholesterol metabolism regulator PCSK9 for hyperlipidaemia was inspired by the discovery of the rare PCSK9 loss-of-function variant249. Identifying drug targets from GWAS results is now a promising area of research. Chemical compounds that directly target the protein products of GWAS risk genes are promising candidates for drug repurposing; for example, CDK4/CDK6 inhibitors for rheumatoid arthritis251. Databases such as Open Targets252 and software such as GREP253 — which integrate connective networks among GWAS risk genes, compounds and clinical indications — should accelerate the integration of GWAS disease risk genes into drug discovery efforts.
Genetic studies of complex disease may inform the clinical application of therapies. GWAS for measures of treatment responses could allow for the stratification of individuals into responders and non-responders based on genetic factors. Further, integration of multi-omics data and the application of new machine learning approaches to these data sets could further improve patient stratification. A push for personalized medicine based on complex disease genetics seems ethically and economically necessary given that even the highest-grossing drugs in the United States only benefit from 1 in 4 to 1 in 24 patients254.
Lastly, GWAS results are now actively used to direct biomedical science in novel, transdisciplinary collaborations between geneticists and domain-specific molecular biologists. The International Common Disease Alliance has assembled a host of funders and scientists in academia and industry with the aim of using genetic disease maps to gain biological and medical insight into common diseases. Similarly, the goal of the BRAINSCAPES consortium is to bridge the gap between genetics and neurobiology by designing and conducting GWAS-informed functional follow-up studies. The promise of the next 15 years of GWAS is thus to gain biological insight into more refined phenotypes, link genetics to biology, develop genetically informed drug treatments, improve clinical risk prediction and ensure that these have positive impacts for the global community.
References
Visscher, P. M. et al. 10 years of GWAS discovery: biology, function, and translation. Am. J. Hum. Genet. 101, 5–22 (2017). This article provides an excellent overview of the main conclusions from 10 years of GWAS and addresses future challenges for the field.
Frayling, T. M. et al. A common variant in the FTO gene is associated with body mass index and predisposes to childhood and adult obesity. Science 316, 889–894 (2007).
Siminovitch, K. A. PTPN22 and autoimmune disease. Nat. Genet. 36, 1248–1249 (2004).
Wang, K. et al. Diverse genome-wide association studies associate the IL12/IL23 pathway with Crohn disease. Am. J. Hum. Genet. 84, 399–405 (2009).
Moschen, A. R., Tilg, H. & Raine, T. IL-12, IL-23 and IL-17 in IBD: immunobiology and therapeutic targeting. Nat. Rev. Gastroenterol. Hepatol. 16, 185–196 (2019).
Benjamin, D. J. et al. The promises and pitfalls of genoeconomics. Annu. Rev. Econ. 4, 627–662 (2012).
Khera, A. V. et al. Genome-wide polygenic scores for common diseases identify individuals with risk equivalent to monogenic mutations. Nat. Genet. 50, 1219–1224 (2018).
Watanabe, K. et al. A global overview of pleiotropy and genetic architecture in complex traits. Nat. Genet. 51, 1339–1348 (2019). This paper analyses thousands of complex traits to chart the extent of pleiotropy in the human genome, finding trait-associated loci spread across much of the genome, and the majority associated with more than one trait.
Lee, J. J. et al. Gene discovery and polygenic prediction from a genome-wide association study of educational attainment in 1.1 million individuals. Nat. Genet. 50, 1112–1121 (2018).
Jansen, P. R. et al. Genome-wide analysis of insomnia in 1,331,010 individuals identifies new risk loci and functional pathways. Nat. Genet. 51, 394–403 (2019). Together with Lee et al. (2018), this study was the first GWAS to have a sample size >1,000,000.
Holland, D. et al. Beyond SNP heritability: polygenicity and discoverability of phenotypes estimated with a univariate Gaussian mixture model. PLOS Genet. 16, e1008612 (2020).
Slatkin, M. Linkage disequilibrium — understanding the evolutionary past and mapping the medical future. Nat. Rev. Genet. 9, 477–485 (2008).
Uffelmann, E. & Posthuma, D. Emerging methods and resources for biological interrogation of neuropsychiatric polygenic signal. Biol. Psychiatry 89, 41–53 (2021).
Skol, A. D., Scott, L. J., Abecasis, G. R. & Boehnke, M. Joint analysis is more efficient than replication-based analysis for two-stage genome-wide association studies. Nat. Genet. 38, 209–213 (2006).
Purcell, S., Cherny, S. S. & Sham, P. C. Genetic Power Calculator: design of linkage and association genetic mapping studies of complex traits. Bioinformatics 19, 149–150 (2003).
Holmes, M. V., Ala-Korpela, M. & Smith, G. D. Mendelian randomization in cardiometabolic disease: challenges in evaluating causality. Nat. Rev. Cardiol. 14, 577–590 (2017).
Fry, A. et al. Comparison of sociodemographic and health-related characteristics of UK biobank participants with those of the general population. Am. J. Epidemiol. 186, 1026–1034 (2017).
Nagai, A. et al. Overview of the BioBank Japan Project: study design and profile. J. Epidemiol. 27, S2–S8 (2017).
Rietveld, C. A. et al. Common genetic variants associated with cognitive performance identified using the proxy-phenotype method. Proc. Natl Acad. Sci. USA 111, 13790–13794 (2014).
Purcell, S. et al. PLINK: a tool set for whole-genome association and population-based linkage analyses. Am. J. Hum. Genet. 81, 559–575 (2007).
Auton, A. et al. A global reference for human genetic variation. Nature 526, 68–74 (2015).
Taliun, D. et al. Sequencing of 53,831 diverse genomes from the NHLBI TOPMed program. Nature 590, 290–299 (2021).
Lam, M. et al. RICOPILI: rapid imputation for COnsortias PIpeLIne. Bioinformatics 36, 930–933 (2020).
Marchini, J., Cardon, L. R., Phillips, M. S. & Donnelly, P. The effects of human population structure on large genetic association studies. Nat. Genet. 36, 512–517 (2004).
Novembre, J. et al. Genes mirror geography within Europe. Nature 456, 98–101 (2008).
Lawson, D. J. et al. Is population structure in the genetic biobank era irrelevant, a challenge, or an opportunity? Hum. Genet. 139, 23–41 (2020).
Morris, T. T., Davies, N. M., Hemani, G. & Smith, G. D. Population phenomena inflate genetic associations of complex social traits. Sci. Adv. 6, eaay0328 (2020).
Young, A. I. et al. Relatedness disequilibrium regression estimates heritability without environmental bias. Nat. Genet. 50, 1304–1310 (2018).
Kerminen, S. et al. Geographic variation and bias in the polygenic scores of complex diseases and traits in Finland. Am. J. Hum. Genet. 104, 1169–1181 (2019).
Zaidi, A. A. & Mathieson, I. Demographic history mediates the effect of stratification on polygenic scores. eLife 9, e61548 (2020). This paper investigates the effects of residual population structure on GWAS in simulated populations with different demographic histories and shows that commonly used methods such as principal components of common variants cannot correct for recent population stratification.
Brumpton, B. et al. Avoiding dynastic, assortative mating, and population stratification biases in Mendelian randomization through within-family analyses. Nat. Commun. 11, 3519 (2020).
Lander, E. S. & Schork, N. J. Genetic dissection of complex traits. Science 265, 2037–2048 (1994).
Price, A. L. et al. Principal components analysis corrects for stratification in genome-wide association studies. Nat. Genet. 38, 904–909 (2006).
Pirinen, M., Donnelly, P. & Spencer, C. C. A. Including known covariates can reduce power to detect genetic effects in case–control studies. Nat. Genet. 44, 848–851 (2012).
Zhou, W. et al. Efficiently controlling for case–control imbalance and sample relatedness in large-scale genetic association studies. Nat. Genet. 50, 1335–1341 (2018).
Loh, P.-R., Kichaev, G., Gazal, S., Schoech, A. P. & Price, A. L. Mixed-model association for biobank-scale datasets. Nat. Genet. 50, 906–908 (2018).
Jiang, L. et al. A resource-efficient tool for mixed model association analysis of large-scale data. Nat. Genet. 51, 1749–1755 (2019).
Altshuler, D. & Donnelly, P., The International HapMap Consortium. A haplotype map of the human genome. Nature 437, 1299–1320 (2005).
Willer, C. J., Li, Y. & Abecasis, G. R. METAL: fast and efficient meta-analysis of genomewide association scans. Bioinformatics 26, 2190–2191 (2010).
Baselmans, B. M. L. et al. Multivariate genome-wide analyses of the well-being spectrum. Nat. Genet. 51, 445–451 (2019).
Rangamaran, V. R., Uppili, B., Gopal, D. & Ramalingam, K. EasyQC: tool with interactive user interface for efficient next-generation sequencing data quality control. J. Comput. Biol. 25, 1301–1311 (2018).
Winkler, T. W. et al. Quality control and conduct of genome-wide association meta-analyses. Nat. Protoc. 9, 1192–1212 (2014).
Wu, M. C. et al. Rare-variant association testing for sequencing data with the sequence kernel association test. Am. J. Hum. Genet. 89, 82–93 (2011).
Neale, B. M. et al. Testing for an unusual distribution of rare variants. PLoS Genet. 7, e1001322 (2011).
Zaitlen, N. et al. Informed conditioning on clinical covariates increases power in case–control association studies. PLoS Genet. 8, e1003032 (2012).
Moskvina, V., Holmans, P., Schmidt, K. M. & Craddock, N. Design of case–controls studies with unscreened controls. Ann. Hum. Genet. 69, 566–576 (2005).
Pirastu, N. et al. Genetic analyses identify widespread sex-differential participation bias. Nat. Genet. 53, 663–671 (2021).
Benyamin, B., Visscher, P. M. & McRae, A. F. Family-based genome-wide association studies. Pharmacogenomics 10, 181–190 (2009).
Teng, J. & Risch, N. The relative power of family-based and case–control designs for linkage disequilibrium studies of complex human diseases. II. individual genotyping. Genome Res. 9, 234–241 (1999).
Mostafavi, H. et al. Variable prediction accuracy of polygenic scores within an ancestry group. eLife 9, e48376 (2020).
Robinson, M. R. et al. Population genetic differentiation of height and body mass index across Europe. Nat. Genet. 47, 1357–1362 (2015).
Purcell, S., Sham, P. & Daly, M. J. Parental phenotypes in family-based association analysis. Am. J. Hum. Genet. 76, 249–259 (2005).
Abecasis, G. R., Cardon, L. R. & Cookson, W. O. C. A general test of association for quantitative traits in nuclear families. Am. J. Hum. Genet. 66, 279–292 (2000).
Fulker, D. W., Cherny, S. S., Sham, P. C. & Hewitt, J. K. Combined linkage and association sib-pair analysis for quantitative traits. Am. J. Hum. Genet. 64, 259–267 (1999).
Zhou, X. & Stephens, M. Genome-wide efficient mixed-model analysis for association studies. Nat. Genet. 44, 821–824 (2012).
Mbatchou, J. et al. Computationally efficient whole-genome regression for quantitative and binary traits. Nat. Genet. 5, 1097–1103 (2021).
Kong, A. et al. The nature of nurture: effects of parental genotypes. Science 359, 424–428 (2018). This paper shows for the first time that part of the signal in the GWAS for some traits is from ‘indirect genetic effects’ that act through parents rather than directly on the index individual, and shows how these can be disentangled with family data.
Bates, T. C. et al. The nature of nurture: using a virtual-parent design to test parenting effects on children’s educational attainment in genotyped families. Twin Res. Hum. Genet. 21, 73–83 (2018).
Young, A. I. et al. Mendelian imputation of parental genotypes for genome-wide estimation of direct and indirect genetic effects. Preprint at bioRxiv https://doi.org/10.1101/2020.07.02.185199v1 (2020).
Howe, L. J. et al. Within-sibship GWAS improve estimates of direct genetic effects. Preprint at bioRxiv https://doi.org/10.1101/2021.03.05.433935v1 (2021). This study is the largest within-sibship GWAS to date and illustrates the value of this method for disentangling direct genetic effects from indirect genetic effects and population structure.
Liu, J. Z., Erlich, Y. & Pickrell, J. K. Case–control association mapping by proxy using family history of disease. Nat. Genet. 49, 325–331 (2017).
Hujoel, M. L. A., Gazal, S., Loh, P.-R., Patterson, N. & Price, A. L. Liability threshold modeling of case–control status and family history of disease increases association power. Nat. Genet. 52, 541–547 (2020).
Hatzikotoulas, K., Gilly, A. & Zeggini, E. Using population isolates in genetic association studies. Brief. Funct. Genomics 13, 371–377 (2014).
Xue, Y. et al. Enrichment of low-frequency functional variants revealed by whole-genome sequencing of multiple isolated European populations. Nat. Commun. 8, 15927 (2017).
Chheda, H. et al. Whole-genome view of the consequences of a population bottleneck using 2926 genome sequences from Finland and United Kingdom. Eur. J. Hum. Genet. 25, 477–484 (2017).
Lim, E. T. et al. Distribution and medical impact of loss-of-function variants in the finnish founder population. PLoS Genet. 10, e1004494 (2014). This paper gives a good illustration of the value of isolated populations for identifying founder variants of large effect that are rare in other populations.
Service, S. et al. Magnitude and distribution of linkage disequilibrium in population isolates and implications for genome-wide association studies. Nat. Genet. 38, 556–560 (2006).
Kong, A. et al. Detection of sharing by descent, long-range phasing and haplotype imputation. Nat. Genet. 40, 1068–1075 (2008).
Palin, K., Campbell, H., Wright, A. F., Wilson, J. F. & Durbin, R. Identity-by-descent-based phasing and imputation in founder populations using graphical models. Genet. Epidemiol. 35, 853–860 (2011).
Glodzik, D. et al. Inference of identity by descent in population isolates and optimal sequencing studies. Eur. J. Hum. Genet. 21, 1140–1145 (2013).
Uricchio, L. H., Chong, J. X., Ross, K. D., Ober, C. & Nicolae, D. L. Accurate imputation of rare and common variants in a founder population from a small number of sequenced individuals. Genet. Epidemiol. 36, 312–319 (2012).
Herzig, A. F. et al. Strategies for phasing and imputation in a population isolate. Genet. Epidemiol. 42, 201–213 (2018).
Zeggini, E., Gloyn, A. L. & Hansen, T. Insights into metabolic disease from studying genetics in isolated populations: stories from Greece to Greenland. Diabetologia 59, 938–941 (2016).
Sidore, C. et al. Genome sequencing elucidates Sardinian genetic architecture and augments association analyses for lipid and blood inflammatory markers. Nat. Genet. 47, 1272–1281 (2015).
Do, R. et al. Exome sequencing identifies rare LDLR and APOA5 alleles conferring risk for myocardial infarction. Nature 518, 102–106 (2015).
Bycroft, C. et al. The UK Biobank resource with deep phenotyping and genomic data. Nature 562, 203–209 (2018). This paper describes the production of genetic data for the UK Biobank, which has been widely used in GWAS.
Yengo, L. et al. Meta-analysis of genome-wide association studies for height and body mass index in ∼700000 individuals of European ancestry. Hum. Mol. Genet. 27, 3641–3649 (2018).
Astle, W. J. et al. The allelic landscape of human blood cell trait variation and links to common complex disease. Cell 167, 1415–1429.e19 (2016).
Sinnott-Armstrong, N. et al. Genetics of 35 blood and urine biomarkers in the UK Biobank. Nat. Genet. 53, 185–194 (2021).
Hill, W. D. et al. A combined analysis of genetically correlated traits identifies 187 loci and a role for neurogenesis and myelination in intelligence. Mol. Psychiatry 24, 169–181 (2019).
Elliott, L. T. et al. Genome-wide association studies of brain imaging phenotypes in UK Biobank. Nature 562, 210–216 (2018).
Thorp, J. G. et al. Symptom-level modelling unravels the shared genetic architecture of anxiety and depression. Nat. Hum. Behav. https://doi.org/10.1038/s41562-021-01094-9 (2021).
Christophersen, I. E. et al. Large-scale analyses of common and rare variants identify 12 new loci associated with atrial fibrillation. Nat. Genet. 49, 946–952 (2017).
Ferreira, M. A. R. et al. Age-of-onset information helps identify 76 genetic variants associated with allergic disease. PLoS Genet. 16, e1008725 (2020).
Purves, K. L. et al. A major role for common genetic variation in anxiety disorders. Mol. Psychiatry https://doi.org/10.1038/s41380-019-0559-1 (2019).
Peterson, R. E. et al. Genome-wide association studies in ancestrally diverse populations: opportunities, methods, pitfalls, and recommendations. Cell 179, 589–603 (2019).
Van Hout, C. V. et al. Exome sequencing and characterization of 49,960 individuals in the UK Biobank. Nature 586, 749–756 (2020).
Watanabe, K., Taskesen, E., van Bochoven, A. & Posthuma, D. Functional mapping and annotation of genetic associations with FUMA. Nat. Commun. 8, 1826 (2017).
Pruim, R. J. et al. LocusZoom: regional visualization of genome-wide association scan results. Bioinformatics 26, 2336–2337 (2010).
Raychaudhuri, S. Mapping rare and common causal alleles for complex human diseases. Cell 147, 57–69 (2011).
Schaid, D. J., Chen, W. & Larson, N. B. From genome-wide associations to candidate causal variants by statistical fine-mapping. Nat. Rev. Genet. 19, 491–504 (2018).
Yang, J. et al. Conditional and joint multiple-SNP analysis of GWAS summary statistics identifies additional variants influencing complex traits. Nat. Genet. 44, 369–375 (2012).
Hormozdiari, F., Kostem, E., Kang, E. Y., Pasaniuc, B. & Eskin, E. Identifying causal variants at loci with multiple signals of association. Genetics 198, 497–508 (2014).
Benner, C. et al. FINEMAP: efficient variable selection using summary data from genome-wide association studies. Bioinformatics 32, 1493–1501 (2016).
Kichaev, G. et al. Integrating functional data to prioritize causal variants in statistical fine-mapping studies. PLoS Genet. 10, e1004722 (2014).
Wang, G., Sarkar, A., Carbonetto, P. & Stephens, M. A simple new approach to variable selection in regression, with application to genetic fine mapping. J. R. Stat. Soc. Ser. B Stat. Methodol. 82, 1273–1300 (2020).
Durbin, R. M. et al. A map of human genome variation from population-scale sequencing. Nature 467, 1061–1073 (2010).
Karczewski, K. J. et al. The mutational constraint spectrum quantified from variation in 141,456 humans. Nature 581, 434–443 (2020).
Dendrou, C. A., Petersen, J., Rossjohn, J. & Fugger, L. HLA variation and disease. Nat. Rev. Immunol. 18, 325–339 (2018).
Study, T. I. H. C. The major genetic determinants of HIV-1 control affect HLA class I peptide presentation. Science 330, 1551–1557 (2010).
Raychaudhuri, S. et al. Five amino acids in three HLA proteins explain most of the association between MHC and seropositive rheumatoid arthritis. Nat. Genet. 44, 291–296 (2012).
Jia, X. et al. Imputing amino acid polymorphisms in human leukocyte antigens. PLoS ONE 8, e64683 (2013).
Zheng, X. et al. HIBAG — HLA genotype imputation with attribute bagging. Pharmacogenomics J. 14, 192–200 (2014).
Dilthey, A. T., Moutsianas, L., Leslie, S. & McVean, G. HLA*IMP — an integrated framework for imputing classical HLA alleles from SNP genotypes. Bioinformatics 27, 968–972 (2011).
Hirata, J. et al. Genetic and phenotypic landscape of the major histocompatibilty complex region in the Japanese population. Nat. Genet. 51, 470–480 (2019).
Vukcevic, D. et al. Imputation of KIR types from SNP variation data. Am. J. Hum. Genet. 97, 593–607 (2015).
Yamamoto, K. et al. Genetic and phenotypic landscape of the mitochondrial genome in the Japanese population. Commun. Biol. 3, 1–11 (2020).
Huang, H. et al. Fine-mapping inflammatory bowel disease loci to single variant resolution. Nature 547, 173–178 (2017).
Fachal, L. et al. Fine-mapping of 150 breast cancer risk regions identifies 191 likely target genes. Nat. Genet. 52, 56–73 (2020).
Buniello, A. et al. The NHGRI-EBI GWAS Catalog of published genome-wide association studies, targeted arrays and summary statistics 2019. Nucleic Acids Res. 47, D1005–D1012 (2019).
Sinnott-Armstrong, N., Naqvi, S., Rivas, M. & Pritchard, J. K. GWAS of three molecular traits highlights core genes and pathways alongside a highly polygenic background. eLife 10, e58615 (2021).
Smemo, S. et al. Obesity-associated variants within FTO form long-range functional connections with IRX3. Nature 507, 371–375 (2014).
Musunuru, K. et al. From noncoding variant to phenotype via SORT1 at the 1p13 cholesterol locus. Nature 466, 714–719 (2010).
Wang, K., Li, M. & Hakonarson, H. ANNOVAR: functional annotation of genetic variants from high-throughput sequencing data. Nucleic Acids Res. 38, e164–e164 (2010).
McLaren, W. et al. The Ensembl Variant Effect Predictor. Genome Biol. 17, 122 (2016).
Maurano, M. T. et al. Systematic localization of common disease-associated variation in regulatory DNA. Science 337, 1190–1195 (2012).
Tak, Y. G. & Farnham, P. J. Making sense of GWAS: using epigenomics and genome engineering to understand the functional relevance of SNPs in non-coding regions of the human genome. Epigenetics Chromatin 8, 57 (2015).
Barbeira, A. N. et al. Exploiting the GTEx resources to decipher the mechanisms at GWAS loci. Genome Biol. 22, 49 (2021).
Nasser, J. et al. Genome-wide enhancer maps link risk variants to disease genes. Nature 593, 238–243 (2021).
Morris, J. A. et al. Discovery of target genes and pathways of blood trait loci using pooled CRISPR screens and single cell RNA sequencing. Preprint at bioRxiv https://doi.org/10.1101/2021.04.07.438882v1 (2021).
Li, Y. I. et al. RNA splicing is a primary link between genetic variation and disease. Science 352, 600–604 (2016).
GTEx Consortium. The GTEx Consortium atlas of genetic regulatory effects across human tissues. Science 369, 1318–1330 (2020).
van der Wijst, M. et al. The single-cell eQTLGen consortium. eLife 9, e52155 (2020).
Kerimov, N. et al. eQTL Catalogue: a compendium of uniformly processed human gene expression and splicing QTLs. Preprint at bioRxiv https://doi.org/10.1101/2020.01.29.924266v1 (2020).
Gusev, A. et al. Integrative approaches for large-scale transcriptome-wide association studies. Nat. Genet. 48, 245–252 (2016).
GTEx Consortium et al. A gene-based association method for mapping traits using reference transcriptome data. Nat. Genet. 47, 1091–1098 (2015).
Hormozdiari, F. et al. Colocalization of GWAS and eQTL signals detects target genes. Am. J. Hum. Genet. 99, 1245–1260 (2016).
Wen, X., Pique-Regi, R. & Luca, F. Integrating molecular QTL data into genome-wide genetic association analysis: probabilistic assessment of enrichment and colocalization. PLoS Genet. 13, e1006646 (2017).
Giambartolomei, C. et al. Bayesian test for colocalisation between pairs of genetic association studies using summary statistics. PLoS Genet. 10, e1004383 (2014).
Kleinjan, D. A. & van Heyningen, V. Long-range control of gene expression: emerging mechanisms and disruption in disease. Am. J. Hum. Genet. 76, 8–32 (2005).
Greenwald, W. W. et al. Subtle changes in chromatin loop contact propensity are associated with differential gene regulation and expression. Nat. Commun. 10, 1054 (2019).
Thurman, R. E. et al. The accessible chromatin landscape of the human genome. Nature 489, 75–82 (2012).
Gasperini, M. et al. A genome-wide framework for mapping gene regulation via cellular genetic screens. Cell 176, 377–390.e19 (2019).
Mulvey, B., Lagunas, T. & Dougherty, J. D. Massively parallel reporter assays: defining functional psychiatric genetic variants across biological contexts. Biol. Psychiatry https://doi.org/10.1016/j.biopsych.2020.06.011 (2020).
Canver, M. C. et al. BCL11A enhancer dissection by Cas9-mediated in situ saturating mutagenesis. Nature 527, 192–197 (2015).
de Leeuw, C. A., Mooij, J. M., Heskes, T. & Posthuma, D. MAGMA: generalized gene-set analysis of GWAS data. PLoS Comput. Biol. 11, e1004219 (2015).
Pers, T. H. et al. Biological interpretation of genome-wide association studies using predicted gene functions. Nat. Commun. 6, 5890 (2015).
Võsa, U. et al. Unraveling the polygenic architecture of complex traits using blood eQTL metaanalysis. Preprint at bioRxiv https://doi.org/10.1101/447367 (2018).
Dixit, A. et al. Perturb-seq: dissecting molecular circuits with scalable single-cell RNA profiling of pooled genetic screens. Cell 167, 1853–1866.e17 (2016).
Adamson, B. et al. A multiplexed single-cell CRISPR screening platform enables systematic dissection of the unfolded protein response. Cell 167, 1867–1882.e21 (2016).
Regev, A. et al. The Human Cell Atlas. eLife 6, e27041 (2017).
Choi, S. W., Mak, T. S.-H. & O’Reilly, P. F. Tutorial: a guide to performing polygenic risk score analyses. Nat. Protoc. 15, 2759–2772 (2020).
Martin, A. R., Daly, M. J., Robinson, E. B., Hyman, S. E. & Neale, B. M. Predicting polygenic risk of psychiatric disorders. Biol. Psychiatry 86, 97–109 (2019).
Euesden, J., Lewis, C. M. & O’Reilly, P. F. PRSice: polygenic risk score software. Bioinformatics 31, 1466–1468 (2015).
International Schizophrenia Consortium. et al. Common polygenic variation contributes to risk of schizophrenia and bipolar disorder. Nature 460, 748–752 (2009).
Ge, T., Chen, C.-Y., Ni, Y., Feng, Y.-C. A. & Smoller, J. W. Polygenic prediction via Bayesian regression and continuous shrinkage priors. Nat. Commun. 10, 1776 (2019).
Lloyd-Jones, L. R. et al. Improved polygenic prediction by Bayesian multiple regression on summary statistics. Nat. Commun. 10, 5086 (2019).
Márquez-Luna, C., Loh, P.-R., South Asian Type 2 Diabetes (SAT2D) Consortium, SIGMA Type 2 Diabetes Consortium & Price, A. L. Multiethnic polygenic risk scores improve risk prediction in diverse populations. Genet. Epidemiol. 41, 811–823 (2017).
Márquez-Luna, C. et al. Modeling functional enrichment improves polygenic prediction accuracy in UK Biobank and 23andMe data sets. Preprint at bioRxiv https://doi.org/10.1101/375337v1 (2018).
Privé, F., Arbel, J. & Vilhjálmsson, B. J. LDpred2: better, faster, stronger. Bioinformatics https://doi.org/10.1093/bioinformatics/btaa1029 (2020).
Vilhjálmsson, B. J. et al. Modeling linkage disequilibrium increases accuracy of polygenic risk scores. Am. J. Hum. Genet. 97, 576–592 (2015).
Lee, S. H., Wray, N. R., Goddard, M. E. & Visscher, P. M. Estimating missing heritability for disease from genome-wide association studies. Am. J. Hum. Genet. 88, 294–305 (2011).
Golan, D., Lander, E. S. & Rosset, S. Measuring missing heritability: inferring the contribution of common variants. Proc. Natl Acad. Sci. USA 111, E5272–E5281 (2014).
Craig, J. E. et al. Multitrait analysis of glaucoma identifies new risk loci and enables polygenic prediction of disease susceptibility and progression. Nat. Genet. 52, 160–166 (2020).
López-Ratón, M., Rodríguez-Álvarez, M. X., Cadarso-Suárez, C. & Gude-Sampedro, F. OptimalCutpoints: an R package for selecting optimal cutpoints in diagnostic tests. J. Stat. Softw. 61, 1–36 (2014).
Wald, N. J. & Old, R. The illusion of polygenic disease risk prediction. Genet. Med. 21, 1705–1707 (2019).
Mihaescu, R. et al. Improvement of risk prediction by genomic profiling: reclassification measures versus the area under the receiver operating characteristic curve. Am. J. Epidemiol. 172, 353–361 (2010).
Li, R., Chen, Y., Ritchie, M. D. & Moore, J. H. Electronic health records and polygenic risk scores for predicting disease risk. Nat. Rev. Genet. 21, 493–502 (2020).
Mars, N. et al. Polygenic and clinical risk scores and their impact on age at onset and prediction of cardiometabolic diseases and common cancers. Nat. Med. 26, 549–557 (2020).
Riveros-Mckay, F. et al. Integrated polygenic tool substantially enhances coronary artery disease prediction. Circ. Genomic Precis. Med. 14, e003304 (2021). This paper proposes a method to integrate clinical risk scores and PRSs for coronary artery disease and shows the improved predictive accuracy of PRSs over established clinical risk factors in European-ancestry individuals from the UK Biobank.
Sun, L. et al. Polygenic risk scores in cardiovascular risk prediction: a cohort study and modelling analyses. PLoS Med. 18, e1003498 (2021). This paper recalibrated risk prediction models in the UK Biobank to what would be expected in an unbiased UK population to account for the bias caused by UK Biobank participants being healthier and wealthier, which is seldom considered in other studies in this field.
Weale, M. E. et al. Validation of an integrated risk tool, including polygenic risk score, for atherosclerotic cardiovascular disease in multiple ethnicities and ancestries. Am. J. Cardiol. 148, 157–164 (2021). This paper applies the integrated model proposed by Riveros-Mckay et al. (2021) to diverse populations in the UK Biobank and provides the first cross-ancestry validation of the clinical utility of adding polygenic scores into clinical risk tools.
Martin, A. R. et al. Human demographic history impacts genetic risk prediction across diverse populations. Am. J. Hum. Genet. 100, 635–649 (2017).
Martin, A. R. et al. Clinical use of current polygenic risk scores may exacerbate health disparities. Nat. Genet. 51, 584–591 (2019).
Scutari, M., Mackay, I. & Balding, D. Using genetic distance to infer the accuracy of genomic prediction. PLoS Genet. 12, e1006288 (2016).
Sakaue, S. et al. Functional variants in ADH1B and ALDH2 are non-additively associated with all-cause mortality in Japanese population. Eur. J. Hum. Genet. 28, 378–382 (2020).
Cavazos, T. B. & Witte, J. S. Inclusion of variants discovered from diverse populations improves polygenic risk score transferability. HGG Adv. 2, 100017 (2021).
Lam, M. et al. Comparative genetic architectures of schizophrenia in East Asian and European populations. Nat. Genet. 51, 1670–1678 (2019).
Wand, H. et al. Improving reporting standards for polygenic scores in risk prediction studies. Nature 591, 211–219 (2021).
Lambert, S. A. et al. The Polygenic Score Catalog as an open database for reproducibility and systematic evaluation. Nat. Genet. 53, 420–425 (2021).
Fisher, R. A. XV. — The correlation between relatives on the supposition of Mendelian inheritance. Earth Environ. Sci. Trans. R. Soc. Edinb. 52, 399–433 (1919).
Falconer, D. S. & Mackay, T. F. C. Introduction to Quantitative Genetics (Pearson, Prentice Hall, 2009).
Yang, J., Lee, S. H., Goddard, M. E. & Visscher, P. M. GCTA: a tool for genome-wide complex trait analysis. Am. J. Hum. Genet. 88, 76–82 (2011).
Schizophrenia Working Group of the Psychiatric Genomics Consortium. et al. LD score regression distinguishes confounding from polygenicity in genome-wide association studies. Nat. Genet. 47, 291–295 (2015).
Wainschtein, P. et al. Recovery of trait heritability from whole genome sequence data. Preprint at bioRxiv https://doi.org/10.1101/588020 (2019).
Schoech, A. P. et al. Quantification of frequency-dependent genetic architectures in 25 UK Biobank traits reveals action of negative selection. Nat. Commun. 10, 790 (2019).
Bomba, L., Walter, K. & Soranzo, N. The impact of rare and low-frequency genetic variants in common disease. Genome Biol. 18, 77 (2017).
Bergen, S. E., Gardner, C. O. & Kendler, K. S. Age-related changes in heritability of behavioral phenotypes over adolescence and young adulthood: a meta-analysis. Twin Res. Hum. Genet. 10, 423–433 (2007).
Bernabeu, E. et al. Sexual differences in genetic architecture in UK Biobank. Preprint at bioRxiv https://doi.org/10.1101/2020.07.20.211813v1 (2020).
Heath, A. C. et al. Education policy and the heritability of educational attainment. Nature 314, 734–736 (1985).
Browning, S. R. & Browning, B. L. Population structure can inflate SNP-based heritability estimates. Am. J. Hum. Genet. 89, 191–193; author reply 193–195 (2011).
Verbanck, M., Chen, C.-Y., Neale, B. & Do, R. Detection of widespread horizontal pleiotropy in causal relationships inferred from Mendelian randomization between complex traits and diseases. Nat. Genet. 50, 693–698 (2018).
Zhang, Y. et al. Local genetic correlation analysis reveals heterogeneous etiologic sharing of complex traits. Preprint at bioRxiv https://doi.org/10.1101/2020.05.08.084475v1 (2020).
Shi, H., Mancuso, N., Spendlove, S. & Pasaniuc, B. Local genetic correlation gives insights into the shared genetic architecture of complex traits. Am. J. Hum. Genet. 101, 737–751 (2017).
Werme, J., Sluis, Svander, Posthuma, D. & de Leeuw, C. A. LAVA: an integrated framework for local genetic correlation analysis. Preprint at bioRxiv https://doi.org/10.1101/2020.12.31.424652v1 (2021).
Jordan, D. M., Verbanck, M. & Do, R. HOPS: a quantitative score reveals pervasive horizontal pleiotropy in human genetic variation is driven by extreme polygenicity of human traits and diseases. Genome Biol. 20, 222 (2019).
Smith, G. D. & Ebrahim, S. ‘Mendelian randomization’: can genetic epidemiology contribute to understanding environmental determinants of disease? Int. J. Epidemiol. 32, 1–22 (2003).
Evans, D. M. & Smiths, G. D. Mendelian randomization: new applications in the coming age of hypothesis-free causality. Annu. Rev. Genomics Hum. Genet. 16, 327–350 (2015).
Wellcome Trust. Sharing Data from Large-scale Biological Research Projects: A System of Tripartite Responsibility Vol. 6 (Wellcome Trust, 2003).
COVID-19 Host Genetics Initiative. The COVID-19 Host Genetics Initiative, a global initiative to elucidate the role of host genetic factors in susceptibility and severity of the SARS-CoV-2 virus pandemic. Eur. J. Hum. Genet. 28, 715–718 (2020). This paper presents the recently established COVID-19 Host Genetics Initiative as a prime example of collaboration and team science, forming within a few months, rapidly aggregating data into a massive resource, rapidly crystallizing results and making it all freely available to academics.
Knoppers, B. M. Framework for responsible sharing of genomic and health-related data. HUGO J. 8, 3 (2014).
Peloquin, D., DiMaio, M., Bierer, B. & Barnes, M. Disruptive and avoidable: GDPR challenges to secondary research uses of data. Eur. J. Hum. Genet. 28, 697–705 (2020).
Staunton, C. et al. Protection of Personal Information Act 2013 and data protection for health research in South Africa. Int. Data Priv. Law 10, 160–179 (2020).
Molnár-Gábor, F. & Korbel, J. O. Genomic data sharing in Europe is stumbling — could a code of conduct prevent its fall? EMBO Mol. Med. 12, e11421 (2020).
Wilkinson, M. D. et al. The FAIR Guiding Principles for scientific data management and stewardship. Sci. Data 3, 160018 (2016).
Bezuidenhout, L. & Chakauya, E. Hidden concerns of sharing research data by low/middle-income country scientists. Glob. Bioeth. Probl. Bioet. 29, 39–54 (2018).
Bull, S. Review: Ensuring global equity in open research. Wellcome Trust https://doi.org/10.6084/M9.FIGSHARE.4055181.V1 (2016).
de Vries, J. et al. The H3Africa policy framework: negotiating fairness in genomics. Trends Genet. 31, 117–119 (2015).
Yakubu, A. et al. Model framework for governance of genomic research and biobanking in Africa — a content description. AAS Open Res. 1, 13 (2018).
O’Doherty, K. C. et al. Toward better governance of human genomic data. Nat. Genet. 53, 2–8 (2021).
Lyon, M. S. et al. The variant call format provides efficient and robust storage of GWAS summary statistics. Genome Biol. 22, 32 (2021).
Nosek, B. A., Ebersole, C. R., DeHaven, A. C. & Mellor, D. T. The preregistration revolution. Proc. Natl Acad. Sci. USA 115, 2600–2606 (2018).
Bosco, F. A., Aguinis, H., Field, J. G., Pierce, C. A. & Dalton, D. R. HARKing’s threat to organizational research: evidence from primary and meta-analytic sources. Pers. Psychol. 69, 709–750 (2016).
Kerr, N. L. HARKing: hypothesizing after the results are known. Personal. Soc. Psychol. Rev. 2, 196–217 (1998).
Colhoun, H. M., McKeigue, P. M. & Smith, G. D. Problems of reporting genetic associations with complex outcomes. Lancet 361, 865–872 (2003).
John, L. K., Loewenstein, G. & Prelec, D. Measuring the prevalence of questionable research practices with incentives for truth telling. Psychol. Sci. 23, 524–532 (2012).
Chambers, C. D., Feredoes, E., Muthukumaraswamy, S. D. & Etchells, P. J. Instead of ‘playing the game’ it is time to change the rules: Registered Reports at AIMS Neuroscience and beyond. AIMS Neurosci. 1, 4 (2014). This paper introduces the Registered Reports concept, a publishing format in which peer review occurs before data collection and analysis.
Song, F., Hooper & Loke, Y. Publication bias: what is it? How do we measure it? How do we avoid it? Open Access J. Clin. Trials https://doi.org/10.2147/OAJCT.S34419 (2013).
Syed, M. & Donnellan, M. B. Registered reports with developmental and secondary data: some brief observations and introduction to the special issue. Emerg. Adulthood 8, 255–258 (2020).
Van den Akker, O. et al. Preregistration of secondary data analysis: a template and tutorial. Preprint at PsyArXiv https://doi.org/10.31234/osf.io/hvfmr (2019).
Berg, J. J. et al. Reduced signal for polygenic adaptation of height in UK Biobank. eLife 8, e39725 (2019). This paper shows that the polygenic selection signal of height in European-ancestry individuals is strongly attenuated when using GWAS summary statistics generated from the UK Biobank rather than the largest GWAS meta-analysis (GIANT consortium).
Refoyo-Martínez, A. et al. How robust are cross-population signatures of polygenic adaptation in humans? Preprint at medRxiv https://doi.org/10.1101/2020.07.13.200030v2 (2020).
Sohail, M. et al. Polygenic adaptation on height is overestimated due to uncorrected stratification in genome-wide association studies. eLife 8, e39702 (2019).
Abdellaoui, A. et al. Genetic correlates of social stratification in Great Britain. Nat. Hum. Behav. 3, 1332–1342 (2019).
Haworth, S. et al. Apparent latent structure within the UK Biobank sample has implications for epidemiological analysis. Nat. Commun. 10, 333 (2019).
Selzam, S. et al. Comparing within- and between-family polygenic score prediction. Am. J. Hum. Genet. 105, 351–363 (2019).
Turchin, M. C. et al. Evidence of widespread selection on standing variation in Europe at height-associated SNPs. Nat. Genet. 44, 1015–1019 (2012).
O’Connor, L. J. et al. Extreme polygenicity of complex traits is explained by negative selection. Am. J. Hum. Genet. 105, 456–476 (2019).
Zeng, J. et al. Signatures of negative selection in the genetic architecture of human complex traits. Nat. Genet. 50, 746–753 (2018).
Boyle, E. A., Li, Y. I. & Pritchard, J. K. An expanded view of complex traits: from polygenic to omnigenic. Cell 169, 1177–1186 (2017).
Liu, X., Li, Y. I. & Pritchard, J. K. Trans effects on gene expression can drive omnigenic inheritance. Cell 177, 1022–1034.e6 (2019).
Flannick, J. et al. Exome sequencing of 20,791 cases of type 2 diabetes and 24,440 controls. Nature 570, 71–76 (2019).
Singh, T. et al. The contribution of rare variants to risk of schizophrenia in individuals with and without intellectual disability. Nat. Genet. 49, 1167–1173 (2017).
Luo, Y. et al. Exploring the genetic architecture of inflammatory bowel disease by whole-genome sequencing identifies association at ADCY7. Nat. Genet. 49, 186–192 (2017).
Tindana, P., Molyneux, S., Bull, S. & Parker, M. ‘It is an entrustment’: broad consent for genomic research and biobanks in sub-Saharan Africa. Dev. World Bioeth. 19, 9–17 (2019).
Fisher, C. B. & Layman, D. M. Genomics, big data, and broad consent: a new ethics frontier for prevention science. Prev. Sci. 19, 871–879 (2018).
Nembaware, V. et al. A framework for tiered informed consent for health genomic research in Africa. Nat. Genet. 51, 1566–1571 (2019).
Weiner, C. Anticipate and communicate: ethical management of incidental and secondary findings in the clinical, research, and direct-to-consumer contexts (December 2013 Report of the Presidential Commission for the Study of Bioethical Issues). Am. J. Epidemiol. 180, 562–564 (2014).
Eckstein, L., Garrett, J. R. & Berkman, B. E. A framework for analyzing the ethics of disclosing genetic research findings. J. Law Med. Ethics 42, 190–207 (2014).
Wonkam, A. & de Vries, J. Returning incidental findings in African genomics research. Nat. Genet. 52, 17–20 (2020).
McGuire, A. L. et al. The road ahead in genetics and genomics. Nat. Rev. Genet. 21, 581–596 (2020).
Popejoy, A. B. & Fullerton, S. M. Genomics is failing on diversity. Nature 538, 161–164 (2016).
Hudson, M. et al. Rights, interests and expectations: Indigenous perspectives on unrestricted access to genomic data. Nat. Rev. Genet. 21, 377–384 (2020).
Claw, K. G. et al. A framework for enhancing ethical genomic research with Indigenous communities. Nat. Commun. 9, 2957 (2018).
Mills, M. C. & Rahal, C. The GWAS Diversity Monitor tracks diversity by disease in real time. Nat. Genet. 52, 242–243 (2020).
Lautenbach, D. M., Christensen, K. D., Sparks, J. A. & Green, R. C. Communicating genetic risk information for common disorders in the era of genomic medicine. Annu. Rev. Genomics Hum. Genet. 14, 491–513 (2013).
Palk, A. C., Dalvie, S., de Vries, J., Martin, A. R. & Stein, D. J. Potential use of clinical polygenic risk scores in psychiatry — ethical implications and communicating high polygenic risk. Philos. Ethics Humanit. Med. 14, 4 (2019).
Regalado, A. Eugenics 2.0: we’re at the dawn of choosing embryos by health, height, and more. MIT Technology Review https://www.technologyreview.com/2017/11/01/105176/eugenics-20-were-at-the-dawn-of-choosing-embryos-by-health-height-and-more/ (2017).
Kong, C., Dunn, M. & Parker, M. Psychiatric genomics and mental health treatment: setting the ethical agenda. Am. J. Bioeth. 17, 3–12 (2017).
de Vries, J., Landouré, G. & Wonkam, A. Stigma in African genomics research: gendered blame, polygamy, ancestry and disease causal beliefs impact on the risk of harm. Soc. Sci. Med. 258, 113091 (2020).
Merriman, T. & Cameron, V. Risk-taking: behind the warrior gene story. N. Z. Med. J. 120, U2440 (2007).
Gronowski, A. M. & Budelier, M. M. The ethics of direct-to-consumer testing. Clin. Lab. Med. 40, 93–103 (2020).
Blell, M. & Hunter, M. A. Direct-to-consumer genetic testing’s red herring: ‘genetic ancestry’ and personalized medicine. Front. Med. 6, 48 (2019).
Rothstein, M. A. et al. Legal and ethical challenges of international direct-to-participant genomic research: conclusions and recommendations. J. Law Med. Ethics. 47, 705–731 (2019).
Manolio, T. A. et al. Finding the missing heritability of complex diseases. Nature 461, 747–753 (2009). This paper describes the concept of ‘missing heritability’, the observation that heritability estimates from GWAS are much lower than those from twin studies.
Young, A. I. Solving the missing heritability problem. PLoS Genet. 15, e1008222 (2019).
Cai, N. et al. Minimal phenotyping yields genome-wide association signals of low specificity for major depression. Nat. Genet. 52, 437–447 (2020).
Nagel, M., Watanabe, K., Stringer, S., Posthuma, D. & van der Sluis, S. Item-level analyses reveal genetic heterogeneity in neuroticism. Nat. Commun. 9, 1–10 (2018).
Plenge, R. M., Scolnick, E. M. & Altshuler, D. Validating therapeutic targets through human genetics. Nat. Rev. Drug Discov. 12, 581–594 (2013).
Cook, D. et al. Lessons learned from the fate of AstraZeneca’s drug pipeline: a five-dimensional framework. Nat. Rev. Drug Discov. 13, 419–431 (2014).
Okada, Y. et al. Genetics of rheumatoid arthritis contributes to biology and drug discovery. Nature 506, 376–381 (2014).
Peat, G. et al. The Open Targets post-GWAS analysis pipeline. Bioinforma. Oxf. Engl. 36, 2936–2937 (2020).
Sakaue, S. & Okada, Y. GREP: genome for REPositioning drugs. Bioinforma. Oxf. Engl. 35, 3821–3823 (2019).
Schork, N. J. Personalized medicine: time for one-person trials. Nature 520, 609–611 (2015).
Abraham, G., Qiu, Y. & Inouye, M. FlashPCA2: principal component analysis of Biobank-scale genotype datasets. Bioinformatics 33, 2776–2778 (2017).
Howie, B. N., Donnelly, P. & Marchini, J. A flexible and accurate genotype imputation method for the next generation of genome-wide association studies. PLoS Genet. 5, e1000529 (2009).
Howie, B., Marchini, J. & Stephens, M. Genotype imputation with thousands of genomes. G3 1, 457–470 (2011).
Browning, B. L., Zhou, Y. & Browning, S. R. A one-penny imputed genome from next-generation reference panels. Am. J. Hum. Genet. 103, 338–348 (2018).
Scott, L. J. et al. A genome-wide association study of type 2 diabetes in Finns detects multiple susceptibility variants. Science 316, 1341–1345 (2007).
Marchini, J., Howie, B., Myers, S., McVean, G. & Donnelly, P. A new multipoint method for genome-wide association studies by imputation of genotypes. Nat. Genet. 39, 906–913 (2007).
Loh, P.-R. et al. Efficient Bayesian mixed-model analysis increases association power in large cohorts. Nat. Genet. 47, 284–290 (2015).
Mägi, R. & Morris, A. P. GWAMA: software for genome-wide association meta-analysis. BMC Bioinforma. 11, 288 (2010).
Delaneau, O. et al. A complete tool set for molecular QTL discovery and analysis. Nat. Commun. 8, 15452 (2017).
Speed, D. & Balding, D. J. SumHer better estimates the SNP heritability of complex traits from summary statistics. Nat. Genet. 51, 277–284 (2019).
Grotzinger, A. D. et al. Genomic structural equation modelling provides insights into the multivariate genetic architecture of complex traits. Nat. Hum. Behav. 3, 513–525 (2019).
Burgess, S. et al. Using published data in Mendelian randomization: a blueprint for efficient identification of causal risk factors. Eur. J. Epidemiol. 30, 543–552 (2015).
Kanai, M. et al. Genetic analysis of quantitative traits in the Japanese population links cell types to complex human diseases. Nat. Genet. 50, 390–400 (2018).
Chen, Z. et al. China Kadoorie Biobank of 0.5 million people: survey methods, baseline characteristics and long-term follow-up. Int. J. Epidemiol. 40, 1652–1666 (2011).
Finer, S. et al. Cohort Profile: East London Genes & Health (ELGH), a community-based population genomics and health study in British Bangladeshi and British Pakistani people. Int. J. Epidemiol. 49, 20–21i (2020).
The H3Africa Consortium. Enabling the genomic revolution in Africa. Science 344, 1346–1348 (2014).
Giri, A. et al. Trans-ethnic association study of blood pressure determinants in over 750,000 individuals. Nat. Genet. 51, 51–62 (2019).
All of Us Research Program Investigators. The ‘All of Us’ Research Program. N. Engl. J. Med. 381, 668–676 (2019).
Canela-Xandri, O., Rawlik, K. & Tenesa, A. An atlas of genetic associations in UK Biobank. Nat. Genet. 50, 1593–1599 (2018).
Acknowledgements
D.P. is supported by Netherlands Organization for Scientific Research (NWO) grant VICI 435-14-005, the NWO Gravitation project BRAINSCAPES: A Roadmap from Neurogenetics to Neurobiology (024.004.012) and European Research Council advanced grant ERC-2018-ADG 834057. N.S.M. is supported by National Institutes of Health (NIH) grant U24HL135600. J.d.V. is supported by NIH grant U54HG009790 and Wellcome Trust grant 219600/Z/19/Z. Y.O. is supported by Japan Society for the Promotion of Science (JSPS) KAKENHI grants 19H01021 and 20K21834 and Japan Agency for Medical Research and Development (AMED) grants JP20km0405211, JP20ek0109413, JP20ek0410075, JP20gm4010006 and JP20km0405217. T.L. is supported by NIH grants R01GM122924, R01HL142028, 1R01AG057422, 1UM1HG008901 and R01MH106842. H.C.M. is supported by a Wellcome Trust core grant to the Sanger Institute (098051).
Author information
Authors and Affiliations
Contributions
Introduction (D.P. and E.U.); Experimentation (A.R.M. and H.C.M.); Results (D.P., Y.O. and T.L.); Applications (A.R.M.); Reproducibility and data deposition (D.P., E.U., J.d.V. and N.S.M.); Limitations and optimizations (D.P., E.U., J.d.V. and Q.Q.H.); Outlook (D.P., E.U., Q.Q.H., Y.O. and T.L.); Overview of the Primer (D.P.).
Corresponding author
Ethics declarations
Competing interests
T.L. is an adviser to Goldfinch Bio, Variant Bio and GSK, and has equity in Variant Bio. The other authors declare no competing interests.
Additional information
Peer review information
Nature Reviews Methods Primers thanks T. Edwards, J. Hostetler, D. Paltoo and the other, anonymous, reviewer(s) for their contribution to the peer review of this work.
Publisher’s note
Springer Nature remains neutral with regard to jurisdictional claims in published maps and institutional affiliations.
Related links
23andme: https://research.23andme.com/
ρ-HESS: https://huwenboshi.github.io/hess/
ANNOVAR: https://annovar.openbioinformatics.org/en/latest/
BEAGLE: http://faculty.washington.edu/browning/beagle/beagle.html
Bermuda principles: https://web.ornl.gov/sci/techresources/Human_Genome/research/bermuda.shtml
BGENIE: https://jmarchini.org/bgenie/
BOLT-LMM: https://alkesgroup.broadinstitute.org/BOLT-LMM/
BRAINSCAPES: https://brainscapes.nl
CAVIAR: http://zarlab.cs.ucla.edu/tag/caviar/
dbGAP: https://www.ncbi.nlm.nih.gov/gap/
DEPICT: https://data.broadinstitute.org/mpg/depict/
Ebola Data Platform: https://www.iddo.org/research-themes/ebola
fastGWA: https://cnsgenomics.com/software/gcta/#fastGWA
FINEMAP: http://www.christianbenner.com/
FinnGen results: https://www.finngen.fi/en/access_results
FlashPCA: https://github.com/gabraham/flashpca
FUMA: https://fuma.ctglab.nl/
FUSION: http://gusevlab.org/projects/fusion/
GCTA-COJO: https://cnsgenomics.com/software/gcta/#Overview
GCTA: https://cnsgenomics.com/software/gcta/#Overview
GEMMA: https://github.com/genetics-statistics/GEMMA
GeneAtlas: http://geneatlas.roslin.ed.ac.uk/
General Data Protection Regulation: https://gdpr-info.eu/
Genetic Investigation of Anthropometric Traits (GIANT) consortium: https://portals.broadinstitute.org/collaboration/giant
GenomicSEM: https://github.com/MichelNivard/GenomicSEM/
Genotype–Tissue Expression (GTEX) resource: https://gtexportal.org/home/
Global Alliance for Genomics and Health: https://www.ga4gh.org/
Global Lipids Genetics Consortium: http://lipidgenetics.org
GWAS Atlas: https://atlas.ctglab.nl/
GWAS Catalog: https://www.ebi.ac.uk/gwas/
GWAMA: https://genomics.ut.ee/en/tools/gwama
HIBAG: https://bioconductor.org/packages/release/bioc/html/HIBAG.html
HLA*IMP: https://bioinformaticshome.com/tools/imputation/descriptions/HLA-IMP.html
H3 Africa Consortium: https://h3africa.org/
IMPUTE2: http://mathgen.stats.ox.ac.uk/impute/impute_v2.html
International Common Disease Alliance: https://www.icda.bio
KIR*IMP: http://imp.science.unimelb.edu.au/kir/
LAVA: https://github.com/josefin-werme/lava
LDPred: https://github.com/bvilhjal/ldpred
LDPred-2: https://github.com/privefl/bigsnpr
LD-hub: http://ldsc.broadinstitute.org/
LDSC: https://github.com/bulik/ldsc
METAL: http://csg.sph.umich.edu/abecasis/Metal/
Locuszoom: http://locuszoom.org/
MACH: http://csg.sph.umich.edu/abecasis/mach/tour/imputation.html
MAGMA: https://ctg.cncr.nl/software/magma
Mendelian Randomization: https://cran.r-project.org/web/packages/MendelianRandomization/index.html
Michigan Imputation Server: https://imputationserver.sph.umich.edu/index.html#!
Minimac: https://genome.sph.umich.edu/wiki/Minimac
OpenGWAS database: https://gwas.mrcieu.ac.uk/
Open Science Framework: https://osf.io/
Open Science Framework Registered Reports resource: https://osf.io/rr/
PAINTOR: https://github.com/gkichaev/PAINTOR_V3.0
Pan UKBB: https://pan.ukbb.broadinstitute.org/
Pheweb.jp: https://pheweb.jp/
PLINK: http://zzz.bwh.harvard.edu/plink
PLINK2: https://www.cog-genomics.org/plink/2.0/
Polygenic Score Catalogue: https://www.pgscatalog.org
PRSice: https://www.prsice.info/
PrediXcan: https://github.com/gamazonlab/PrediXcan
PRScs: https://github.com/getian107/PRScs
Psychiatric Genomics Consortium: https://www.med.unc.edu/pgc
QTLTools: https://qtltools.github.io/qtltools/
REGENIE: https://rgcgithub.github.io/regenie/
RICOPILI: https://sites.google.com/a/broadinstitute.org/ricopili/
SAIGE: https://github.com/weizhouUMICH/SAIGE
SBayesR: https://cnsgenomics.com/software/gctb/#Overview
SMARTPCA: https://github.com/chrchang/eigensoft/wiki/smartpca
SMR: https://cnsgenomics.com/software/smr/#Overview
SNP2HLA: http://software.broadinstitute.org/mpg/snp2hla/
SNPTEST: https://mathgen.stats.ox.ac.uk/genetics_software/snptest/snptest.html#introduction
SumHer: http://dougspeed.com/sumher/
superGNOVA: https://github.com/qlu-lab/SUPERGNOVA
SuSIE: https://github.com/stephenslab/susieR
Templates for data privacy documents: https://www.jyu.fi/en/university/data-privacy/data-privacy-templates#autotoc-item-autotoc-1
TOPMed Imputation Server: https://imputation.biodatacatalyst.nhlbi.nih.gov/#!
Supplementary information
Glossary
- Polygenic risk scores
-
(PRSs). Scores that provide an indication of an individual’s genetic liability to a trait or disease, calculated using an individual’s genome, weighted by effect sizes obtained from genome-wide association studies (GWAS).
- Linkage disequilibrium
-
The non-independent association of two alleles in a population.
- Collider bias
-
A bias that occurs when two variables (A and B) both influence a third variable (C), and the third variable is used to condition on. This can induce spurious correlations between variables A and B.
- Hardy–Weinberg equilibrium
-
If the frequency of observed genotypes of a variant in a population can be derived from the observed allele frequencies, the genetic variant is said to be in Hardy–Weinberg equilibrium. A test for Hardy–Weinberg equilibrium is often used in quality control of genome-wide association studies (GWAS) to filter out variants with possible genotype calling errors.
- Phasing
-
The process of estimating whether genotyped alleles derive from the maternal or paternal allele.
- Population stratification
-
The presence of multiple genetically distinct subpopulations that differ in their mean phenotypic values. When not accounted for, this can lead to spurious genetic associations.
- Random effect term
-
Random effects are effects that have so many levels (including more than the number of observations) that they are not individually estimable. By assigning these effects as random it is assumed that they are drawn from a population with a known variance and covariance structure. The effect for an individual can be predicted given the data and the distributional assumptions.
- Logit link function
-
A function for converting a linear combination of covariate values into probabilities.
- Bonferroni testing threshold
-
A correction for multiple testing that is typically applied by dividing the significance threshold by the number of independent tests that are carried out.
- Winner’s curse
-
The phenomenon that the effect sizes of newly discovered alleles tend to be overestimated.
- Odds ratio
-
An effect size estimate of a risk factor that quantifies the increased odds of having the disease per risk allele count in genome-wide association studies (GWAS) or one standard deviation increase of the polygenic risk score (PRS).
- Summary statistics
-
The primary outcome of genome-wide association studies (GWAS), including a list of all tested single-nucleotide polymorphisms (SNPs) and effect sizes. The minimum required information is SNP IDs, SNP locations and genomic build, alleles, strand, effect size and standard error, P value, test statistic, minor allele frequency and sample size.
- Rare variant burden testing
-
A statistical technique in which the number of rare alleles per gene is used to determine genetic association with a trait.
- Transmission disequilibrium test
-
A family-based genetic association test in which alleles transmitted to affected offspring are contrasted with alleles not transmitted.
- Gene flow
-
The transfer of genetic material between populations.
- Genetic bottlenecks
-
Reductions in effective population size, for example, due to a migration followed by geographical isolation, or due to cultural endogamy, which leads to a reduction in diversity.
- Conditional association analysis
-
A genetic association analysis that includes fixed effects of genetic variants.
- Prior probability distribution
-
A term used in Bayesian statistics to describe the probability distribution of an unknown quantity based on beliefs an investigator has about the model parameters.
- Posterior probability distribution
-
A term used in Bayesian statistics to describe the probability distribution of an unknown quantity based on observed data.
- Expression quantitative trait loci
-
(eQTLs). Dosage effects of genetic variants on gene expression profiles, including expression levels and mRNA splicing patterns.
- Pseudo-R 2
-
A statistical measure that indicates how well a model fits the data for binary traits and that can be used to compare models.
- Liability scale
-
The assumed underlying normal distribution of dichotomous traits.
- Net reclassification index
-
A metric that measures how much a new model improves in terms of reclassification. It is calculated as the proportion of individuals who are correctly reclassified minus the proportion of individuals who are incorrectly reclassified.
- Identity by descent
-
The property of two identical segments of DNA having been inherited from a common ancestor without recombination.
Rights and permissions
About this article

Cite this article
Uffelmann, E., Huang, Q.Q., Munung, N.S. et al. Genome-wide association studies. Nat Rev Methods Primers 1, 59 (2021). https://doi.org/10.1038/s43586-021-00056-9
Accepted:
Published:
DOI: https://doi.org/10.1038/s43586-021-00056-9
This article is cited by
-
Polygenic risk score model for renal cell carcinoma in the Korean population and relationship with lifestyle-associated factors
BMC Genomics (2024)
-
GWABLUP: genome-wide association assisted best linear unbiased prediction of genetic values
Genetics Selection Evolution (2024)
-
AStruct: detection of allele-specific RNA secondary structure in structuromic probing data
BMC Bioinformatics (2024)
-
Protein–protein interaction network-based integration of GWAS and functional data for blood pressure regulation analysis
Human Genomics (2024)
-
Genetic analysis of scab disease resistance in common bean (Phaseolus vulgaris) varieties using GWAS and functional genomics approaches
CABI Agriculture and Bioscience (2024)
