
ABSTRACT
The Microvariablity and Oscillations of Stars (MOST) mission is a low‐cost microsatellite designed to detect low‐degree acoustic oscillations (periods of minutes) with micromagnitude precision in solar‐type stars and metal‐poor subdwarfs. There are also plans to detect light reflected from giant, short‐period, extrasolar planets and the oscillations of roAp stars and the turbulent variability in the dense winds of Wolf‐Rayet stars. This paper describes the experiment and how we met the challenge of ultraprecise photometry despite severe constraints on the mass, volume, and power available for the instrument. A side‐viewing, 150 mm aperture Rumak‐Maksutov telescope feeds two frame‐transfer CCDs, one for tracking and the other for science. There is a single 300 nm wide filter centered at 525 nm. Microlenses project Fabry images of the brighter (V≤10) target stars onto the science CCD. Fainter target stars will be focused directly elsewhere on the CCD. MOST was launched on 2003 June 30 into a low‐Earth, Sun‐synchronous, polar orbit allowing stars between −19° and +36° declination to be viewed continuously for up to 60 days. Attitude is controlled by reaction wheels and magnetotorquers. A solar safety shutter over the telescope diagonal is the only other moving part. Accumulated photometry will be used to calibrate response across the target field stop, and data will be compressed and downloaded to three dedicated ground stations.
Export citation and abstract BibTeX RIS
1. INTRODUCTION
Until recently, performing optical astronomy experiments from a microsatellite (mass ≤100 kg) was considered unfeasible because of the poor pointing possible from a platform with such small inertia (approximately ±2°). In 1997, anticipating new microsatellite attitude control technology, three of the authors (Carroll, Matthews, Rucinski) with A. F. J. Moffat and D. Sasselov first proposed a project to the Canadian Space Agency (CSA) to obtain astronomical photometry of unprecedented precision from a microsatellite. In the next year, the Microvariablity and Oscillations of Stars (MOST) mission was selected to be Canada's first science microsatellite, as part of the CSA Small Payloads Program. Additional funding was provided by the Ontario Research and Development Challenge Fund, the Natural Sciences and Engineering Research Council (NSERC), the Ontario Centre for Research in Earth and Space Technology, and the Universities of Toronto, British Columbia, and Vienna.
The primary goal of MOST was the photometric detection of the Eigen spectra of low‐degree acoustic oscillations of bright solar‐type and Ap stars. The oscillation frequencies and their separations act as probes of interior structure and composition (see review by Christensen‐Dalsgaard 2002).
Solar‐type stars have natural oscillation periods of about 5 minutes, with individual modes remaining coherent for weeks at a time, but the oscillation amplitudes are so small that they change the star's integrated brightness only by parts in a million. Unlike the Sun, we cannot resolve stellar surfaces, so we expect to detect changes in brightness corresponding only to the lowest degree modes because higher degree modes increasingly self‐cancel. These modes produce a short comb of frequencies separated by the inverse of the roughly 2 hr sound takes to cross the star. The comb is accompanied by a second‐order splitting caused by the gradient of sound speed in the stellar core, which is an order‐of‐magnitude smaller difference in frequency than that due to the sound‐crossing time. The size of the second‐order splitting (∼6 μHz) is sensitive to the composition of the thermonuclear core, which in turn depends on the age of the star. To determine both the primary and secondary splitting unambiguously at a resolution ∼μHz requires uninterrupted observations of the star for weeks at a time with a precision of micromagnitudes. This is quite impossible from the ground because of interruptions by weather, incomplete global coverage, and ultimately, the limiting noise level set by atmospheric scintillation. A small, dedicated telescope in orbit with a suitable continuous viewing zone, on the other hand, is ideal for such a program.
The MOST target list also includes stars with giant planets in orbits of a few days. Our calculations (Green et al. 2003) suggest that the reflection phases of these planets will be detectable at the micromagnitude level with cycle times of days. For the pulsating magnetic roAp stars in the target list, the Eigen spectrum will contain information about internal field strength and field geometry. The power spectrum of photometric variations of Wolf‐Rayet (WR) stars is sensitive to the turbulent mechanism(s) governing their dense, high‐speed winds. If WR stars pulsate, their periods are expected to be around 10 minutes, and the pulsations may be partly responsible for the massive winds that they generate. Stars too faint to be observed in the Fabry mode will be directly imaged elsewhere on the science CCD; details of both techniques are given in § 6.
In this paper, we describe the basic MOST science experiment. An early summary of the experiment and its science goals was provided by Matthews (1998). Technical details of the satellite and its control have appeared elsewhere (Zee & Stibrany 2002; Zee, Grocott, & Matthews 2003; Rucinski et al. 2003), and the results of detailed simulations, theoretical studies, and the target list will appear in separate papers.
2. BASIC DESIGN
Despite its broad science objectives, the MOST experimental design is driven by the stringent requirements of the search for solar‐type oscillations, viz., micromagnitude precision for the stellar power spectrum in the 2000–4000 μHz range for stars between V = 0.4 and 5.5 (Procyon, V = 0.4, is the brightest program star). Individual exposure times must be less than 1 minute for proper sampling.
The two photographs in Figure 1 show opposite sides of the MOST satellite. On one face are the entrance aperture for the instrument (covered by a motorized shutter), the cooling surface of the passive radiator system, the area for attachment to the rocket, and supplemental solar panels for power when the spacecraft tumbles following release from the rocket. The opposite side is dominated by solar panels that face the Sun during routine observations and provide primary power. There are also Sun sensors for attitude control information. The entire satellite has a mass of 54 kg (with the instrument being 14 kg) and occupies a 65 × 65 × 30 cm volume. The solar panels will provide a nominal power supply of 30 W, of which only 10 W are available to the instrument. The satellite is stabilized by three sets of reaction wheels and magnetotorquers, which give a pointing accuracy hundreds of times better than previous microsatellites.
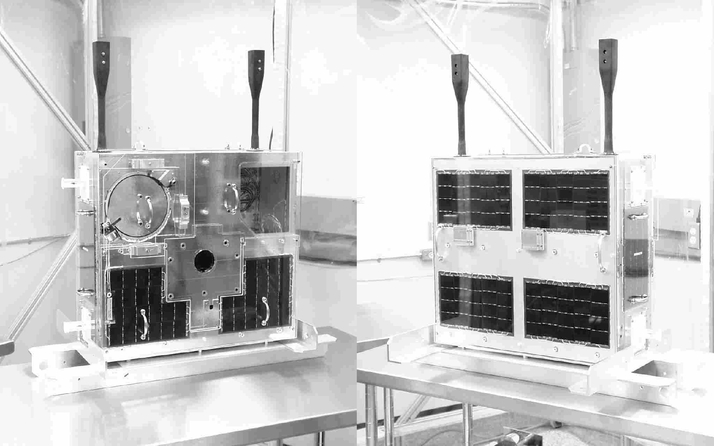
Fig. 1.— Two photographs of the MOST satellite nearing completion at UTIAS. Left panel: Circular aperture for the telescope diagonal (with cover closed), the square opening for the radiant cooling surface, and the area in the center for attachment to the rocket. Right panel: Solar panels covering the opposite side. The two black booms hold the magnetometer sensors sufficiently far from the ferromagnetic Invar of the telescope structure. The satellite is surrounded by a Plexiglas box with carrying handles while in the lab.
Although the brightness fluctuations caused by low‐degree oscillations are expected to be twice as large in the red as in the blue, the large photon gain of a filter bandpass covering the whole visible spectrum leads to higher photometric precision while minimizing the size of the telescope and more than offsets the small reduction in the measured amplitude of variability.
The optical layout we adopted is shown in Figure 2. The telescope is a 150 mm aperture Rumak‐Maksutov fed by a 45° diagonal (periscope) mirror. This arrangement fully illuminates the solar cells on the opposite side while completely shielding the telescope from the Sun, lets the experimental package conform to the available space, and continually exposes the radiant cooler to the dark sky. The telescope focuses light on the photometric and guidance CCDs at the external Cassegrain focus. The scattered‐light problem normally associated with support spiders is eliminated because the secondary is attached to the underside of the meniscus corrector. The 2  56 diameter field allows both science and guidance fields to be fed directly, and the baffle design reduces the effect of scattered light from Earthshine and other bright, off‐axis sources to only a few photoelectrons per exposure.
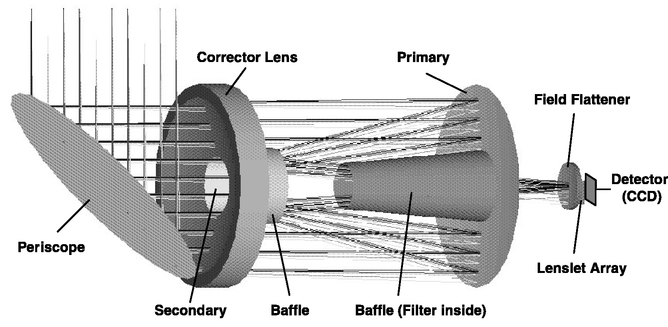
Fig. 2.— Optical layout of the telescope. See text for details.
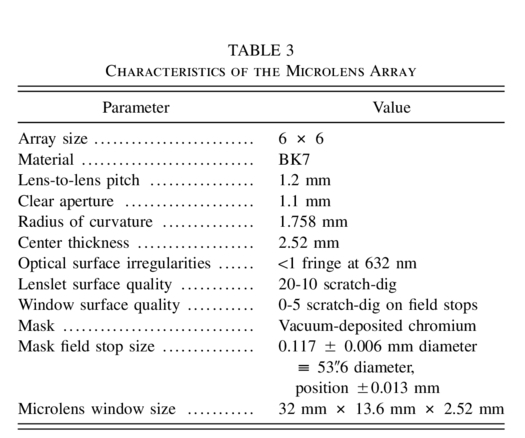
To realize the necessary photometric precision, an array of 6 × 6 microlenses is introduced just in front of the science detector as shown in Figure 3. Each microlens focuses an image of the target star into a 54'' diameter field stop and a 44 pixel diameter image (the Fabry image) of the telescope entrance pupil on the science CCD. This technique was first described by Fabry (1927) and is named for him. The Fabry images greatly increase photoelectron storage per exposure (∼1400 pixels), minimize the impact of CCD pixel‐to‐pixel response variations, eliminate the problem of subpixel sensitivity, and eliminate image wander caused by tracking jitter. There remains a photometric sensitivity to position of the target star in the Fabry lens field stop. Calibration of this sensitivity is discussed in § 6.2.
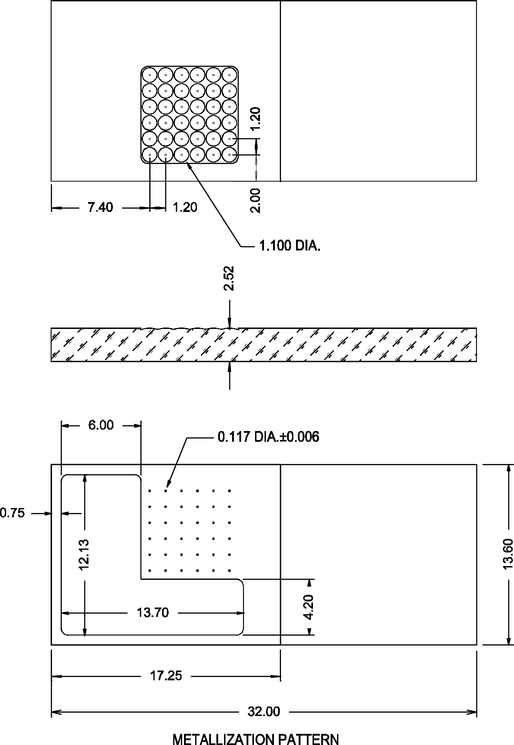
Fig. 3.— Microlens window showing the position of the 6 × 6 array of microlenses etched on its surface. The lower surface of the window is partially metallized with chromium. The metallization pattern is best seen in the lowest figure. The L‐shaped 12.13 × 13.70 portion is clear, as is the right‐hand portion of the window, which covers the guidance CCD. The rest of the area is metallized and perforated with field stop apertures of 54'' diameter centered on each microlens. More details are given in Table 3.
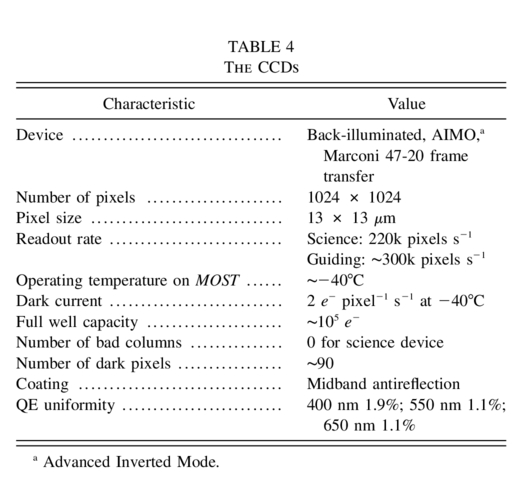
The CCDs are Marconi 47‐20 frame‐transfer devices (1024 × 1024 pixels) that, at the end of each exposure, quickly transfer the accumulated charge pattern to an identical, masked CCD area for readout. This rapid transfer eliminates the need for a mechanical shutter. These CCDs were chosen, in part, because of proven reliability in the energetic particle environment of space. Their characteristics are given in Table 4, and those of the CCD control system are discussed in more detail in § 4.1. The CCDs are thinned, and so they are immune to the microstructure of the sensitivity within each pixel that is present in thick devices.
There is a safety shutter in front of the telescope diagonal to block the optics in a few seconds whenever there is a risk of looking directly at the Sun because the CCDs would rapidly melt if the telescope ever did.
3. THE OPTICS
3.1. The Telescope
The telescope (designed by Pazder) is an f/6 Rumak‐Maksutov with the addition of a field flattener close to the focal plane. The aperture stop, located at the corrector, is 150 mm diameter, and the primary mirror is 173 mm in diameter. The field of view has a radius of 1 28 with good image quality over a radius of 1° and an unvignetted field of radius 0 4. The unvignetted 0 4 is for science and contains most of the microlenses. The field from 0 4 to 1 28 radius is for tracking.
The design was optimized for low field distortion (<0.1%) and low lateral color to minimize astrometric guiding errors. A defocus of +0.15 mm (increase in focal length) enlarges star images to between 2 and 3 pixels FWHM in the field between 0 4 and 1° to allow proper point‐spread function (PSF) sampling for guiding. The telescope body is constructed of Invar, and the primary and secondary mirrors and corrector are made from fused silica. These materials allow athermal performance without active focusing so that they maintain their preset focus in orbit within the temperature range −40°C to +20°C. The field corrector and CCD window are Schott BK7 glass. The UV absorption in the BK7 is important to absorb UV radiation from cosmic‐ray Cerenkov flashes in the silica meniscus.
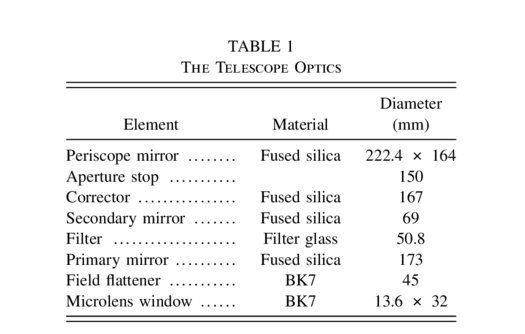
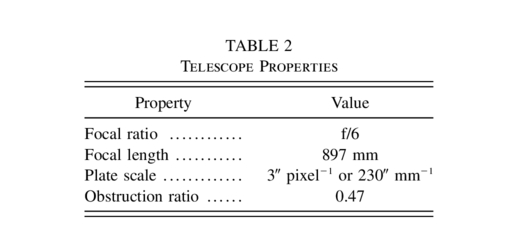
Some basic telescope properties are listed in Tables 1 and 2. The transmitting elements have ultrabroadband high transmission coatings (see Fig. 4). The primary and secondary aluminum reflectivity is also broadband enhanced.
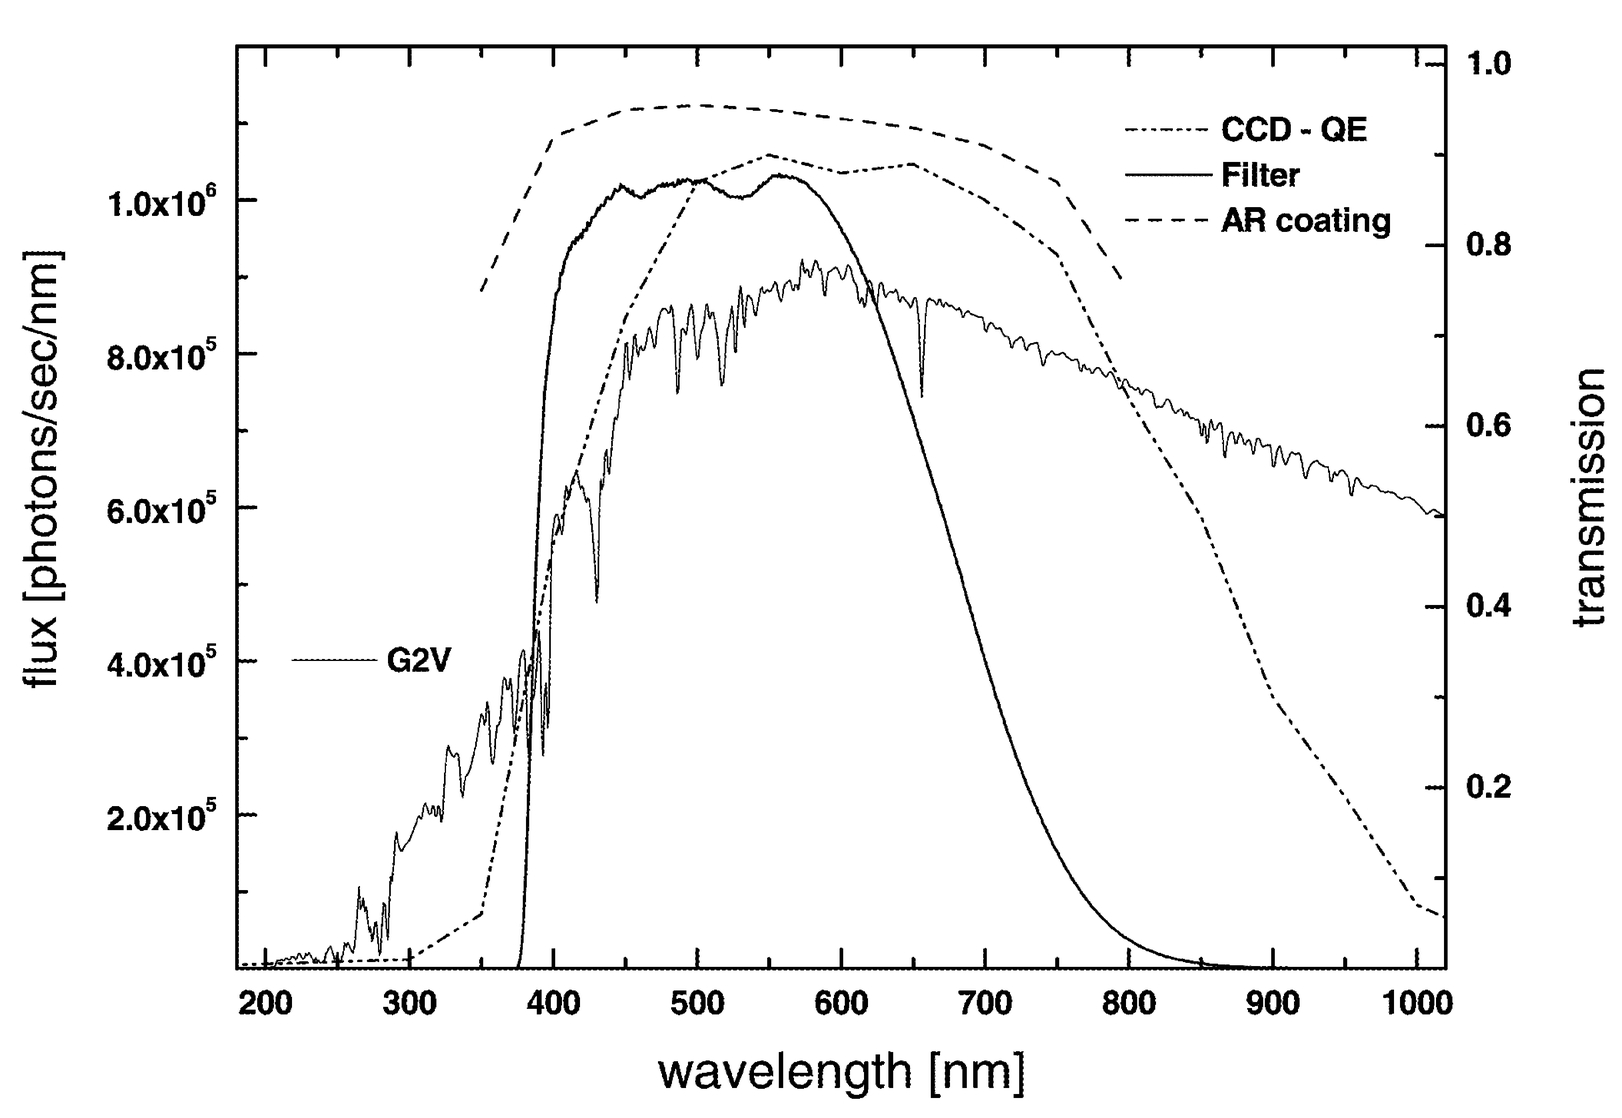
Fig. 4.— Transmission of the compound filter in MOST (solid line). The solar spectrum shows the stronger absorption features and relative spectral energy distribution for most of our prime targets. The dashed line is for the high‐transmission coating. The measured CCD response is given by the dash‐dotted line.
 |
 |
3.1.1. Stray Light
Stray light reaching the focal plane from out of field sources must be reduced by a factor of 10−5 to attenuate Earthshine and light from other bright objects. The stray light was analyzed with the Advanced Systems Analysis Program (ASAP)1 version 6.0. The stop was placed at the corrector to reduce illumination of the interior surfaces of the telescope. The secondary baffle was tapered outward to reduce the visibility of the outside of the secondary baffle from the detector. The sizes of the secondary and primary baffles were estimated by the technique of Moore & Valente (1989), suitably modified for a Maksutov. A glare stop was put at the field flattener to block critical rays from passing between the secondary and primary baffles. All interior surfaces were coated with low out‐gassing black paint.
3.2. The Fabry Microlenses
The microlenses were etched on a 2.5 mm thick BK7 window (by Advanced MicroOptic Systems, Saarbrucken, Germany) as shown in Figure 3. This also acts as the window for the CCD. The lower figure shows the vacuum‐deposited chromium metallization pattern deposited on the underside of the window. The L‐shaped 12.13 × 13.70 mm portion is clear, with a 6 × 6 array of 0.117 mm diameter field stops perforating the metallized portion and a field stop centered on each microlens. The microlenses were designed to produce real images at their field stops and pupil images on the science CCD. The field stop size was chosen to accommodate the expected image wander due to attitude control jitter. The characteristics of the Fabry lenses are given in Table 3.
 |
When the prototype microlens array was tested, a nonuniformity appeared in the Fabry images in the form of a small‐intensity "bump" some 10% higher than the average signal and about 1/10 the diameter of the Fabry image. The problem was traced to an etching defect. The sag of the microlens over the central 10% zone was 1/2 wave less than the design value. This "flat top" introduced a phase disturbance of 1/2 of a wave over the central zone. Unfortunately, the distance between this phase disturbance and the Fabry image combined with the size of the artifact were such that the phase disturbance propagated into an amplitude disturbance at the Fabry image. The microlens vendor corrected the problem by increasing the number of mask steps in the central zone.
Similar problems may occur in Shack‐Hartman wave‐front sensing systems when a pupil image is projected onto a microlens array. The standard Rayleigh criteria for optics do not apply to systems such as this where a far‐field image is required.
3.3. The Filter
The position of the filter within the telescope is indicated in Figure 2. It is inclined to the optical axis to avoid ghost images from internal reflections appearing within the field stop of the target Fabry lens. As pointed out above, there was no particular scientific advantage in having a narrowband filter, since the amplitude of photometric variation from solar‐type oscillations is expected to be within a factor of 2 between the blue and red spectral regions. On the other hand, there was considerable photon gain in having as wide a bandpass as possible for both time resolution and sensitivity.
Given the long‐term micromagnitude sensitivity requirement, we decided not to define the bandpass by the fickle limits of the CCD quantum efficiency (QE), since these depend critically on detector temperature. The all‐silica transmission optics are designed to give good images at wavelengths longer than 380 nm. The CCD quantum efficiency is also ∼30% at this wavelength. In consequence, 380 nm was chosen as the short‐wavelength cutoff.
For photon energies less than the CCD band‐gap energy (corresponding to ∼670 nm), the CCD becomes increasingly transparent, leading to the generation of fringes in monochromatic light that increase in amplitude with increasing wavelength, particularly for thinned devices such as those in MOST. In wideband white‐light observations, fringes from neighboring wavelengths largely cancel each other out, but at the level of precision needed from MOST, this assumption may be inadequate. The spectra of solar‐type stars are not continuous but strongly modulated by absorption features (see Fig. 4); in consequence, fringes from contiguous wavelengths do not completely cancel. The projected velocity of the satellite toward a target star changes continually around the satellite's orbit, thereby shifting the apparent wavelengths of the stellar features and their related fringe patterns in the Fabry image. Further, different positions of the star in the Fabry field stop correspond to small changes in incidence at the CCD, again changing the fringe pattern. The fringe pattern also changes with CCD temperature and other variables. While these effects are small, they are difficult if not impossible to quantify or calibrate. For this reason, we introduced a long‐wavelength cutoff starting at 600 nm with 50% transmission near 700 nm. Since there are no fringes in the blue, the strong Ca ii H and K lines near 390 nm do not present a similar problem.
The filter is a sandwich of GG 400 and KG 5 filters that define the short and long cutoff wavelengths, respectively. The transmittance is shown in Figure 4 together with a solar spectrum, the CCD response, and the optics coating transmittance.
4. THE ELECTRONIC SYSTEMS
4.1. The CCD Camera
The layout of the CCDs is shown in Figure 5, and a block diagram of the science CCD control is shown in Figure 6. The characteristics of the science CCD are given in Table 4. The 47‐20 CCDs are in customized mounts supplied by Marconi that allow them to butt together. The CCDs are thermally contacted to Invar plates linked directly to the radiator on the same side of the spacecraft as the telescope opening. The Invar plates are simultaneously heated by a resistor to ∼5°C above the ambient (expected to be −40°C) delivered by radiant cooling; this arrangement allows the CCD temperature to be maintained to ±0.1°C. The heater voltage is varied as part of a temperature control loop. The temperature is sensed at a resolution of 0.02°C and sampled every 100 s. During commissioning, the control loops will be adjusted to avoid periodic temperature variations, particularly in the frequency range of scientific interest.
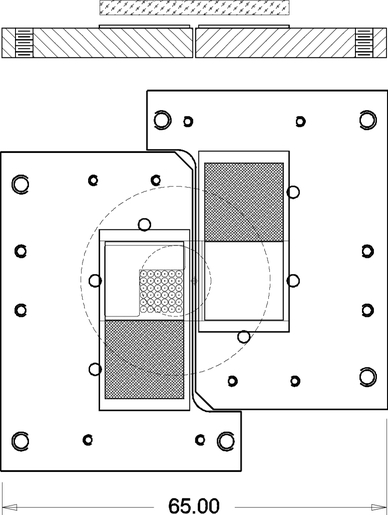
Fig. 5.— Dual CCD focal plane layout. The CCDs are bonded to Invar plates through which they are cooled, and the microlens window (Fig. 3) lies just above them. The hatching corresponds to the masked areas to which charge images are rapidly transferred at the end of an exposure for readout. The inner dashed circle is the 0 4 radius unvignetted field.
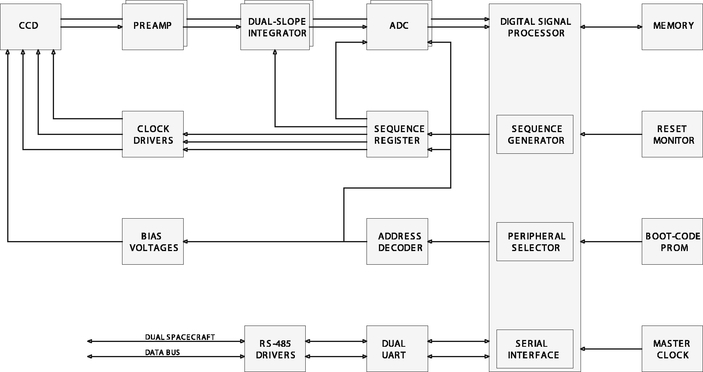
Fig. 6.— Block diagram of the CCD camera controller operation. Details are given in the text.
 |
Careful estimates were made by one of us (Skaret 2001) of the expected MOST radiation environment with Space Radiation 4.0,2 and they indicated a significant but not serious degradation of CCD performance (dark current increase, hot pixels, reduced charge transfer efficiency, etc.) during the first year in orbit. Most degradation is inflicted by passage through the high radiation concentrations of the South Atlantic Anomaly (SAA). A 5 mm thickness of aluminum shielding largely prevents any degradation except by the most energetic particles. In fact, the Invar in the telescope structure provides some 8 mm of shielding. Excessive shielding would induce a flux of secondaries more damaging than the primaries.
The science and tracking CCDs are operated independently by two nearly identical radiation‐tolerant controllers that differ only in their software. The science controller is optimized for low‐noise images, with on‐board data processing and data compression. The tracking CCD provides an image every second and a list of lit pixels from the guide stars in the field from on‐the‐fly data thresholding.
The CCD controller design is based on a programmable digital signal processor (DSP) with low‐power clock drivers and simple signal processing. Where possible, radiation‐tolerant parts and circuit designs are used. The clock drivers, bias voltages, and signal‐processing circuits are built from simple and reliable op‐amp and analog switch components, some of which have been used in previous designs (Burley, Walker, & Johnson 1998). A separate paper detailing the hardware and software design is in preparation.
Particular features include low‐power CMOS‐like clock drivers, preamp and signal processing optimized for fast settling times (less than 100 ns) to maximize pixel readout rate, and dual signal processing channels with 14 bit analog‐to‐digital converters. A temperature‐controlled, ovenized crystal oscillator assures the very high timing stability (<0.5 ppm) necessary for the photometry.
Many of the digital logic functions are concentrated in the DSP and a programmable logic device. Engineering CCDs and components of the control electronics were exposed to 12 krad of energetic protons at the TRIUMF accelerator facility without failure. This is equivalent to more than 10 years in the MOST orbit under expected levels of solar activity. The DSP program code is kept in error‐correcting memory to protect against any radiation‐induced upset, at the cost of extra wait states. Instructions run from the internal, full‐speed DSP memory are "at risk" for radiation hits. In the event of an upset, the DSP can reload its code over the data link or from on‐board flash memory.
In operation, the CCD system is controlled by commands and program code sent over the data link. The DSP generates the clocking signals to control the serial and parallel charge transfers on the CCD and controls the signal processing to extract the digitized data on a pixel‐by‐pixel basis. Basic sequence patterns (serial shift, parallel shift, read pixel, flush pixel) are combined to read out the array. With the appropriate sequences, the CCD can be read out through one or both output amplifiers.
The DSP provides software control of image size, subrasters, binning, clock voltages, and exposure time. The start time of each exposure is recorded to a fraction of a millisecond and the length of each exposure to better than a microsecond.
4.2. Telemetry
The MOST mission is designed to succeed with only a single ground station, but in fact there will be three dedicated S‐band ground stations at (1) University of Toronto Institute for Aerospace Studies, Toronto, Ontario; (2) University of British Columbia; and (3) University of Vienna. Contact time will be about 50 minutes per day. An individual ground station pass will last about 10 minutes.
On‐board data processing is essential because of the scientific goal of at least one image per minute. A full CCD frame binned 2 × 2 is roughly 512 kbytes uncompressed, but the downlink bandwidth is only 38,400 bps. In addition, several days of data must be stored on a 1.5 Mbyte RAM disk in case contact is lost. Consequently, each exposure must be reduced to just a few kilobytes.
There is a strong scientific incentive to download as much of the available data as possible. For each exposure, the data is processed into two science data streams (SDSs), I and II. SDS‐I contains only data vital for the scientific goals, while SDS‐II includes intensities from individual pixels. SDS‐II is nearly an order of magnitude larger than SDS‐I. Normally, only SDS‐II is sent to the ground. In the event of a prolonged communication failure, the SDS‐I streams are stored aboard the satellite at the expense of the SDS‐II streams.
To limit the size of SDS‐I and SDS‐II, only those areas of the CCD image of interest are processed and downloaded. These areas are the target Fabry image and certain neighboring Fabry images (sky) together with areas to establish dark and bias levels. Images of certain stars that fall on the open region of the CCD will also be downloaded. These restrictions reduce the data to a few percent of a whole frame. Data compression and compaction techniques allow us to reduce SDS‐II even further. This work will be detailed in a separate paper.
Figure 7 shows a projection of the MOST science and guiding fields on a region of sky containing the star 51 Peg. The two CCDs are shown as large squares, and the mosaic of Fabry lenses is shown for the science CCD, with the small central circle being the field stop for each lens. The field has been rotated to not only place 51 Peg in the field stop of a Fabry lens but also place a second bright star in the field stop of a second lens. The two target stars are symbolized by the largest filled squares. All other stars are shown as open circles whose diameter is proportional to their brightness, except for certain stars in the guide field and in the direct focus portion of the science CCD, where several are identified by filled squares. In the guide field, the latter are the designated guide stars. In the science direct‐focus field, they are stars to be monitored serendipitously in tandem with the two stars for Fabry photometry. To avoid saturation, the serendipitous stars must be at least 5 mag fainter than the prime "Fabry" targets.
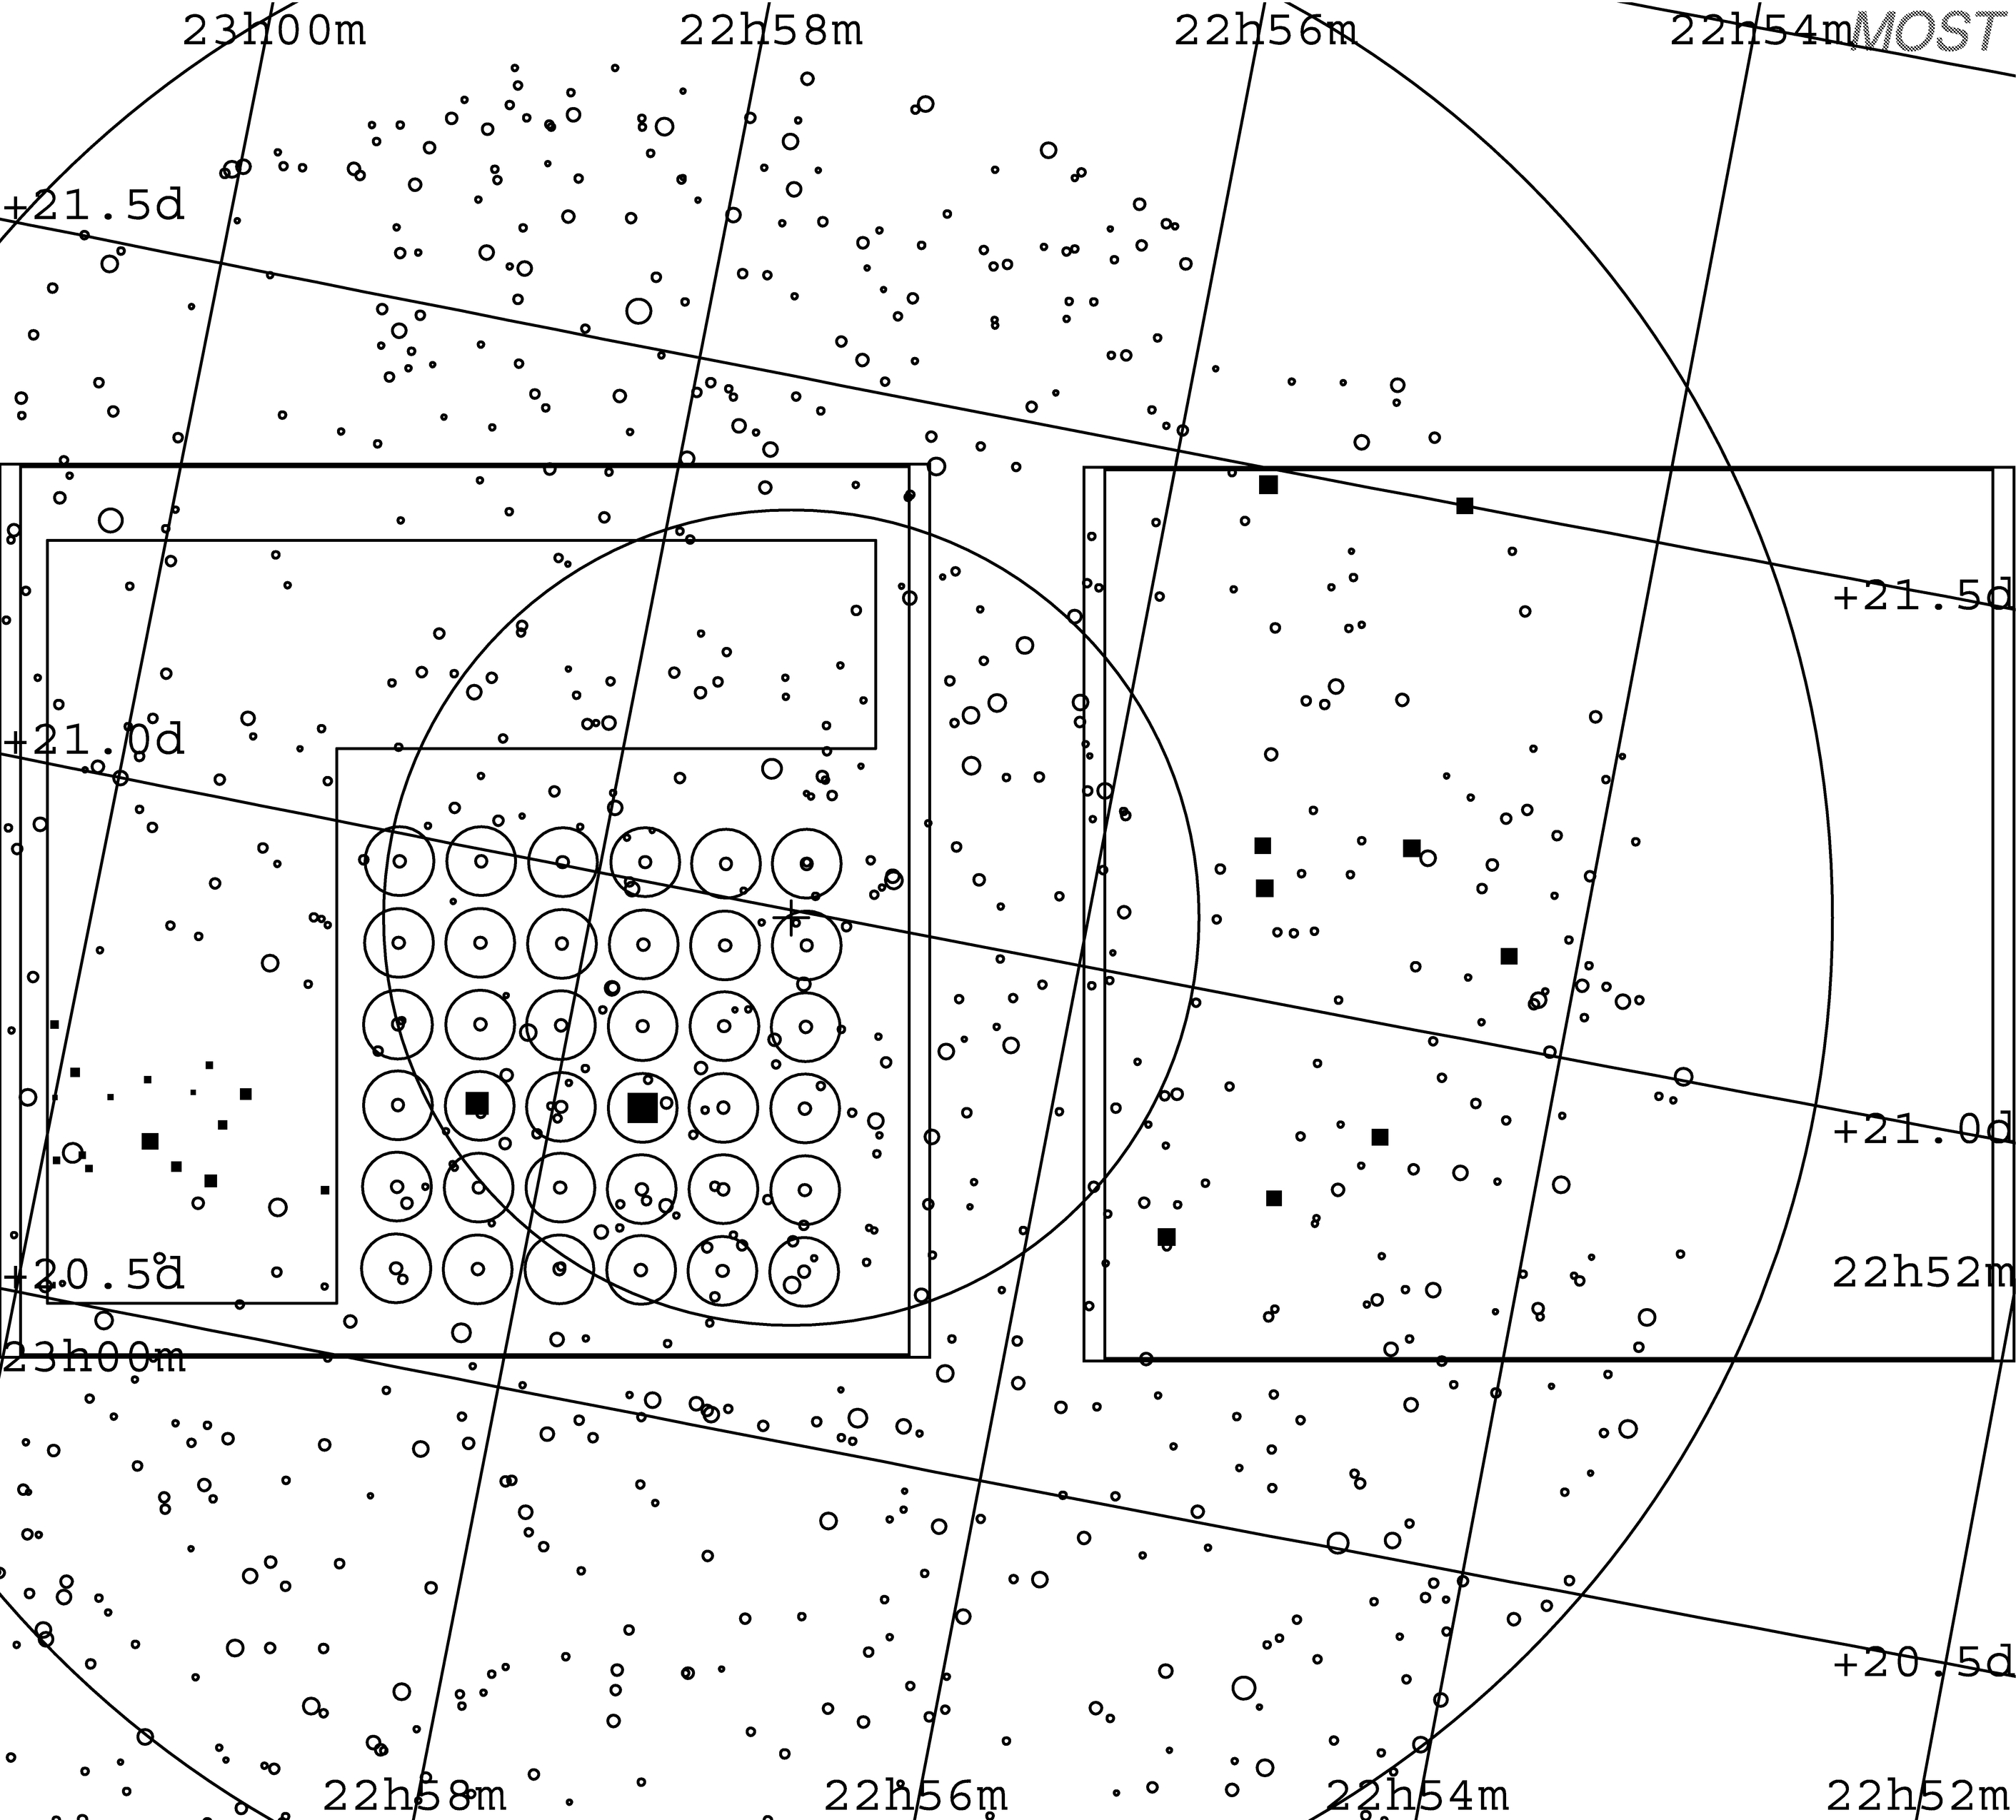
Fig. 7.— Active areas of the guidance and science CCDs are shown superposed on a star field together with outlines of the Fabry lenses and their field stops. The size of a stellar symbol corresponds to its brightness. Filled symbols are stars that will be used for tracking in the guidance field, measured by Fabry photometry in the science field and serendipitously in the open part of the science field. In the example shown here for 51 Peg, a second star actually lands centrally on a neighboring microlens for the appropriate spacecraft orientation.
Figure 8 illustrates how the data will be binned for SDS‐I and II. The small squares indicate the Fabry images for the stars and sky and the region of three serendipitous stars. The two rectangles on the right show where data will be acquired for bias and dark levels.
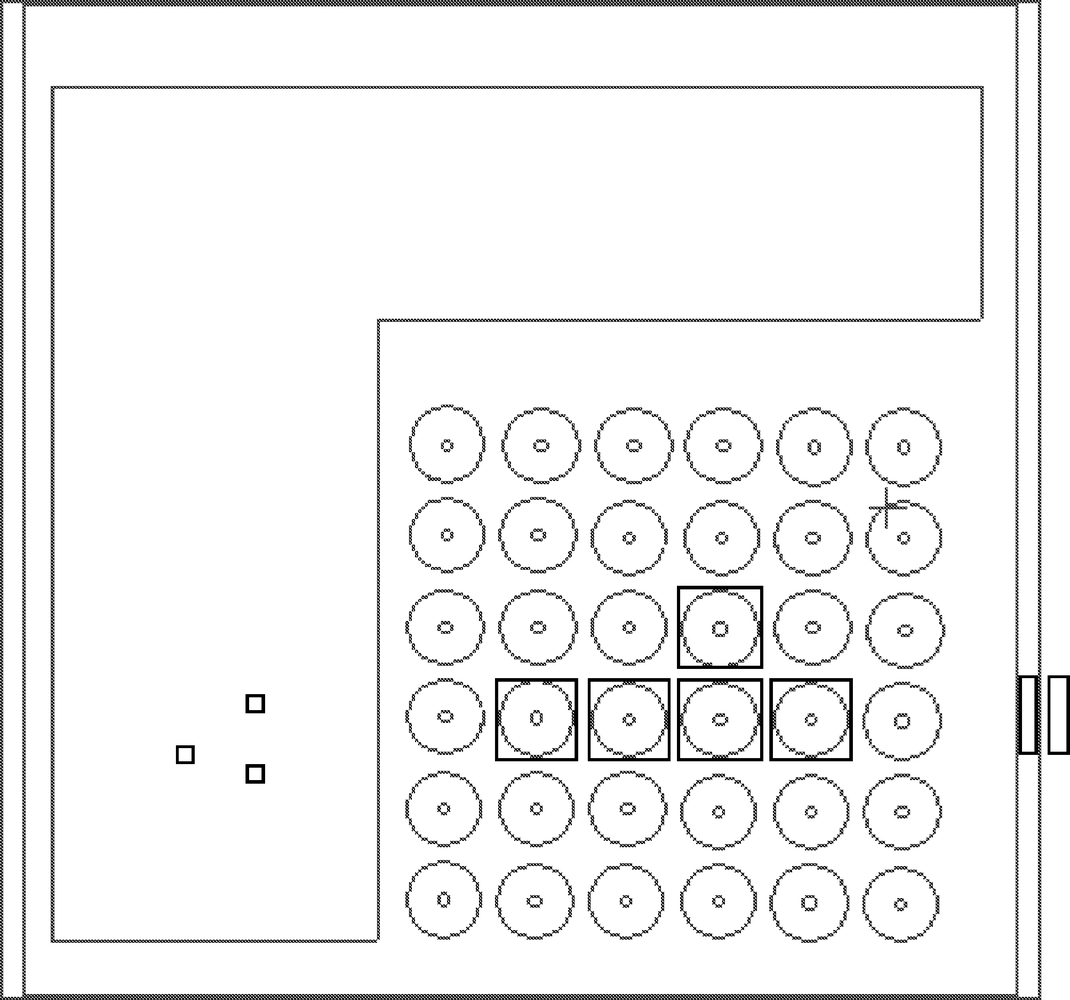
Fig. 8.— Boxes indicate those areas of the science CCD from which data will be captured and sent to ground: two target Fabry images, three "sky" Fabry images, three serendipitous direct images, and two overscanned regions for bias levels.
5. THE ORBIT
To fully profit from staring continuously at a target for weeks, we had a requirement of a greater than 80% duty cycle for observations, with a goal of greater than 90%. This means that solar eclipses by the Earth's limb and passage through the SAA must inhibit ≤10% of observations within the continuous viewing zone (CVZ). Solar eclipses lead to loss of solar sensing and power as well as thermal shock to MOST. In operation, the normal to the rear solar panels must lie within 30° of the direction to the Sun if the satellite is to maintain power.
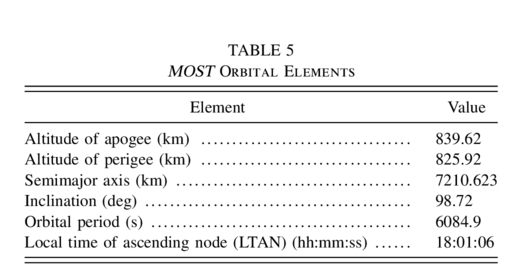
The SAA expands with altitude increasing "blackout" time for higher orbits. On the other hand, the higher the orbit, the less the limb of the Earth cuts into the CVZ to introduce parasitic light, and the shorter Earth eclipses will be at one or the other of the solstices. As a compromise, an altitude of ∼820 km was chosen. A three‐stage Russian Rockot injected MOST into a near‐polar orbit (period ∼100 minutes) inclined at 98° to the equator from Plesetsk in northern Russia on 2003 June 30. It is in a Sun‐synchronous mode, which will keep it over the Earth's terminator. The CVZ spans −19° to +36° in declination when limited by 0° from the Earth's limb. The maximum dwell time in the middle of the CVZ is ∼60 days or ∼60° in right ascension. The elements of the orbit are given in Table 5 and illustrated in Figure 9.
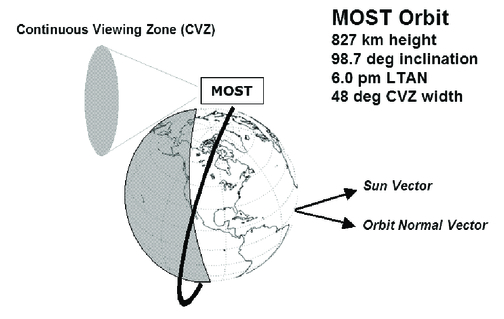
Fig. 9.— Cartoon of the MOST orbit showing the continuous viewing zone (CVZ). The elements of the orbit are listed in Table 5.
 |
6. THE PHOTOMETRY
6.1. MOST Photometric Performance
One of us (R. K.) has critically modeled the photometric performance expected from MOST. The basic properties of the system used in the models are given in Table 6. Details of the model will be presented in a forthcoming paper. Some properties came from comprehensive simulations during the project development and lab testing of the flight hardware. Measured properties are marked "m," and those that were calculated are marked "c."
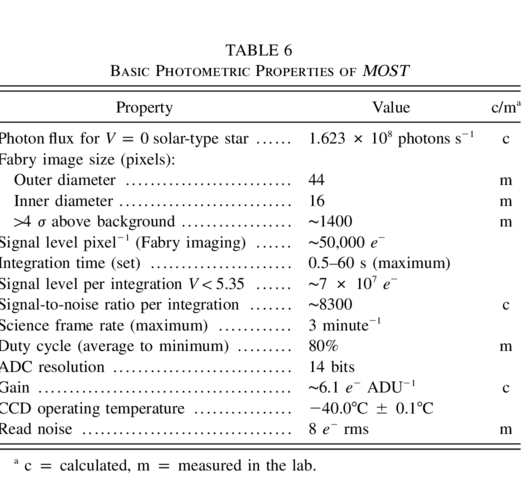 |
Figure 10 shows different perspectives of a Fabry image of a point source obtained in the lab with one of the microlenses. The virtue of Fabry images is that they remain fixed on the CCD despite tracking errors, which makes the measurements immune to sensitivity variations between pixels and within individual pixels. Integration time is set to achieve a nominal signal level of ∼50,000 e− for the highest exposed pixels (corresponding to half full well). For stars fainter than V = 5.35, integration time is fixed at 60 s.
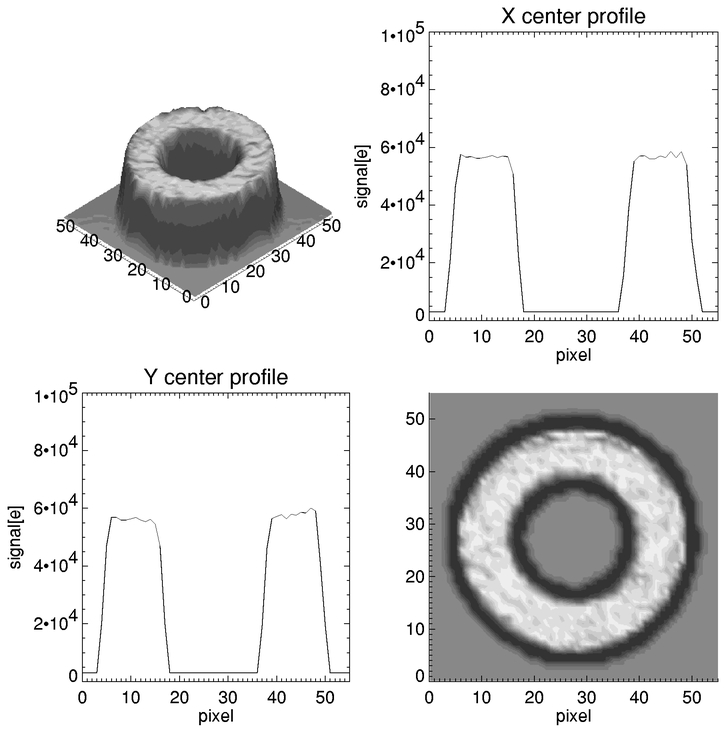
Fig. 10.— Fabry image from a point source taken with MOST in the lab shown from different perspectives.
In addition to selected Fabry images, simultaneous photometry is possible of up to six stars in the open field as shown on Figure 8, where stellar images are defocused to 1.8–2.5 pixels FWHM. Figure 11 shows examples of point‐source images taken in the open area of the science CCD. In this case, star images wander according to tracking errors. There is also a weak vignetting gradient. The image resulting from an exposure of several tens of seconds will spread, typically, over some 16 pixels.
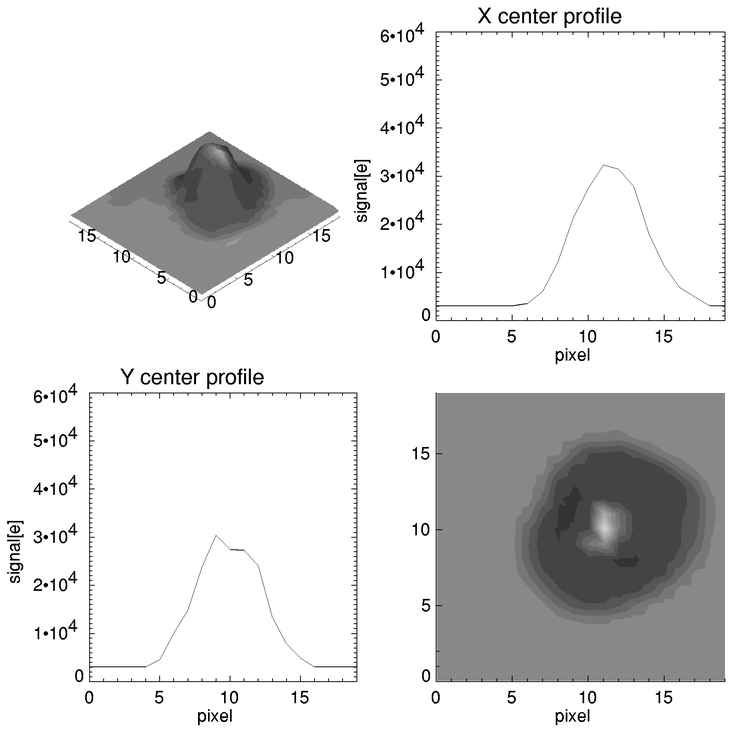
Fig. 11.— Direct image of a point source taken by MOST in the lab from the open area of the science CCD. In orbit, the image will be washed out over several pixels by tracking jitter.
Suitable primary MOST targets for Fabry imaging lie in the range V = 0.4–6.0. Secondary targets falling on any other microlens should not be more than 0.5 mag brighter than the main target star or 5 mag fainter. Secondary targets in direct imaging mode have to be at least 5.5 mag fainter than the primary Fabry‐imaged target to avoid saturation. The total time base for a set of observations is the dwell time in the CVZ. The maximum possible is ∼60 days. The actual duration will be set by the MOST Science Team, who will take account of the target star's characteristics.
6.2. The Field Stop Response
Normally, from the ground, changes in the brightness of a variable star are determined by reference to a nearby standard. There are cases, such as the one illustrated in Figure 7, where a second star of similar brightness will land in the field stop of a nearby Fabry lens. At the level of ppm, it is unlikely that any comparison star will be constant, and the MOST photometric response also depends on the position of each star in its field stop. The history of tracking errors and therefore the wander of the star will be given by the guidance system (ACS). The challenge will be to calibrate relative photometric response with position in each field stop.
Several factors such as change of telescope obliquity, irregularities in the optics, and unseen faint companions will modify the photometric response depending on the position of the target star image in its field stop. Apart from the surface of the microlens window on which the field stops are defined, all optical irregularities will be out of focus, many of them highly so. Such irregularities (dust, microbubbles, etc.) in common with obliquity and vignetting effects will only vary slowly with position in the field stop. Irregularities on the lower surface of the microlens window could introduce sharper changes, and particular attention has been given to cleanliness.
We intend to calibrate the field stop response with the target star itself. In a 10 day set of observations, there would be more than 30,000 separate observations, each of which has an associated offset error from the target field stop center as measured by the guidance system. Although the star itself will vary by ppm on a timescale of a few minutes, the effect of image wander is to wash out any systematic association of phase with position in the field stop. In other words, the star can be considered constant in brightness, and the individual observations can be accumulated to generate a normalized field stop response.
There are other systematic effects that will impact the photometric response, such as the angular distance from the SAA and the temperature of the CCD and of the telescope assembly itself. All of these will be monitored and dependent trends in the data removed. This technique has been very successfully demonstrated by Zwintz et al. (1999).
6.3. The Simulations
Numerical simulations of the MOST photometric performance were implemented at the start of the design phase. This was part of a systems approach to establish an error budget, which fed into the technical specifications for each basic element of the instrument. A partial list of input parameters to the simulations is given in Table 7.
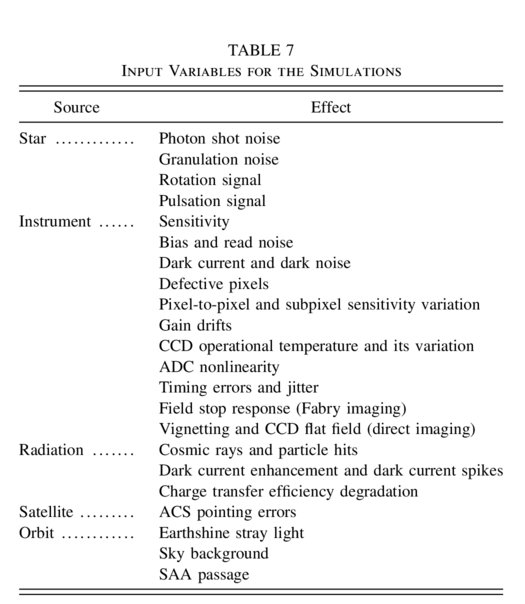 |
All of the effects in Table 7 were included when simulating photometric data with stellar magnitude, model stellar pulsation variations, integration time, and total on‐target time as global variables. This was followed by a time‐series analysis to determine the noise spectrum (0 to Nyquist frequency) and an attempt to recover stellar pulsation signals with the expected amplitudes, e.g., solar‐type variations.
Full details of the reduction procedure will appear with the first photometric paper. The amplitude spectrum in Figure 12 demonstrates how well we were able to recover the equivalent of solar l = 0, 1, 2 pulsations from a 10 day simulated light curve of a V = 4.0 solar‐type star, taking into account realistic values for the variables in Table 7. It is worth noting that the Fourier spectrum shown is raw data, with only bias subtraction.
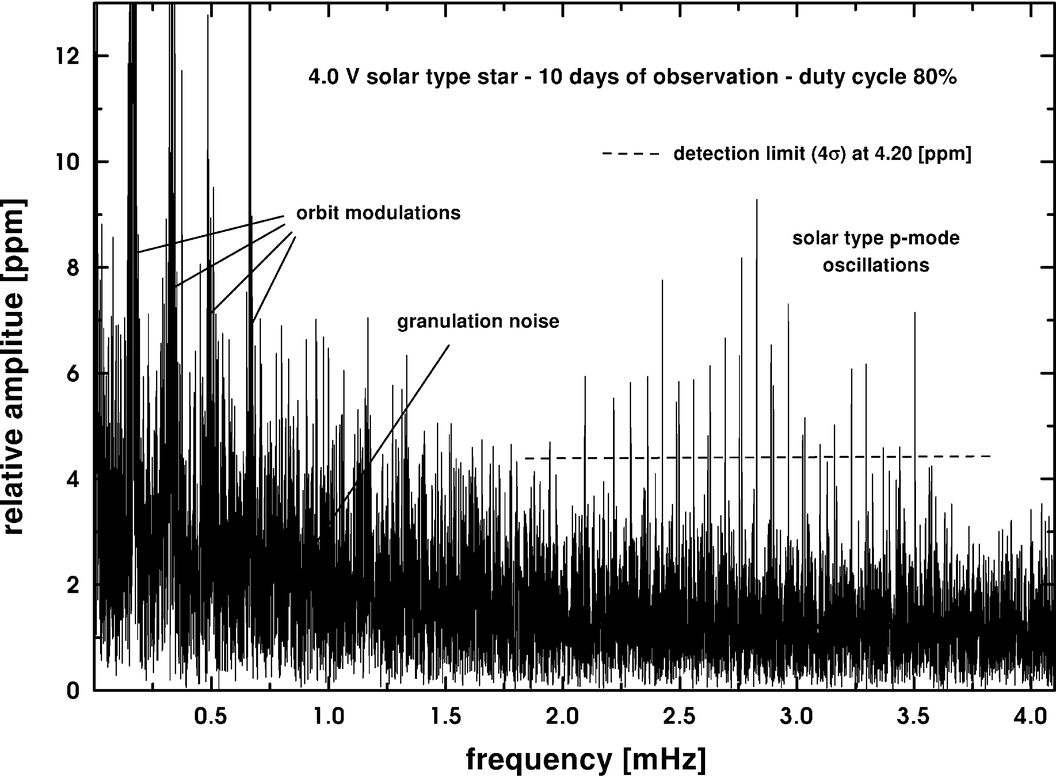
Fig. 12.— Amplitude spectrum recovered from a 10 day simulated light curve of a V = 4.0 solar‐type star after taking into account realistic values for the variables in Table 7. The simulation was for the equivalent of solar l = 0, 1, 2 pulsations.
The success of these simulations in detecting solar‐type pulsations, taking realistic account of the MOST characteristics and its environment, gives us considerable confidence that this experiment will be highly successful.
The Canadian Space Agency funded the University of British Columbia (UBC) for scientific aspects of MOST and appointed Dynacon, Inc., prime contractor for the satellite. The scientific instrument was built by UBC under contract to Dynacon. Both Dynacon, Inc., and UBC subcontracted to Spectral Applied Research for some design work and testing. Subcontracts were also let to CRESTech. The Ontario Research and Development Challenge Fund helped establish the integration facilities at University of Toronto Institute for Aerospace Studies with matching funds from University of Toronto and Dynacon, Inc. All of this funding is gratefully acknowledged, as well as the support to individual scientists from the Canadian Natural Sciences and Engineering Research Council and the Ontario Centre for Research in Earth and Space Technology.
Footnotes
- 1
Available from Brault Research Organisation, http://www.bro.com.
- 2
Available from Space Radiation Associates, http://www.spacerad.com.