
ABSTRACT
MIPSGAL is a 278 deg2 survey of the inner Galactic plane using the Multiband Infrared Photometer for Spitzer aboard the Spitzer Space Telescope. The survey field was imaged in two passbands, 24 and 70 μm with resolutions of 6'' and 18'', respectively. The survey was designed to provide a uniform, well-calibrated and well-characterized data set for general inquiry of the inner Galactic plane and as a longer-wavelength complement to the shorter-wavelength Spitzer survey of the Galactic plane: Galactic Plane Infrared Mapping Survey Extraordinaire. The primary science drivers of the current survey are to identify all high-mass (M > 5 M⊙) protostars in the inner Galactic disk and to probe the distribution, energetics, and properties of interstellar dust in the Galactic disk. The observations were planned to minimize data artifacts due to image latents at 24 μm and to provide full coverage at 70 μm. Observations at ecliptic latitudes within 15° of the ecliptic plane were taken at multiple epochs to help reject asteroids. The data for the survey were collected in three epochs, 2005 September–October, 2006 April, and 2006 October with all of the data available to the public. The estimated point-source sensitivities of the survey are 2 and 75 mJy (3 σ) at 24 and 70 μm, respectively. Additional data processing was needed to mitigate image artifacts due to bright sources at 24 μm and detector responsivity variations at 70 μm due to the large dynamic range of the Galactic plane. Enhanced data products including artifact-mitigated mosaics and point-source catalogs are being produced with the 24 μm mosaics already publicly available from the NASA/IPAC Infrared Science Archive. Some preliminary results using the enhanced data products are described.
Export citation and abstract BibTeX RIS
1. INTRODUCTION
Unbiased, large-scale infrared surveys of the sky have provided a wealth of information on astronomical phenomena arising from emission by interstellar dust and/or from objects that are either intrinsically cold or have such high extinction as to be invisible at shorter wavelengths. The early all-sky surveys characterized new or little-known components of the sky: the Two Micron Sky Survey (TMSS; Neugebauer & Leighton 1969) found a near-infrared sky populated by stars enshrouded in circumstellar dust; the Air Force Cambridge Research Laboratory/Geophysics Laboratory (AFCRL/AFGL) mid-infrared survey (Walker & Price 1975; Price & Walker 1976) found a colder population and several examples of post-asymptotic giant branch (post-AGB) stars and preplanetary nebulae sources, the Infrared Astronomical Satellite (IRAS; Neugebauer 1985) observed emission from interstellar dust, infrared cirrus, and ultraluminous infrared galaxies, while the Two Micron All Sky Survey (2MASS; Skrutskie et al. 2006) results included defining the population of brown dwarfs.
The Galactic plane has historically been well studied because it is rich in bright sources making it a prime target if observational resources are limited. Thus, Hoffmann et al. (1971) surveyed a large portion of the plane at 100 μm from a balloon platform while the rocket-borne measurements of Houck et al. (1971) sampled the inner plane at wavelengths between 5 and 100 μm. Hayakawa et al. (1979) conducted the first large-scale, near-infrared 2.4 μm balloon-borne survey of the Galactic plane; previous experiments had only measured the center and bulge. These observations clearly showed that the distribution of diffuse 2.4 μm radiance of the inner Galaxy was asymmetric, with the plane being brighter in the first quadrant than the fourth. Price (1981) confirmed the asymmetry in the AFGL data and concluded that only half the emission could be explained by stars; the remainder was from interstellar dust.
The high density of infrared point sources plus the large and variable extinction in the plane have invited continued surveys of the Galactic plane at ever increasing sensitivity and resolution. Each successive survey has added to our understanding. The Midcourse Space Experiment (MSX) full plane survey (Price et al. 2001) and the limited-area Infrared Space Observatory Galactic survey (ISOGAL; Omont et al. 2003) obtained by the Infrared Space Observatory (ISO) identified a new type of molecular cloud core, the infrared dark clouds (IRDCs; Egan et al. 1998; Perault et al. 1996), and found a number of young stellar objects that may be used as tracers of Galactic structure. The higher resolution of these surveys resolved many of the IRAS point sources into small clusters and, occasionally, into compact but extended sources (e.g., Crowther & Conti 2003).
The launch of the Spitzer Space Telescope (Werner et al. 2004) has provided this decade's opportunity for surveys with better sensitivity and resolution than those of MSX and ISO. However, as Spitzer is a general purpose observatory, the areal coverage of the approved surveys is necessarily smaller than those of MSX and IRAS. Not surprisingly, improvements in detectors, observatory operating efficiency, and the use of observing modes designed to cover large regions of sky permitted a much larger fraction of the Galactic plane to be mapped with Spitzer than with ISO. For example, the ISOGAL project mapping rate at 15 μm (to a depth of 10 mJy) was ∼0.14 deg2 hr-1, while the survey presented here has a rate of ∼0.5 deg2 hr-1 at 24 μm for a depth of ∼1 mJy.
We describe the latest in infrared surveys that uses the Multiband Imaging Photometer (MIPS; Rieke et al. 2004) aboard Spitzer. This survey, called MIPSGAL (for MIPS Galactic Plane Survey; S. Carey PI13), was granted 565 hr of observing time to survey 278 deg2 of the inner Galactic plane at 24 and 70 μm. The main scientific objectives are to identify massive protostars and examine the distribution and energetics of interstellar dust. The observations were conducted in two separate Spitzer observing programs with program identification (PID) numbers, 20597 and 30594. The MIPSGAL observations, when merged with a complementary program observing the Galactic center region (PID 20414; F. Yusef-Zadeh PI), provide complete coverage of the Galactic midplane for 0° < l < 63° and 298° < l < 360°. More specifically, |b| < 1° is covered for 5° < l < 63° and 298° < l < 355° and |b| < 3° is covered for |l| < 5°. Figure 1 displays the coverage of the astronomical observation requests (AORs) comprising the MIPSGAL survey. The gap in the middle of the survey is filled by the Yusef-Zadeh observations.
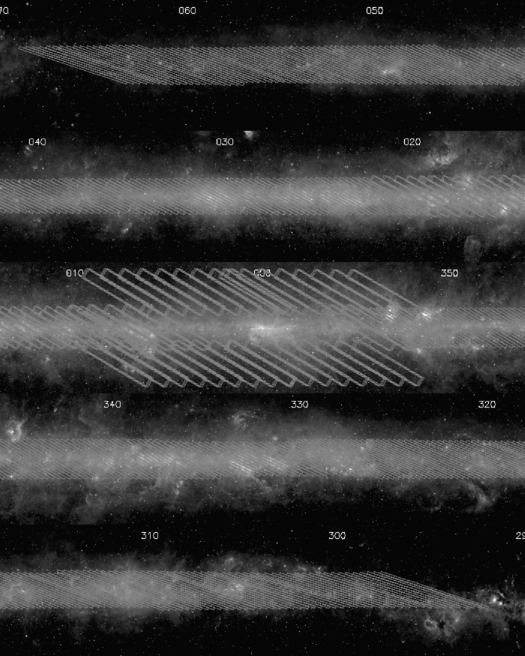
Fig. 1.— Coverage of MIPSGAL observations overlaid on an MSX 8 μm mosaic (Price et al. 2001) of the Galactic plane. The longitudes spanned are displayed at the top of each panel. The boundaries of each AOR are shown as a gray rectangle. Each of the 5 panels in the image is 28° in longitude by 7° in latitude. The image stretch is logarithmic from 5 to 500 MJy sr-1.
We describe the synergy of this survey with the other large Spitzer Galactic plane survey in § 1.1 and contrast it to recent and near-future full-sky infrared surveys in § 1.2. Section 1.3 puts this survey in context with ongoing and future longer-wavelength surveys. The scientific objectives of the survey are outlined in detail in § 2. We describe the observing strategy in § 3. An overview of the data processing and data products is provided in §§ 4 and 5, respectively. Section 6 contains a sampling of initial results.
1.1. Synergy with GLIMPSE
The first Spitzer survey of the Galactic plane is the Galactic Plane Infrared Mapping Survey Extraordinaire (GLIMPSE; E. Churchwell PI; Benjamin et al. 2003). GLIMPSE was one of the six original Spitzer Legacy class programs and covered two regions of the Galactic plane spanning Galactic latitudes of |b| < 1° and Galactic longitudes of 65° < l < 10° and 295° < l < 350°. GLIMPSE mapped the fields with the Infrared Array Camera (IRAC; Fazio et al. 2004a), which covers the wavelength range of 3–9 μm in four spectral bands. The original survey has been followed up by two more programs (GLIMPSE II and GLIMPSE 3D). The GLIMPSE II (PID 20201; E. Churchwell PI) survey continued the original survey for Galactic longitudes |l| < 10°, while GLIMPSE 3D (PID 30570; R. Benjamin PI) extended the latitude coverage at specified Galactic longitudes. The Galactic center region is covered by a separate IRAC program (PID 3677; S. Stolovy PI; Stolovy et al. 2006). Enhanced GLIMPSE data products and documentation are available through the Infrared Science Archive (IRSA).14 Related large Galactic plane-mapping programs that do not overlap with MIPSGAL are the IRAC survey of Vela-Carina (PID 40791; S. Majewski PI), and the MIPS and IRAC surveys of Cygnus X (PID 40184; J. Hora PI) and 21 deg2 of the outer Galaxy (102° < l < 109°, 0° < b < 3°; PID 50398; S. Carey PI).
The structured and varying background and high density of point sources in the Galactic plane result in sensitivity or confidence limits for extracted point sources that are a function of position and local background. As a result, a straightforward application of σ threshold is not an adequate description of the confidence level of a source. Robitaille et al. (2007) present limits of 0.5, 0.5, 2.0, and 5.0 mJy for confident measurements of point sources at 3.6, 4.5, 5.8, and 8.0 μm, respectively, for the GLIMPSE data set. The Robitaille limits are determined from examination of several thousand spectral energy distributions and corresponding residual images. The GLIMPSE point-source catalog (Meade et al. 2007) is even more restrictive and used simulated truth sets and analysis of a deeper verification field to determine their sensitivity limits for the very high-reliability catalog (99.99%). For MIPSGAL, we currently estimate that sources brighter than 2.5 mJy at 24 μm are most certainly real. This value was determined by inspection of source-fit residuals, matches to existing truth catalogs, and reliability studies using injection of artificial sources to the MIPSGAL mosaics (S. Shenoy et al. 2009, in preparation). The GLIMPSE data set is more sensitive to stellar photospheres than the MIPSGAL survey. The final GLIMPSE catalog reaches a limiting magnitude of 14.1 mag at 3.6 μm (Meade et al. 2007) compared to our most optimistic cutoff of 9 mag at 24 μm for stars without infrared excess (bare photospheres). However, for sources redder than the main sequence, MIPSGAL is generally more sensitive than GLIMPSE. As a result, a greater fraction of sources detected in MIPSGAL will be evolved stars and protostars. For many lines of sight, GLIMPSE is point-source confusion limited due to the high stellar-column density in the Galactic plane, while MIPSGAL is generally limited by the structure of the diffuse background. In addition, the Galactic midplane has a significant opacity even at mid-infrared wavelengths. Mercer et al. (2005) showed the path length that the GLIMPSE survey was able to probe decreased with decreasing Galactic longitude. As the extinction at 24 μm is 40% lower than that at 8.0 μm (Draine 2003), MIPSGAL observations for highly extincted lines of sight will provide complementary information on Galactic structure even though the 24 μm data are less sensitive to the red-clump giant population used as a probe of Galactic structure (Benjamin et al. 2005). As discussed in § 2.1, the combination of IRAC and MIPS photometry will be a powerful tool for identifying and characterizing protostars.
1.2. Comparison with Recent and Upcoming Mid-Infrared Surveys AKARI and WISE
The AKARI mission has recently completed an all-sky survey in the mid-infrared at 9 and 18 μm and in the far-infrared from 60 to 180 μm. The sensitivity of their 18 μm band is 120 mJy per survey scan, and it has a resolution of 10'' for the all-sky survey observations (Onaka et al. 2007). The Wide-Field Infrared Survey Explorer (WISE; Mainzer et al. 2005) is currently scheduled to launch in late 2009 and will survey the sky in four infrared bands, 3.3, 4.7, 12, and 23 μm with a resolution of 12'' and nominal sensitivity of 2.6 mJy at 23 μm. Due to the survey strategies of both AKARI and WISE, their final sensitivities are a function of ecliptic latitude. The region of the Galactic plane observed by MIPSGAL spans ecliptic latitudes from -52° to +40° with the survey longitude edges being at the ecliptic latitudes farthest from the ecliptic plane. The AKARI and WISE sensitivities increase by a factor of ∼1.2 at the MIPSGAL survey edges. The AKARI and WISE observations complement the higher-resolution and higher-sensitivity observations at 24 μm from MIPSGAL. Both the AKARI and WISE teams plan to deliver high-fidelity source catalogs to the public and the WISE team plans to distribute calibrated mosaics.
1.3. Current and Upcoming Far-Infrared and Submillimeter Surveys
The upcoming survey of the northern Galactic plane with SCUBA-2 on the James Clerk Maxwell Telescope (JLS/GPS; Holland et al. 2006) and the recently approved survey of the inner Galactic plane with Herschel (Hi-Gal; Molinari et al. 2005) will provide important, long wavelength complements to the existing mid-infrared surveys of the Galactic plane. The JLS/GPS survey will cover most of the first quadrant region observed by MIPSGAL/GLIMPSE with comparable resolution at 450 μm to the MIPSGAL 24 μm data. Hi-Gal will cover the entire MIPSGAL/GLIMPSE survey region at 75, 175, 250, 350, and 500 μm with equivalent resolution at 75 μm to MIPSGAL at 24 μm. The APEX Telescope Large Area Survey: the Galaxy (ATLASGAL) is an 870 μm survey using the LaBoCa camera on the Atacama Pathfinder Experiment (APEX) of the plane between -80° < l < 80°, |b| < 1° with 18'' resolution. At this time, 95 deg2 of the ATLASGAL fields have already been mapped (Menten et al. 2008). A continuum survey at 1.3 mm (31'' resolution) of the northern Galactic plane, which has considerable overlap with GLIMPSE/MIPSGAL, is currently being conducted with Bolocam on the Caltech Submillimeter Observatory (Williams et al. 2007). Other submillimeter surveys that have some overlap with the MIPSGAL survey field are the Balloon-Borne Large Aperture Submillimeter Telescope (BLAST; Pascale et al. 2008), which surveyed several fields of a few square degrees in size at 250 (32'' resolution), 350, and 500 μm overlapping the MIPSGAL maps (Chapin et al. 2008), and the Archeops balloon mission (Benoît et al. 2002), which covered the Galactic plane between 30° < l < 180° (Désert et al. 2008) at wavelengths of 550 (480'' resolution), 875, 1380, and 2100 μm. These longer-wavelength surveys will provide critical photometric data on the earliest stages of star formation and identify the mass reservoirs out of which the infrared-identified massive protostars and protoclusters are forming. For studies of the distribution and energetics of interstellar dust, the far-infrared and submillimeter provide information on large dust grains (BGs) in a complementary fashion to the 8 μm data from GLIMPSE that are sensitive to the emission from polycyclic aromatic hydrocarbons (PAHs) and the 24 μm data of MIPSGAL that trace the diffuse emission from very small grains (VSGs).
2. MAIN SCIENCE DRIVERS
The MIPSGAL survey observations were designed with three primary goals. The first was to provide a uniform, well-calibrated, and well-characterized data set for general inquiry of the inner Galactic plane and as a longer-wavelength complement to GLIMPSE. The second objective was to identify and characterize massive protostars in the inner Galactic disk. The third was to gain a deeper understanding of the distribution, energetics, and size distribution of interstellar dust in the disk of our own Galaxy. We describe each of these goals in some detail and also highlight some ancillary science enabled by the MIPSGAL survey. The list of potential science enabled is not comprehensive but is intended to illustrate the broad range of inquiry facilitated by these data. The greatest potential return of the survey is unanticipated science as serendipitous discoveries almost always result from unbiased surveys at higher resolution and sensitivity than previous work. Some iconic examples of new science coming from surveys have been mentioned in § 1. Discoveries of new phenomena and populations are facilitated by large, uniform data sets as these may be reliably mined for rare objects. For example, 2MASS, the Deep Near Infrared Southern Sky Survey (DENIS; Epchtein et al. 1997), and the Sloan Digital Sky Survey (SDSS; York et al. 2000) have discovered a large enough population of brown dwarfs to permit extending the stellar spectral classification scheme to include them and to assess their true contribution to the local mass density. The homogenous nature of large survey data sets permits the creation of uniform source catalogs and allows future investigators to perform systematic, statistically significant studies.
2.1. Protostellar Identification
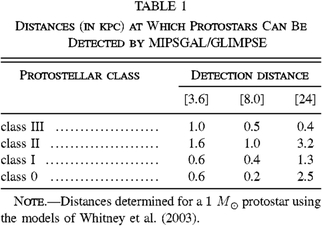
The 24 and 70 μm images from MIPSGAL are powerful tracers of class 0–III protostars. Class I–III protostars have spectral energy distributions (SEDs) that peak between these wavelengths. The modeling of Whitney et al. (2003) demonstrates that protostars are easily distinguished from other objects in color-color plots using 70 and especially 24 μm as one of the bandpasses. In combination with the mid-infrared photometry from IRAC and near-IR photometry of 2MASS, sources can be compared to sophisticated model spectra (Robitaille et al. 2006) to probe evolutionary state and mass. Using the models of Whitney et al. (2003) as a guide, an isolated 1 M⊙ protostar can be detected in the MIPSGAL-GLIMPSE data out to the distances given in Table 1. However, many low-mass stars will not form in isolation and many of the sources identified will be blends and portions of protoclusters. While distributed low-mass protostars (e.g., Allen et al. 2008) can be individually detected and photometered, only the aggregated infrared emission will be available for many sources.
 |
The sensitivity and resolution of MIPSGAL at 24 μm permit resolution of ultracompact H II (UCHII) regions to a distance of ∼4 kpc assuming a typical UCHII diameter ∼0.1 pc (Wood & Churchwell 1989) and detection of UCHIIs throughout the Galactic disk. The slight mid-IR excess from very early, massive (M > 5 M⊙) stars will also be detectable as even cores of M = 104 M⊙ and T = 25 K (pre-protostellar cores) produce enough 24 μm emission to be detected at a distance of 3 kpc (Sridharan et al. 2002). The 70 μm data are sensitive to even younger objects albeit at a lower spatial resolution.
These data can be used to examine the clustering of protostars as a function of mass and evolutionary state, extending the sample of well-characterized star-forming regions beyond 1 kpc. It is possible that if clustering is studied for a statistically significant sample of regions, current (competing) theories of massive star formation such as turbulent fragmentation (Krumholz et al. 2005) and competitive accretion (Bonnell et al. 2004) can be tested. Shocks and winds from nearby massive stars have been shown to trigger star formation (e.g., Redman et al. 2003), but the efficiency of triggers relative to other factors has not been quantified. By surveying most of the star formation in the Galactic disk, MIPSGAL, GLIMPSE, and the ongoing and future surveys mentioned in §§ 1.2–1.3 have the potential to identify the key processes in the formation of massive stars.
The combination of these infrared surveys with spectroscopic surveys of molecules (e.g., 13CO from the Galactic Ring Survey; Jackson et al. 2006) and radio recombination lines (e.g., Caswell & Haynes 1987; Lockman 1989) can provide kinematic distances permitting a census of massive star formation in the inner Galaxy. By counting the number of high-mass protostars, a direct measure of the current star-formation rate can be made. This measurement can then be compared to less direct measurements such as total far-infrared luminosity, which is currently used to estimate the star-formation efficiency of external galaxies. The synthesis of surveys over the Galactic plane at varied wavelengths can be used to calibrate extragalactic star-formation efficiency and activity tracers.
2.2. Physics of Interstellar Dust
Mid- to far-infrared observations directly measure the emission of several different dust components. Observations shortward of 24 μm are often dominated by emission from PAHs or other carriers of the infrared emission bands. The 24 μm passband is sensitive to emission from very small, stochastically heated dust grains while longer wavelengths provide information on BGs which are closer to thermal equilibrium (see Draine 2003 for a review of interstellar grains).
The SED of dust emission is a sensitive function of the relative populations of these three grain types and the radiation field they are subjected to (Flagey 2007). In combination with the GLIMPSE data, our survey at 24 and 70 μm can be used to infer the column density and the excitation conditions of PAHs, VSGs, and BGs along a line of sight. The addition of longer-wavelength data permits more detailed studies of the large-grain population. From broadband color variations, changes in ambient radiation field and ionization state can be observed. In turn, variations in the incident radiation field can be used to infer the nature of the exciting sources of the dust.
For fixed dust component abundances, we can model the dust emission for different incident radiation field intensities as shown in Figure 2. We use the spectral shape of the standard interstellar medium radiation field (ISRF) from Mathis et al. (1983) and scale it by a factor (χ) of 1, 100, and 10000. As the energy density of the ISRF increases, the BGs' temperature increases and their emission shifts to shorter wavelengths. The peak emission of the VSG component shifts less significantly to shorter wavelengths while the PAH emission does not shift at all. As a consequence, the color ratios between IRAC 8 μm, MIPS 24 μm, and MIPS 70 μm significantly depend on the ISRF. In the diffuse interstellar medium (ISM; χ ∼ 1), the BG temperature is about 15–20 K and the 24 μm to 70 μm ratio is smaller than 1. As long as the radiation field is not strong enough to make the BGs' contribution within the 24 μm passband significant, the 24 to 70 μm ratio decreases. For highly excited regions (χ ∼ 104), the BGs can be hotter than 100 K and the SED reaches its maximum at wavelengths close to 24 μm. The 24 to 70 μm brightness ratio thus increases and can be much higher than 1 (e.g., in supernovae remnants). For a given or known incident radiation field, IRAC 8 μm, MIPS 24 μm, and MIPS 70 μm relative intensities can be used to directly probe the relative abundances of each dust component.
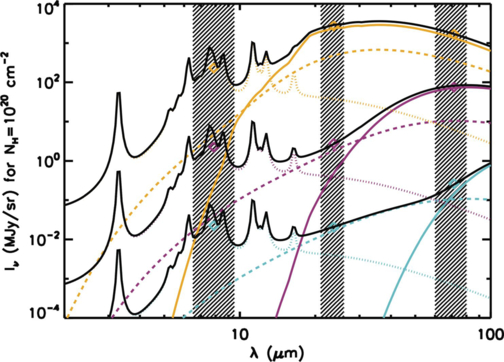
Fig. 2.— Model SEDs for various ISM environments showing the contributions in the IRAC 8 μm passband and the MIPS 24 and 70 μm passbands. The curves from top to bottom are for incident radiation fields factors (χ) of 10000, 100, and 1 times that of the Mathis et al. (1983) ISRF. The 8, 24, and 70 μm passbands are indicated by the crosshatching. The total model (thick black solid line) consists of a PAH component (dotted line), a VSG component (dashed line) and a large-grain component (thick solid line). The individual model components are color-coded based on incident radiation field.The χ = 10,000 models are cyan, the χ = 100 models are magenta, and the χ = 1 models are yellow.
2.3. Extinction Mapping
The 24 μm data can be used to map infrared extinction using the diffuse background in the Galactic plane. Dense molecular cloud cores can have extinctions of 1–2 mag at 24 μm (Carey et al. 1998). Several thousand IRDCs (mid-IR extinctions >1 mag) have been identified in the MSX and ISOGAL survey fields (Perault et al. 1996; Egan et al. 1998; Simon et al. 2006). The 8/24 μm opacity ratio of these objects can be used to infer the grain size distribution (e.g., Hennebelle et al. 2001) and the mid-infrared optical depth of the clouds can be used to estimate the mass of the molecular cores (Carey et al. 1998) independently of spectral-line gas tracers or submillimeter continuum and without regard for depletion and/or temperature and dust emissivity effects.
2.4. Structure Studies
The sensitivity and angular resolution of Spitzer make possible the study of ISM physics on scales ranging from the large-scale structure toward the Galactic center to those at which supernova explosions and the winds of massive stars dominate the structure down to that at which turbulence does. Maps of the diffuse 24 and 70 μm emission in the Galactic plane will constrain the physical conditions of the gas clouds in which the VSGs and BGs reside.
Where corresponding CO, H I, and radio continuum data are available, a multicomponent model (Sodroski et al. 1997; Paladini et al. 2007) can be used to partition the small-grain emission originating in each of the different ISM phases (warm ionized, warm neutral, and cold neutral media: WIM, WNM, and CNM, respectively). Due to the low resolution of earlier infrared data sets, inversion techniques (Bloemen et al. 1986) were only able to estimate dust properties by averaging over large (few kpc) Galactocentric radii bins. MIPSGAL data, combined with recent H I (Stil et al. 2006) and 13CO (Jackson et al. 2006) high-resolution data cubes, will make possible the derivation of emissivity coefficients, temperatures, and gas-to-dust ratios on sub-kpc scales, thereby providing a detailed picture of the spatial variations of dust properties. The inversion technique will be limited by the resolution of the H I data; currently 60'' for various components of the international Galactic plane survey (IGPS; Stil et al. 2006; McClure-Griffiths et al. 2005).
A two-dimensional power spectrum analysis of the Milky Way midplane will allow us to address new questions relating to ISM structure. For lines of sight dominated by a single emitting region, the power spectrum is a powerful tool, but interpretation of more complicated lines of sight is very challenging. Using data from the Spitzer Galactic First Look Survey, Ingalls et al. (2004) found that the power spectrum of 24 and 70 μm emission toward (l,b) = (254.5°,-9.5°) has a spectral index of -3.5 at small scales (6''–60''), consistent with Kolmogorov turbulence. At large scales, however, there is a break in the spectrum, suggesting that the emitting medium for that region is formed into sheets of width 0.3 pc. This change in spectral index would have been difficult or impossible to measure with previous far-infrared or radio surveys of the Galactic plane, which had resolutions of at best 45''. A hint of the spectral index break is shown in the data of Gautier et al. (1992); however, without the small spatial scale data, they were able to fit the power spectrum with a single power law of index -3.0. Because the cold neutral medium seen in [H I] self-absorption is deduced to be sheetlike (Heiles & Troland 2003), it is possible that the 24 μm emission mainly traces CNM gas. Another possibility, that the 24 μm emission traces only a thin surface layer of the gas, is unlikely because the break is seen also at 70 μm. With MIPSGAL, the prevalence of Kolmogorov-like turbulence in Galactic gas can be tested on scales ranging from kiloparsecs down to tenths of parsecs. In addition, the mass fraction of sheetlike versus volume-filling emitting gas can be measured.
2.5. Evolved Stars
As low- to moderate-mass stars evolve up the asymptotic giant branch, burning hydrogen and helium in shells around their cores, their atmospheres expand and cool. The stars experience significant mass loss via strong stellar winds, resulting in the expulsion of a substantial fraction of their initial mass. In the outer layers of the atmosphere and in the circumstellar envelope surrounding the star, the environment is ripe for dust formation. Indeed, AGB stars are thought to produce 50% or more of the dust in the Galaxy (recent reviews of AGB evolution, the mass loss process, and dust formation include Willson 2000, Herwig 2005, and Zijlstra 2006). As around the young stellar objects (YSOs) and protostars discussed in § 2.1, the dust around AGB stars emits primarily in the infrared. Because it is newly formed, and relatively unprocessed by UV radiation, the dust observed around evolved stars has spectral features, and hence photometric properties, distinct from those seen in young objects or in older objects such as planetary nebulae. Thus, when the MIPSGAL 24 μm data are compared with data at shorter wavelengths such as GLIMPSE and 2MASS, the evolved stars occupy a distinct region in color-color space, as recently demonstrated for the Large and Small Magellanic Clouds by Blum et al. (2006) and Bolatto et al. (2007), respectively. While the reddening toward our Galactic sources will not be as uniform as in those galaxies, the old and young stellar populations should still be distinguishable. Robitaille et al. (2008) have used MIPSGAL 24 μm data in conjunction with the GLIMPSE point-source catalog to identify ∼7000 candidate AGB stars.
3. OBSERVATIONS
The majority of MIPSGAL observations were taken using the MIPS fast scan mapping mode which efficiently collects data for large regions of the sky at 24, 70, and 160 μm simultaneously. The 24 μm detector is a 128 × 128 pixel Si:As array with a 5.4' × 5.4' field of view (FOV; Rieke et al. 2004). The 70 μm detector is a 32 × 32 pixel Ge:Ga array (Rieke et al. 2004). Scan mode uses the 70 μm-wide FOV of 5.2' × 5.6'; however, one-half of the 70 μm array is nonfunctioning, so the effective 70 μm width of each scan is 2.6'. A very small fraction (∼0.1%) of the survey region was covered using MIPS photometry mode to fill in small gaps between this program and the Galactic center observations of Yusef-Zadah. The scan maps have ∼10 individual exposures at 24 μm and ∼5 individual exposures at 70 μm for each sky position. The total integration times per pixel are 30 and 15 s, respectively. For the majority of the survey region, the 160 μm data were saturated and have not been processed further.
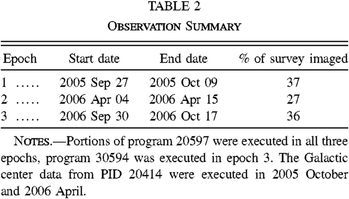
The region of the Galactic plane surveyed was tiled with individual observation requests with scan lengths between 4° and 6° in length and 3–4 scan legs per AOR. These long narrow maps intersected the Galactic plane obliquely at an angle of ∼66°. The scan direction is the long axis of each of the individual observations displayed in Figure 1. Due to Spitzer's pointing constraints, the scan angle is fixed for a given ecliptic latitude and date of observation. For low ecliptic latitudes, the scan angle is approximately the same for any possible observation date. It was most efficient to tile the Galactic plane using scans of the same direction as those near the Galactic center. As a result, the observations were scheduled in three discrete blocks each of less than 14 days. Table 2 gives specifics on each observing block. Each request was approximately 1.25 hr in duration; this duration was a trade between maximizing the efficiency of an individual observation, well tiling the survey region, and providing enough flexibility that the Spitzer Science Center could schedule the observations in a timely fashion.
 |
As the field surveyed is bright at 24 μm, residual images and other bright source effects are prevalent. We designed the survey observations to minimize these artifacts. The MIPSGAL AORs were without intervening observations, and the effects of our bright sources on other science were greatly reduced. In addition, the 24 μm array was annealed every time a data downlink was scheduled (about every 12 hr). Usually, the 24 μm array is annealed only at the beginning of an observing campaign (typical MIPS observing campaigns are 10–16 days in duration and spaced about a month apart). It takes approximately 1 hr for the 24 μm array to recover its full responsivity after an anneal. Between the downlink sequence and the MIPSGAL observations subsequent to the anneal, a short flat-field observation was included to allow the array to stabilize and for engineering analysis. By comparing photometry of sources observed both immediately before and after an anneal, we find that annealing affects the photometry by less than 3%.
The mapping strategy was driven by three criteria: (1) to have full coverage at 70 μm, (2) to have coverage in opposite scan directions at 24 μm, and (3) for low ecliptic latitude (Galactic longitudes approaching l = 0°) to have two epochs of coverage separated by 3–6 hr. The first requirement is necessary because half of the 70 μm array does not function nominally and those data are not transferred to the ground. The second requirement is to reduce the effect of bright source latents on the data. The plan was to have scans that crossed each latent-producing source in opposite directions so that one set of data would be latent free. The third requirement enables detection and rejection of asteroids because main-belt asteroids with the slowest apparent motion relative to Spitzer will move ≳6'' (more than a 24 μm beamwidth) in 3 hr. For ecliptic latitudes (β) less than 15°, asteroids are a significant foreground source component. Assuming the asteroids are from the main belt population with a Bond albedo of 0.06, the minimum detectable asteroid by MIPSGAL will have a diameter of 1 km. Ryan et al. (2008) have made a survey using the Large Binocular Telescope (LBT) of main belt asteroids down to diameters of 2 km. They find source densities of ∼90 deg-2 at β = 0°, ∼80 deg-2 at β = 5° and ∼20 deg-2 for β = 15°.
The requirement to have full coverage at 70 μm was met by having adjacent scan legs overlap by 148'' as recommended in the Spitzer Observer's Manual.15 As the overlap is slightly less than half the 24 μm array width, the scan edges have twice the nominal coverage at 24 μm. There are a few instances of small (1 pixel) gaps in the 70 μm coverage. For high ecliptic latitudes (l > 20° and l < 350°), the overlap was accomplished in a single AOR. As a single AOR scans in opposite directions on subsequent scan legs, the second criterion is satisfied for a single AOR. The only complication is the scan directions at the boundaries of AORs. For adjacent requests with even numbers of scan legs, the antiparallel condition is satisfied at the request boundaries. For the interface between two requests, one with an even number of legs and the second with an odd number of legs, some of the overlap is scanned in the same direction. Due to an error in observation planning, this situation exists for about 6% of the survey coverage. The flaw in observation strategy was corrected for the third (2006 October) observing campaign. As we have developed a secure model of persistent images produced by bright sources at 24 μm and applied corrections for the persistent images to the data, the error in observing strategy does not affect the quality of the final 24 μm mosaics.
For the observations at low ecliptic latitude, the overlapping coverages are provided by multiple overlapping requests. All overlapping requests were scheduled 3–9 hr apart enabling both rejection and multiple-epoch detection of asteroids. For the observations from 8° < l < 20°, two AORs are used to cover each strip. Each AOR uses a spacing of 302'' between scan legs with an offset of 150'' between the overlapping AORs. The AORs alternate mapping directions using the backward mapping option in Spot16 (the observation preparation tool for Spitzer). This strategy also suffers from having all scans in the same direction at some of the boundaries between AORs. For the 2006 October observations covering l > 350°, we used three separate requests to provide the coverage. Each request used a spacing of 450'' between scan legs and adjacent requests were spaced 150'' apart. The mapping direction was alternated between requests. As a 450'' scan spacing is not an option provided in the MIPS scan mapping astronomical observation template (AOT), instrument engineering requests (IERs) were generated for these observations by modifying the AOT commanding slightly. As a result, some of the visualization of AORs built into Spot will not work for these requests. We provide AOR overlay files for use with Spot for these requests on the MIPSGAL Web site.17
4. DATA PROCESSING
Substantial processing beyond the Spitzer-provided basic calibrated data (BCDs) was necessary for the MIPSGAL data. For both the 24 and 70 μm data, we start with the raw image files and the calibration products provided by the Spitzer Science Center. The MIPSGAL team developed and used a BCD pipeline parallel to the Spitzer version. This alternate pipeline was necessary because the version (S14) of the Spitzer pipeline available when the MIPSGAL data was being processed contained errors in the linearity correction and pixel replacement modules. Our pipeline produces a product equivalent to the Spitzer-provided BCDs. We use the same flux conversion factor (0.0447 MJy sr-1DN-1 s) as the Spitzer pipeline. Significant artifacts were produced at 24 μm by the many bright sources imaged during each scan of the Galactic plane. In addition, the bright background level of the Galactic plane necessitated mitigation algorithms other than those recommended in the MIPS Data Handbook. The 24 μm BCDs were post-processed to remove and/or mitigate data artifacts not corrected in the basic pipeline. Details of the post-processing and BCD pipeline modifications are described in a companion paper (Mizuno et al. 2008). The 24 μm mosaic products are described in § 5.
To create image products at 70 μm, we use the Germanium Reprocessing Tools (GeRT)18 offline package (version 030623) developed by the Spitzer Science Center MIPS Instrument Support Team. The GeRT processing corrects for corrupted stimulator calibration flashes which are used to track responsivity changes. The most significant issue with the 70 μm data is the large, history-dependent responsivity variations of the Ge:Ga detectors when observing the bright and structured emission of the Galactic Plane. The variation in responsivity manifests itself as significant striping in the image data. This striping can introduce errors of ∼30% in photometry. For this reason, additional post-GeRT processing is performed to mitigate it. An additional contribution (at least of order 50%) to the error budget is due to flux nonlinearity effects that affect the 70 μm array for bright (≳100 MJy/sr; 2 Jy point source) signals. We are currently developing methods to mitigate both the response variations and the nonlinearity effects. A combination of gain correction by matching the data to scaled versions of the reprocessing of the IRAS 60 μm data (Improved Reprocessing of the IRAS Survey [IRIS]; Miville-Deschênes & Lagache 2005) and a ridgelet destriper have been applied to the data. Initial results are promising as shown in Figure 3. Some lower amplitude striping between scans still remains in the processed data. We anticipate releasing 70 μm image products by summer 2009.
Fig. 3.— Example of responsivity corrections and destriping applied to 70 μm data. The left panel is a composite of post-BCD mosaics from the Spitzer Science Center pipeline. The right panel is our enhanced version after processing using the GeRT and destriping of the 1.1° × 1.1° mosaic centered on l = 23°, b = +0.5°. Some scan-to-scan stripes still remain in the enhanced processed image.
A point-source catalog at 24 μm is currently in preparation (S. Shenoy et al. 2009, in preparation). We perform source extraction on the mosaics using a pipeline based on the Spitzer source-extraction software APEX19 (Makovoz & Marleau 2005). The point-response function (PRF) that we used consists of a core 35'' in radius derived directly from the mosaics grafted to the extended PRF used for the MIPS 24 μm calibration (Engelbracht et al. 2007). The selection and use of an appropriate background filter to remove the bright, diffuse Galactic emission is an important step for both source detection and extraction. Source detection and extraction are performed on the 24 μm mosaics. The mosaics were median-filtered using a box with width 13.75'' or ∼2.5 × FWHM of the MIPS 24 μm point-source function (PSF). This aggressive filtering facilitated source detection and source fitting by flattening the background. As this filtering removes some source flux, the fitted fluxes are scaled by the ratio of unfiltered photometry to filtered photometry as determined from a set of sources in low-background regions.
To verify the robustness of our point-source fitting, we examine the source-subtracted images. Figure 4 shows an example of a section of a 24 μm mosaic and the corresponding point-source removed image. We perform aperture photometry on the background-filtered, source-subtracted images and compare with that performed on the noise images. For sources where the ratio of residual to noise is between -5.0 and 5.0, the fits are good and the source-subtracted images show only the diffuse background emission. Most of the extended sources and saturated sources lie outside this range. They are then rejected from the final point-source catalog. Some faint, slightly extended sources will be included by these criteria; however, the majority of compact but not pointlike sources will be excluded. Initial analysis of the catalog data shows good source fits down to ∼2 mJy (≈3 σ rms); there are approximately 2.5 million sources in the MIPSGAL survey above 2 mJy. The point-source catalog will be made available to the astronomical community along with the source-subtracted mosaics once quality tests are finished. Some science examples derived from a preliminary catalog are discussed in § 6.
Fig. 4.— Example of point-source fitting and subtraction. The left panel is 10' × 10' at 24 μm centered on l = 30.241° and b = +07.05°. The right panel is the same field with the point sources contained in the catalog subtracted from the mosaic. The residuals for each of the subtracted sources are consistent with the noise in the mosaic. The moderately bright source in the lower left corner of the image is slightly extended and therefore is rejected as part of the point-source–fitting pipeline.
5. DATA PRODUCTS
The MIPSGAL team is producing a set of enhanced data products for use by the community. These products include artifact-corrected, high-fidelity image mosaics at 24 and 70 μm, a point-source catalog at 24 and 70 μm band-merged with the GLIMPSE point-source catalog, and point-source-removed images at 24 and 70 μm. The point-source-removed images should be useful in examining the diffuse emission in detail. By removing the power associated with point sources, power spectral density analysis and component inversion of the Galactic plane will be cleaner and interpretation down to small angular (and spatial) scales will be possible. In addition, extinction maps of IRDCs are more robust if foreground point sources are removed.
24 μm mosaics for all of the survey region are currently available. Figures 5, 6, and 7 display the currently released images. Figure 8 is a representative three-color (red, green, blue) composite of MIPSGAL 24 μm, and GLIMPSE 8 and 3.6 μm displaying the structure of the diffuse emission of the Galactic plane including the well-known supernova remnant, G11.2−0.3. Because the MIPS 24 μm resolution is a factor of 3 lower than GLIMPSE and the MIPS PSF has a pronounced second Airy ring, bright sources are surrounded by red halos in this image.
Fig. 5.— Mosaic of the 24 μm MIPSGAL mosaics for l > 10°. The black lines indicate ± 1° Galactic latitude. The white regions in the image are areas where the detectors have saturated and the data have been masked out. The image stretch is logarithmic from 5 to 500 MJy sr-1.
Fig. 6.— Mosaic of the 24 μm MIPSGAL mosaics for l < 350° in the fourth quadrant. The scaling of this image is the same as Figure 5.
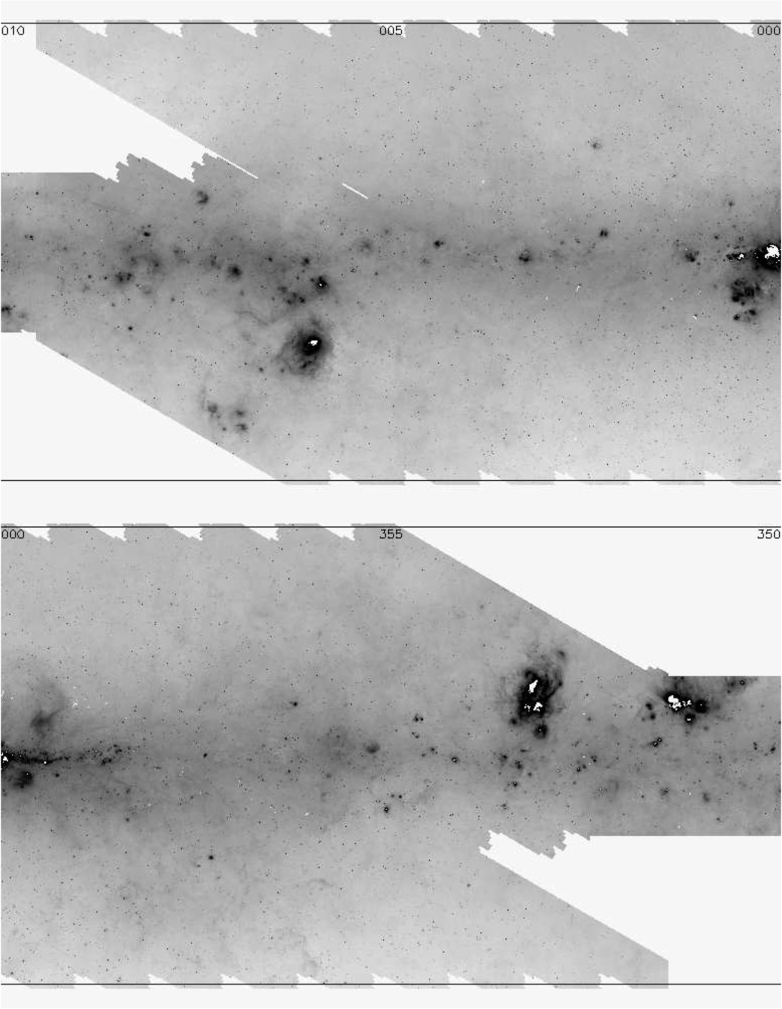
Fig. 7.— Mosaic of the 24 μm MIPSGAL mosaics for the 10° < l < -10°. The black lines indicate ± 3° Galactic latitude. The scaling of this image is the same as Figure 5.
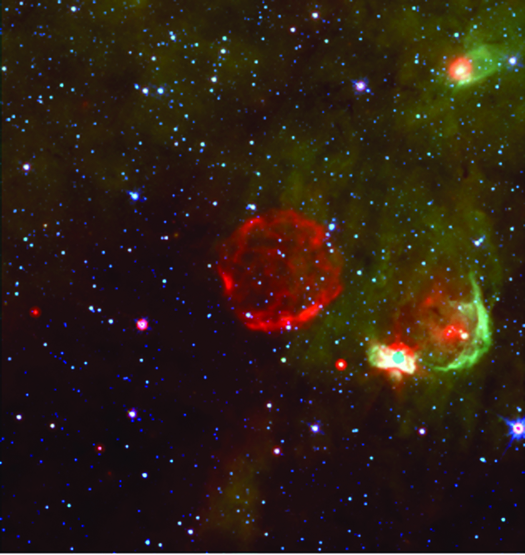
Fig. 8.— Example of diffuse emission in Galactic plane as seen by MIPSGAL and GLIMPSE. This 20' × 20', three-color composite is centered on the supernova remnant G11.−0.3. The 24 μm data are in red, GLIMPSE 8 μm in green, and 3.6 μm in blue.
Sections 5.1–5.7 describe the 24 μm mosaics in detail. The images are available through the NASA/IPAC (Infrared Processing and Analysis Center) Infrared Science Archive20, which provides an interface with coordinate and object searches as well as an image cutout service. The entire data release can also be downloaded from the Spitzer Science Center popular products Web site.21
5.1. Astrometric Accuracy
Unlike IRAC images, no pointing refinement is performed on the MIPS BCDs. The pointing accuracy of the mosaics is the result of the combined effect of the blind pointing accuracy of Spitzer (≲1'' rms) and the inability of the MIPS Cryogenic Scan Mirror Mechanism to return to the same zero point (∼0.5''). An assessment of the astrometric accuracy is given by matching positions of point sources in the 24 μm mosaics with the sources at 8 μm from the GLIMPSE Point Source Catalog.22 Figure 9 displays the offset between source matches at 24 and 8 μm. The median offset between 24 μm sources and their 8 μm counterparts is 0.85'', which is in keeping with the two effects mentioned previously. This offset is small compared to the FWHM of MIPS point sources but is more significant compared to the ∼2'' FWHM for point sources at 8 μm imaged by IRAC. GLIMPSE sources were matched by finding the nearest GLIMPSE source within a 5'' search radius. This search radius balances the need to have a large enough radius to identify any systematic pointing error in the MIPSGAL data set with reducing the number of spurious source matches. A straight positional association was used without a flux criterion because sources with widely varying spectral energy distributions are detected at both 24 and 8 μm. The estimated random matches as a function of distance between sources assuming an average source density of 33,225 sources per square degree for GLIMPSE is also plotted using a dashed line. The tail of the distribution between 1.5'' and 3'' is consistent with outliers from the combination of the errors in the initial acquisition slew and scan mirror zero point. We anticipate correcting the misregistration of the MIPSGAL data in a future version of the data products.
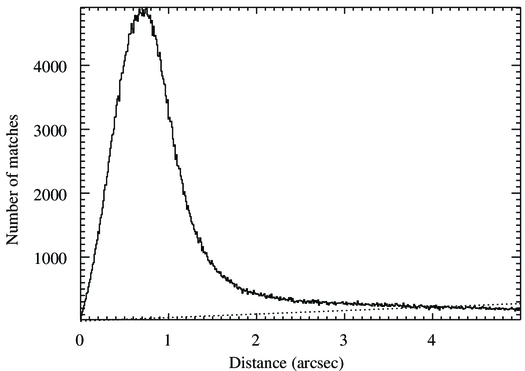
Fig. 9.— Histogram of the positional offset for a preliminary set of matches between sources detected in MIPSGAL and their GLIMPSE counterparts for 60 > l > 10°. The median offset is 0.85''. The dashed line is the number of expected random matches given the average GLIMPSE source density.
5.2. Photometric Accuracy
We checked the photometric accuracy of our data reduction by comparing the surface brightness of the data to MSX 21.3 μm measurements. Figure 10 displays the pixel-to-pixel correlation between MIPSGAL data smoothed to the same resolution as MSX 21.3 μm data of M16. Each data set was color-corrected using a correction appropriate for the ISM in a massive star-forming region such as M16 (Flagey 2007). The pixel-to-pixel relation is well matched by the relationship
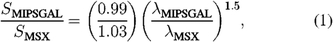
where SMIPSGAL and SMSX are the measured surface brightnesses, 0.99 and 1.03 are the color corrections, and λMIPSGAL and λMSX are the isophotal wavelengths of MIPS 24 μm and MSX Band E, respectively. The relationship is appropriate for the spectral energy distribution of dust in a massive star-forming region. The departure of the data from the model for MIPSGAL surface brightnesses starting at 1000 MJy sr-1 and more significantly for 1500 MJy sr-1 is most likely due to bright compact sources that will have a different spectral energy distribution than the ISM. At 1700 MJy sr-1, the plot clearly indicates that the MIPSGAL data are saturated. The turnover in the slope is due to regions that are saturated in MIPSGAL being compared to unsaturated MSX regions. The saturated MIPSGAL pixels are set to not-a-number (NaN), and when summed over the MSX resolution element (20'') the saturated pixels are ignored—resulting in a lower surface brightness for the MIPSGAL data.
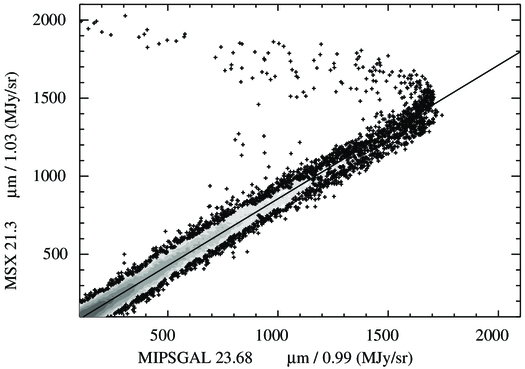
Fig. 10.— Pixel-to-pixel scatter plot of color-corrected MSX 21.3 μm surface brightness as compared to color-corrected 23.68 μm MIPSGAL surface brightness for the region around M16. The gray scale ranges from a density of 3 to 100 pixels in each 1 MJy sr-1 × 1 MJy sr-1 bin. Individual pixels are plotted outside the lowest density contour. The line is the relationship between the two data sets expected for emission from the ISM exposed to a radiation field from a high-mass star-forming region.
As a quick check of the point-source photometry that can be derived from the 24 μm mosaics, we measured the flux densities at 24 μm for 27 stars of known spectral types (K0III–K4III and A0V–A1V) and with flux densities from 2MASS and GLIMPSE. The stars were chosen to be in moderate to low structure background regions. The set is not comprehensive in nature and a more detailed analysis is in S. Shenoy et al. (2009, in preparation). The APEX source extractor was used on the mosaics in a manner similar to our source-extraction pipeline. The fit residuals were inspected by eye and were good for all of the sources despite a fair amount of background structure in the images. Figure 11 displays the 24 μm image of one of the stars used (HD 166290) and the residuals of the source fit.
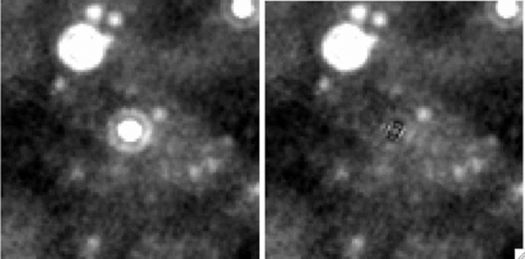
Fig. 11.— HD 166290 (left) and residual image at 24 μm after source fit (right). The image stretch is the same in both panels. The stripe pattern of the residual is due to the oversampling of the mosaic and the Poisson noise of the individual samples. The images are 2.1' × 2.1' in size.
We predicted the MIPSGAL flux densities for the stars using the GLIMPSE 8.0 μm measurement and a spectral template of a well-characterized star of the same spectral type. We measured the color differential (C[8 - 24]) between the predicted [8] - [24] color from the spectral standards and the measured [8] - [24] color from the MIPSGAL and GLIMPSE photometry. That is,

where ([8] - [24])s is the [8] - [24] color of the standard with the same spectral type and ([8] - [24])d is the [8] - [24] color measured from the data.
The spectral templates used were from Engelke et al. (2006) for the K0–K2 giants (except for K1III) and Cohen et al. (2003) for the A dwarfs, K1, K3, and K4 giants. Table 3 displays the template magnitudes for the spectral types used. In converting the flux densities to magnitudes, we used zero-magnitude flux densities of 64.13 Jy (Reach et al. 2005) and 7.17 Jy (Engelbracht et al. 2007) for [8.0] and [24.0], respectively. Figure 12 plots the color differential (C([8] - [24])) of the measured photometry compared to the model prediction for the 27 stars with spectral types corresponding to the available spectral templates and good photometry in MIPSGAL and GLIMPSE 8 μm. Most of the stars have photometry in good agreement with the models, although four stars have significant excesses (>0.2 mag) at 24 μm. Three of the excess stars are A dwarfs and most likely have debris disks. The fourth star, HD 168701, is an eclipsing variable with a secondary of unknown spectral type (Malkov et al. 2006). The average excess for the stars with C([8] - [24]) > -0.2 is +0.03. A comparable offset has also been noted by the Surveying the Agents of Galaxy Evolution (SAGE) Legacy team using a similar analysis.23 If the revised 24 μm calibration factor of Engelbracht et al. (2007) is used, then the excess is reduced to +0.01. In any event, the offset is within the cross-calibration error (5%) between IRAC and MIPS.
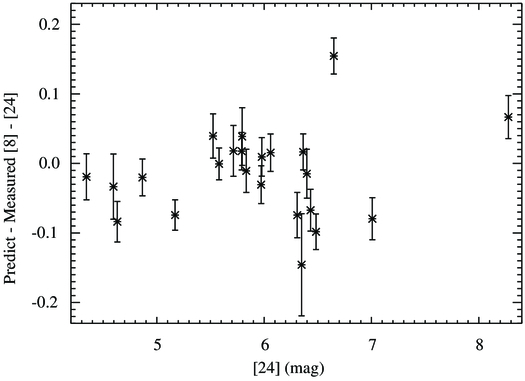
Fig. 12.— Measured [8] - [24] color to predicted [8] - [24] color differential for 27 A and K stars with well-determined spectral types and good measurements of the flux density at 8 and 24 μm. Four (which are not plotted in the figure) of the stars have color differentials of < -0.2 and are likely to have circumstellar dust.
 |
5.3. Asteroid Contamination
A portion of the data for |β| < 15° has been inspected for asteroids by differencing the multiple epoch data and looking for sources that are paired with a negative source in the difference mosaic. Figure 13 displays the difference image of two overlapping epochs of data. Several asteroids are visible in the difference image. The slight pointing offset between scan legs is also present as a positive-negative dipole residual for stationary point sources in the difference mosaic. Most of the offset is in the in-scan direction, while asteroid motion is in the cross-scan direction (which is roughly aligned with ecliptic longitude). The magnitude of the in-scan offset is typically a fraction of an arcsecond.
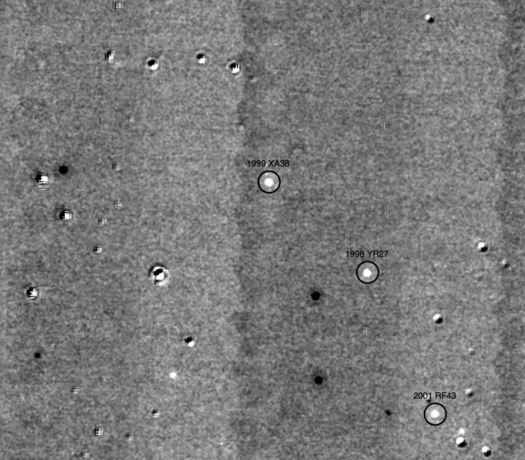
Fig. 13.— Difference image of two epochs of data. The image is centered on l = 9.54°, b = 0.94° and is 16' × 16' in size. Known detected asteroids are labeled. From top to bottom in the image, the asteroids are 199 XA38, 1998 YR27 and 2001 RF43.
At the present time, we have examined in detail 33.3 deg2 of the multiple-epoch–covered regions. There are 1189 single-epoch transient detections corresponding to 601 sources in the areas analyzed. Of these sources, 213 are objects in the Horizons24 solar system database. Unfortunately, 75% of the single-epoch objects remain in both the final mosaics and the current point-source catalog. A list of these sources and their positions will be made available as soon as the analysis is complete.
For β = 0°, ∼40 asteroids are detected per square degree. At the ecliptic latitude limit of our multiple-epoch data, β = 15°, there are ∼10 asteroids per square degree. If we make the overly conservative assumption that the asteroid number counts do not fall off with ecliptic latitude beyond β = 15°, then for the remaining 200 deg2 there should be at most 2000 unidentified asteroids in the mosaics for l > 15° and l < 350°. In the inner 16 deg2, the observations of PID 20414 did not employ a multiple-epoch observing strategy; therefore, asteroids have not been rejected in most of the Galactic center field and of the order of 600 asteroids probably remain in the mosaics of that field. Due to the overlap at the edges of AORs in PID 20414, some asteroid rejection has occurred in the Galactic center field. Users of the image and catalog products should be careful in interpreting sources that are detected only at 24 μm.
5.4. Mosaics
After preprocessing the BCDs (Mizuno et al. 2008), the MOPEX package (Makovoz et al. 2006) is used to generate the image plates. The mosaicking process resamples the BCDs onto a common sampling and projection. Outlier rejection is performed to remove radiation hits and other transients. The outlier rejection uses the median absolute deviation (MAD) to estimate the variance of the input data going into each output pixel. Data samples more than +5 or −3 σ above or below the median were omitted as outliers. The rejection was positively skewed to prevent flux from being removed in the wings of point sources. In the presence of Poisson noise, MAD will tend toward the lower pixel values for a distribution that is bimodal. The outlier rejection also removes some of the asteroids from the mosaics with multiple-epoch observations. For the brighter asteroids, the wings of the PSF below the thresholding are not rejected and have to be masked by hand. Currently, this masking is incomplete in the mosaic products.
The 24 μm mosaics are 1.1° × 1.1° in size and are spaced on 1° centers. The images are in units of surface brightness (MJy sr-1). A model of the Zodiacal light (Kelsall et al. 1998) has been subtracted from the input data before co-addition. Pixels without data contain IEEE floating point NaNs. Approximately 0.09% of the survey region is saturated and 0.03% is blanked out due the editing of bright source artifacts. The images are sampled on 1.25'' pixel centers. The image coordinates are Equatorial J2000 and a tangent projection is used in constructing the mosaic. A rotation angle is applied (nonzero CROTA2 keyword) such that the images are aligned in Galactic coordinates. This is strictly true for the center of each mosaic and holds true for all practical purposes for the entirety of each plate. The astrometric information is encoded in each mosaic header following the format recommendations of Calabretta & Greisen (2002).
The mosaic headers include information on the processing steps applied as well as a list of the AOR request keys contributing data to the mosaic. The number of AORs used in the mosaic is given by the NAOR keyword. The AOR request keys are provided by the AORKEY## keywords (where ## is an integer, 00, 01, 02, ...). The start time of each AOR used is contained in the AORTIM## keywords. The processing version of the mosaics in this delivery is noted in the keyword VERSION and is 1.1 for the l > 10° data and 1.2 for the l < 10° and fourth quadrant data. An example of a mosaic header is given in the
In addition to the astrometric and photometric keywords, including the flux conversion factor (FLUXCONV) and gain (GAIN), the mosaic headers include a set of Boolean flags to indicate whether various artifact-mitigation steps were performed on the input BCDs. Corrections for array droop, jailbars, dark latents, and bright latents (see Mizuno et al. 2008 for more details) are indicated by the DROOP, JAILBAR, DARKLAT, and BRITELAT keywords. Removal of a bias pattern in the BCDs is indicated by the WASHBRD keyword (as the bias pattern has a washboard appearance in the BCDs). Overlap correction is indicated by the OVERLAP keyword. Flagging of glints due to bright sources on the edge of the array and bright, known asteroids is indicated by the EDGEMASK and ASTRDMSK keywords.
The image header also includes various statistics such as the minimum and maximum data values, keywords DATAMIN and DATAMAX, respectively. The input pixel coverage statistics are included as are those for the coverage mosaics (see § 5.5). The number of pixels in the input BCDs that are hard saturated (BCD pixels that are saturated before the second sample in the data ramp) and percentage of mosaic pixels that are flagged as hard saturated are given in the keywords NHARDALL and PHARDSAT. The keywords NSOFTSAT and PSOFTSAT provide the analogous quantities for soft saturation (pixels that are saturated by the third sample in the data ramp).
5.5. Uncertainty Mosaics
As part of the mosaic process, uncertainty mosaics in units of surface brightness (MJy sr-1) are also generated. The uncertainty mosaic headers include the same astrometric information as the mosaics. The value of each pixel in the uncertainty mosaics is the standard deviation of the interpolated BCD pixels that are co-added into the output mosaic pixel divided by the square root of the coverage of the input BCD pixels. In general, the standard deviation is close to the weighted average of the BCD uncertainties for extended structures and background regions. Both the BCD uncertainties and the standard deviation of the pixel stacks are in accord with the Poisson-dominated noise as expected for the high backgrounds observed. For point sources, the standard deviation is several times higher than the noise estimate from the BCD uncertainties. The larger variance is due to the small astrometric misalignment between BCDs which blurs point sources slightly and contributes to the scatter in the values of the pixel stack.
5.6. Coverage Mosaics
The coverage mosaics indicate the number of input image pixels co-added for each mosaic pixel. The mosaicking procedure weights each input pixel by its area overlap with an output pixel; therefore, the coverage can include fractions of a pixel. On average, 12 input data samples contribute to each output mosaic pixel. The coverage is highly position dependent and varies from a nominal minimum of 9–10 up to 18–19 for the regions where edges of scans overlap. The coverage mosaics also include the same astrometric information as the image mosaics. The keywords COVRGMAX, COVGRMIN, and COVRGMN, give the minimum, maximum, and mean coverage of all pixels with nonzero coverage, respectively. NCOVREG0 provides the number of pixels with zero coverage.
5.7. Mask Mosaic Cubes
The mask cubes display the number of input samples that were flagged as problematic for each output mosaic pixel. None of the flagged samples were used to create the mosaics. Positions that have no good data are filled with NaN in the output mosaic. Therefore, the mask cubes are complementary to the coverage mosaics and indicate why the coverage for a given pixel is less than optimal. Seven states are indicated in the mosaic mask. The first plane indicates input pixels that are hard saturated. The second plane indicates BCD pixels that are affected by stray light from a bright source on the edge of or just off the array. The third plane flags input pixels that cannot be flat-fielded. The fourth plane displays pixels that have been edited out due to known asteroids or asteroids that were partially removed by the outlier rejection step for positions observed at multiple epochs. The fifth plane indicates data that are flagged as bad in the MIPS pmask (see the MIPS Data Handbook25 for more details). The sixth plane flags BCD pixels that are soft saturated. The final bit plane displays regions with missing input pixels due to downlink problems.
The mask cubes have the same astrometric information as the image mosaics. The photometry of regions with some saturated samples will probably be less reliable. Faint sources or structure in regions with known stray light should be investigated further to ensure their validity.
6. INITIAL RESULTS
We describe some initial results using the MIPSGAL data to provide examples of science that can be facilitated by this data set. The 24 and 70 μm data have already been used in identifying and measuring the properties of protostars in IRDCs (Beuther & Steinacker 2007), the protocluster IRAS 18511+0146 (Vig et al. 2007), and triggered star formation near the supernova remnant G54.1+0.3 (Koo et al. 2008). Several galaxies in the zone of avoidance have been identified by Jarrett et al. (2007) and Marleau et al. (2008). Robitaille et al. (2007) have investigated the variability of mid-infrared point sources using GLIMPSE, MIPSGAL, and MSX data. Fazal et al. (2008) have used the data in constructing the SEDs of 13 high-mass protostars, and Chapin et al. (2008) have constrained the SEDs of compact sources identified in the BLAST survey using the 70 μm data. Sections 6.1–6.5 provide additional examples.
6.1. Extinction at 70 μm
Figure 14 shows an IRDC, G11.11−0.11, at 24 and 70 μm. Extinction at 24 μm is commonly seen in these dense molecular cores; however, there had only been one previous measurement of extinction at longer wavelengths (Lis & Menten 1998), for the IRDC G0.26−0.01. That particular IRDC is near the Galactic center and has been considered atypical of the general population of IRDCs. We estimated the opacity for G11.11−0.11 by assuming that it is a simple extincting slab without a source function at 24 and 70 μm. The foreground emission is estimated to be 21% of the total along the line of sight, and the background is estimated by performing a planar fit of the surface brightness across the IRDC from the region around the cloud. The estimated peak opacity at 70 μm is 0.28 and is 1.1 at 24 μm. Using a gas-to-dust mass ratio of 1.05 and the Rv = 5.5 extinction law of Weingartner & Draine (2001), we derive a peak column density of 4.6 × 1022 cm-2 from the 24 μm opacity estimate. This finding confirms the previous estimates of column densities for this IRDC (Carey et al. 2000). The ratio of 70 to 24 μm opacity is 2.5× that predicted by the Weingartner & Draine (2001) model and is probably more consistent with the extinction produced by grain growth through aggregation and/or accretion of icy mantles (Ossenkopf & Henning 1994).
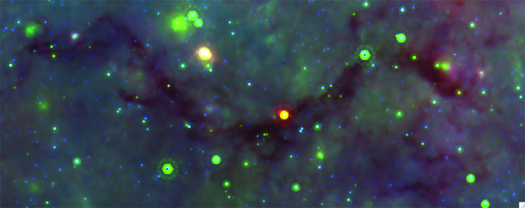
Fig. 14.— Three-color composite (8.0, 24.0, and 70 μm) of the IRDC G11.11−0.11. The image is 12' × 6.8'. Like many IRDCs, extinction is measurable out to 70 μm.
6.2. Star-Forming Columns
Figure 15 is a three-color image of two star-forming columns at l ∼ 60° identified in the MIPSGAL and GLIMPSE surveys. The columns are ∼30' east of the young stellar cluster NGC 6823. These columns are similar in morphology to the "pillars of creation" seen in M16 (Hester et al. 1996) and the "mountains of creation" in W5 (Allen et al. 2005). Star-forming columns and "elephant-trunk" globules are prevalent throughout the Galactic plane as noted in previous infrared surveys of the plane such as MSX. The 8 and 24 μm data show the expected presence of young stellar objects at the tips of the columns. Also seen at 24 μm are faint point sources in the middle of each pillar. These sources are much more apparent at 70 μm, suggesting that they are even younger protostellar objects. These observations support a scenario where star formation is ongoing in the pillar and not induced by the radiation pressure and winds from the nearby hot star at the pillar/wind boundary. Indebetouw et al. (2007) reached a similar conclusion for their study of M16. This scenario is in contrast to the recent result by Ubeda & Pellerin (2007), where the mid-infrared data support a triggered star-formation scenario. Many other cases of both revealed and triggered star formation are present in the MIPSGAL data set.
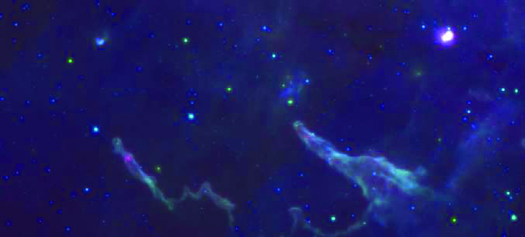
Fig. 15.— Three-color composite (8.0, 24.0, and 70 μm) of a 12.6' × 6.3' region around l = 60.05°, b = -0.25° displaying two star-forming pillars.
6.3. Supernova Remnants
A preliminary search for infrared counterparts to supernova remnants (SNRs) listed in Green (2006) has revealed nine counterparts out of the 30 candidates surveyed so far. Out of the nine, three objects have a low confidence level of detection yielding a conservative detection rate of 20% . This value is roughly similar to the rate reported for the GLIMPSE survey of Galactic supernova remnants (Reach et al. 2006) and six of the nine SNRs with 24 μm detections are also detected at 8 μm. As an example, we present in Figure 16 the infrared detection of the supernova remnant G27.4+0.0 (Kes 73), which is also known to have a compact X-ray source (Helfand et al. 1994). This particular object is shown at GLIMPSE 8 μm, MIPSGAL 24 and 70 μm, VGPS 21 cm (Stil et al. 2006), and MAGPIS 90 cm radio continuum (Helfand et al. 2006). The lack of emission at 8 μm and the faint glow at 70 μm suggests that its 24 μm detection is mostly due to nebular emission lines such as [O IV] (25.89 μm) and [Fe II] (25.99 μm) with a small contribution to the continuum emission from dust produced in the remnant. A portion of the 70 μm emission is possibly due to [O I] (63 μm). These observations and the recently revised age of 500–1000 years for Kes 73 (Tian & Leahy 2008) suggest that little dust has formed in this remnant which is in contrast with the results of Rho et al. (2008) for the Cas A SNR.
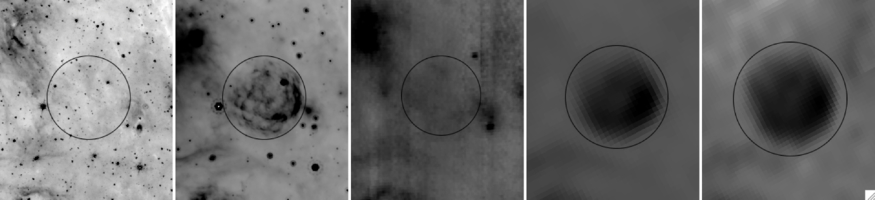
Fig. 16.— Left to right: The supernova remnant G27.4+0.0, also known as Kes 73, shown in the infrared at 8, 24, 70 μm and the radio continuum 21 cm and 90 cm data, respectively. Each panel is 9' × 9' in size.
6.4. 24 μm Compact Ring Sources
Small (< 1') ring and shell morphologies are pervasive through the Galactic plane in the mid-infrared. Over 100 of these objects have been identified in casual visual inspection of the MIPSGAL mosaic images. The density of small rings or shells is about 0.5 deg-2 in the inner Galaxy; however, their distribution is nonuniform. Some examples are shown in Figure 17. In general, these objects are smaller than the stellar wind-blown bubbles of Churchwell et al. (2006, 2007), but there is overlap between these two sets of sources.
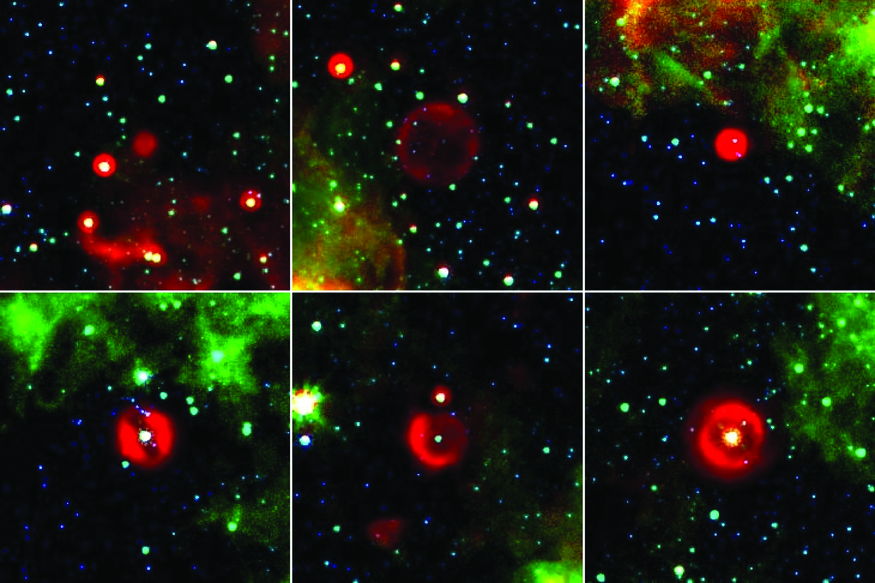
Fig. 17.— Three-color composite (3.6, 8.0, and 24 μm) images of six compact ring and shell sources identified in the MIPSGAL data. The top three bubbles have no central source. Only the lower-right hand source has a faint GLIMPSE counterpart. The remainder are not visible in the IRAC data. Each image is 5' × 5' in size.
Many of these objects are not apparent in 3.6–8.0 μm data from the GLIMPSE survey. It is impossible to tell without an infrared spectrum whether the absence of 8 μm emission is due to a lack of corresponding PAH and hotter dust emission if the 24 μm objects are dusty or the presence of 24 μm emission is due to line emission from ionized gas. The GLIMPSE and MIPSGAL sensitivities are well matched for ISM emission, so it is unlikely that an object with a standard ISM composition of dust grains would produce 24 μm emission without measurable emission at 8 μm.
The likely suspects for these objects are some type of evolved star; whether a low- or intermediate-mass AGB or a massive luminous blue variable (LBV), distant Wolf-Rayet star, or possibly a planetary nebulae. In MSX data, four candidate LBV stars had well-defined diffuse rings surrounding a point source (Egan et al. 2002; Clark et al. 2003) that are very similar in morphology to the MIPSGAL rings. The ring or bubble of emission in these cases would be from hot, small dust grains in the stellar winds and ejecta. Potentially, these blobs could comprise the "missing" massive evolved stars believed to be present in the Galaxy (Shara et al. 1999).
However, not all shells follow this paradigm. Morris et al. (2006) determined that a particular diffuse 24 μm-only blob consisted mainly of [O IV] line emission without continuum emission from dust. Their interpretation was that the source was most likely a distant SNR. If a significant fraction of the bubbles are similar to the Morris object, then it is quite likely there is a new and poorly understood class of supernova remnant.
6.5. Debris-Disk Candidates
We have searched for stars with infrared colors indicative of debris-disk candidates in a preliminary version of the MIPSGAL 24 μm point-source catalog for the longitude range 10° < l < 60°. Debris-disk candidates were identified by band-merging the MIPSGAL point-source catalog with the 2MASS and GLIMPSE catalogs. A simple positional association using a 3'' search radius was used. Sources with multiple associations between catalogs were dropped. We have used IRAC color-magnitude and color-color criteria to reject extragalactic contamination (Fazio et al. 2004b) including PAH-rich galaxies (Hernández et al. 2007). Only sources with 2MASS and IRAC colors representative of stellar photospheres, that is,

were considered. These color criteria select 16.3% (58,804 out of 360,038) of the band-merged point sources. 8454 sources with 0.6 < K - [24] < 3.3 are identified as debris-disk candidates. Future work will determine the distribution of these sources as a function of spectral type and age.
7. SUMMARY
We have presented the motivation, observing strategy, data products, and some representative preliminary science results for the MIPSGAL survey of the inner Galactic plane at 24 and 70 μm. This data set, when combined with other surveys of the Galactic plane from the near-IR to the millimeter, will provide insight on the mechanisms of massive star formation and greatly increase our understanding of the dust component of the interstellar medium. Additional data processing steps have been applied to mitigate data artifacts due to the bright sources and background of the Galactic plane. Enhanced data products such as point-source catalogs, point-source-removed images, and large low-resolution mosaics will be made available to the astronomical community. Full-resolution mosaics at 24 μm have already been released for the entire survey field and are available from IRSA.
This work is based on observations made with the Spitzer Space Telescope, which is operated by the Jet Propulsion Laboratory, California Institute of Technology, under a contract with NASA. Support for this work was provided by NASA through an award issued by JPL/Caltech. S. J. C. acknowledges support from a NASA Long Term Space Astrophysics grant. We thank the anonymous referee for helpful comments. This research made use of data products from the Midcourse Space Experiment. Processing of the MSX data was funded by the Ballistic Missile Defense Organization with additional support from NASA Office of Space Science. This publication makes use of data products from the Two Micron All Sky Survey, which is a joint project of the University of Massachusetts and the Infrared Processing and Analysis Center/Caltech, funded by NASA and the National Science Foundation. This research has also made use of the NASA/IPAC Infrared Science Archive, which is operated by the JPL/Caltech, under contract with NASA, NASA's Astrophysics Data System and the VizieR Catalogue access tool, CDS, Strasbourg, France. This research made use of Montage, funded by the NASA's Earth Science Technology Office, Computation Technologies Project, under Cooperative Agreement Number NCC5-626 between NASA and the California Institute of Technology. Montage is maintained by the NASA/IPAC Infrared Science Archive.
Online Material
- Figure 2
APPENDIX: SAMPLE 24 μm MOSAIC HEADER
SIMPLE = T / Written by IDL: Wed Aug 8 19:16:09 2007BITPIX = -32 / Bits per pixel- floating pointNAXIS = 2 / STANDARD FITS FORMATNAXIS1 = 3168 / Axis LengthNAXIS2 = 3168 / Axis LengthTELESCOP= 'Spitzer' / Spitzer Space TelescopeINSTRUME= 'MIPS' / Spitzer Space Telescope instrument IDCHNLNUM = 1 / This image: 1=24um, 2=70um,3=160umWAVELENG= 2.36800E-05 / [m] Isophotal wavelength of bandpassPROGID = 20597 / Program IDPROGRAM = 'MIPSGAL ' / A 24 & 70 um Survey of the Inner Galactic DiskOBSRVR = 'Sean Carey' / PIPROGID2 = 30592 / Program ID of extended survey MIPSGAL2FILENAME= 'MG0490p005_024.fits' / Name of this fileLPLATE = 49.0 / [deg] glon at plate centerBPLATE = 0.5 / [deg] glat at plate centerDATE_OBS= '2005-10-05T11:23:02.878' / Date & time at DCE startCRVAL1 = 289.886 / [deg] RA at CRPIX1,CRPIX2CRVAL2 = 14.4953 / [deg] DEC at CRPIX1,CRPIX2RADESYS = 'ICRS' / International Celestial Reference SystemEQUINOX = 2000. / Equinox for ICRS celestial coord. systemCTYPE1 = 'RA---TAN' / RA projection typeCTYPE2 = 'DEC--TAN' / DEC projection typeCRPIX1 = 1584.498948 / Reference pixel along axis 1CRPIX2 = 1584.498948 / Reference pixel along axis 2CDELT1 = -0.000347222 / [deg/pix] Scale for axis 1CDELT2 = 0.000347222 / [deg/pix] Scale for axis 2CROTA2 = 62.04949 / [deg] Orientation of axis 2 (W of N, +=CW)COMMENT Equatorial coordinate system is chosen to mimicCOMMENT the Galactic coordinate orientation.BUNIT = 'MJy/sr' / Units of image dataDATAMIN = 7.21248 / [MJy/sr] Minimum pixel valueDATAMAX = 2872.21 / [MJy/sr] Maximum pixel valueCOVRGMN = 12.7381 / mean # of BCDs/pixelCOVRGMAX= 21 / maximum # of BCDs/pixelCOVRGMIN= 1 / minimum # (>0) of BCDs/pixelNCOVRGE0= 697 / pixels with no coveragePCOVRGE0= 0.00694484 / pct pixels with no coveragePHARDSAT= 0.00485242 / pct pixels flagged as hard saturatedNHARDALL= 827 / # pixels with all BCDs hard sat'dPSOFTSAT= 0.0189015 / pct pixels flagged as soft saturatedNSOFTALL= 827 / # pixels with all BCDs soft sat'dEXPTIME = 2.62000 / [sec] t_int per pixel per BCDMEANEXP = 33.3763 / [sec] mean t_int per pixelGAIN = 5 / e/DN conversionFLUXCONV= 0.0447000 / DN/s to MJy/sr factorCOMMENT MOSAIC_INT Module Version 5.3 image createdCOMMENT Tue Apr 24 11:18:03 2007COMMENT MOSAIC_REINT Module Version 2.7 image createdCOMMENT Tue Apr 24 16:25:00 2007COMMENT MOSAIC_COADD Module Version 3.5 image createdCOMMENT Tue Apr 24 17:24:10 2007COMMENT MOSAIC_COMBINE Module Version 1.9 image createdCOMMENT Tue Apr 24 17:24:27 2007TOTALBCD= 2192 / Total number of BCD's used in this mosaicBCDLIST = 'MG0490p005_024.bcdlist' / file containing list of BCDsDROOP = T / Droop Correction AppliedOVERLAP = T / Overlap Correction AppliedJAILBAR = T / Jailbar Correction AppliedDARKLAT = T / Dark Latent Correction AppliedWASHBRD = T / Washboard Correction AppliedBRITELAT= T / Bright Latent Correction AppliedEDGEMASK= T / Edge-source Masking AppliedASTRDMSK= T / Asteroid Masking AppliedHISTORY Pre-mopex processing MIPSGAL BCD pipeline 1.0HISTORY and Artifact Correction pipeline 1.0; see Carey et al. 2007HISTORY and Mizuno et al. 2007, respectively, for details.HISTORY Zodiacal background estimate, included by the SSC in the BCDs & HISTORY based on the DIRBE model, is subtracted at the BCD level.HISTORY Delivery V1.1bNAORS = 14 / # of AORS used in mosaicAORKEY00= 15579392 / Astronomical Observation Request Key NumberAORTIM00= '2005-10-05T11:14:03.387' / AOR Start TimeAORKEY01= 15582208 / Astronomical Observation Request Key NumberAORTIM01= '2005-10-04T21:04:18.683' / AOR Start TimeAORKEY02= 15600128 / Astronomical Observation Request Key NumberAORTIM02= '2005-10-05T00:19:49.578' / AOR Start TimeAORKEY03= 15606784 / Astronomical Observation Request Key NumberAORTIM03= '2005-10-05T12:16:58.769' / AOR Start TimeAORKEY04= 15608320 / Astronomical Observation Request Key NumberAORTIM04= '2005-10-04T23:16:54.196' / AOR Start TimeAORKEY05= 15609088 / Astronomical Observation Request Key NumberAORTIM05= '2005-10-05T01:22:42.863' / AOR Start TimeAORKEY06= 15610112 / Astronomical Observation Request Key NumberAORTIM06= '2005-10-05T09:01:23.679' / AOR Start TimeAORKEY07= 15614976 / Astronomical Observation Request Key NumberAORTIM07= '2005-10-04T20:01:25.398' / AOR Start TimeAORKEY08= 15615232 / Astronomical Observation Request Key NumberAORTIM08= '2005-10-05T05:45:48.588' / AOR Start TimeAORKEY09= 15616512 / Astronomical Observation Request Key NumberAORTIM09= '2005-10-05T06:48:43.971' / AOR Start TimeAORKEY10= 15620864 / Astronomical Observation Request Key NumberAORTIM10= '2005-10-05T13:19:56.249' / AOR Start TimeAORKEY11= 15633920 / Astronomical Observation Request Key NumberAORTIM11= '2005-10-05T10:04:19.061' / AOR Start TimeAORKEY12= 15645696 / Astronomical Observation Request Key NumberAORTIM12= '2005-10-05T07:58:28.297' / AOR Start TimeAORKEY13= 15648000 / Astronomical Observation Request Key NumberAORTIM13= '2005-10-04T22:07:11.967' / AOR Start TimeVERSION = 1.10000 / Version of 24 micron mosaic END
Footnotes
- 13
Principle investigators are identified to facilitate searching and retrieval of data from these programs using the interface to the Spitzer data archive. In addition, users can query data using the Legacy option with the Leopard tool.
- 14
GLIMPSE data are available online at http://irsa.ipac.caltech.edu/data/SPITZER/GLIMPSE.
- 15
The Spitzer Observer's Manual can be found online at http://ssc.spitzer.caltech.edu/documents/SOM/.
- 16
See http://ssc.spitzer.caltech.edu/propkit/spot/ for this software.
- 17
MIPSGAL is online at http://mipsgal.ipac.caltech.edu.
- 18
The GeRT package is available online at http://ssc.spitzer.caltech.edu/mips/gert/.
- 19
Link to the APEX site from http://ssc.spitzer.caltech.edu/postbcd/mopex.html.
- 20
To view these images, go to http://irsa.ipac.caltech.edu/data/SPITZER/MIPSGAL/.
- 21
These products are available online at http://data.spitzer.caltech.edu/popular/mipsgal/.
- 22
The GLIMPSE Point Source Catalog can be found online at http://data.spitzer.caltech.edu/popular/glimpse/20070416_enhanced_v2/source_lists/.
- 23
The SAGE Data Description is available from the STScI online at http://sage.stsci.edu/SAGE_SSCdatadocument_v5.pdf.
- 24
Horizons data are available online at http://ssd.jpl.nasa.gov/?horizons.
- 25
The MIPS Data Handbook is found online at http://ssc.spitzer.caltech.edu/mips/dh/.