


ABSTRACT
To ascertain the nature of the brightest compact mid-infrared (mid-IR) sources in the Large Magellanic Cloud (LMC), we have applied an updated version of Buchanan et al.'s Two Micron All Sky Survey (2MASS)–Midcourse Space Experiment (MSX) color classification system, which is based on the results of Spitzer Space Telescope spectroscopy, to a mid-IR (8 μm) flux-limited sample of 250 LMC objects for which 2MASS and MSX photometry is available. The resulting 2MASS–MSX ("JHK8") color-based classifications of these sources, which constitute the most mid-IR-luminous objects in the LMC, were augmented, cross-checked, and corrected where necessary via a variety of independent means, such that only 46 sources retain tentative classifications and only 10 sources cannot be classified at all. The sample is found to consist primarily of carbon-rich asymptotic giant branch (AGB) stars (35%), red supergiants (RSGs) (18%), and compact H ii regions (32%), with additional, small populations of oxygen-rich AGB stars (∼5%), dusty, early-type emission-line stars (∼3%), and foreground, O-rich AGB stars in the Milky Way (∼3%). The very large ratio of C-rich to O-rich objects among the luminous and heavily dust-enshrouded AGB stars in our LMC IR source sample is consistent with the hypothesis that carbon stars form easily in lower metallicity environments. We demonstrate that very luminous C-rich and O-rich AGB stars and RSGs, identified here primarily on the basis of their JHK8 colors, also appear as distinct clusters in Spitzer Infrared Array Camera (IRAC)/Multiband Imaging Photometer for Spitzer (MIPS) color–color diagrams. Thus, in principle, the infrared spectrograph (IRS)-based IR photometric classification techniques applied here to the LMC can be applied to any external galaxy whose most luminous IR point sources are detectable and resolvable by 2MASS and Spitzer.
Export citation and abstract BibTeX RIS
1. INTRODUCTION
The very late evolutionary stages of stars of initial mass ≳1 M☉—and both the very early and the very late evolutionary stages of high-mass (≳10 M☉) stars—are characterized by high luminosities and obscuration by thick, dusty circumstellar envelopes that absorb photospheric emission and re-radiate this emission strongly in the mid-infrared (mid-IR) to far-infrared. Such objects should dominate the mid-IR point-source populations of nearby, external galaxies. Indeed, in the era of the Spitzer Space Telescope, individual rapidly mass-losing evolved stars and massive young stellar objects have now been detected, en masse, throughout the Local Group (e.g., Blum et al. 2006; Jackson et al. 2006, 2007; Cannon et al. 2006).
Because of its relative proximity and its large stellar populations located at an essentially uniform distance, the Large Magellanic Cloud (LMC) is a particularly fruitful subject for studies intended to characterize these short-lived, IR-luminous stellar populations. Infrared Astronomical Satellite (IRAS) and Infrared Space Observatory (ISO) mid-IR surveys of the LMC (e.g., Loup et al. 1997; van Loon et al. 1999a; Trams et al. 1999) demonstrate that the most highly evolved (dustiest) intermediate-mass (asymptotic giant branch; AGB) and high-mass (red supergiant; RSG) stars are plentiful, perhaps dominant, among the luminous IR point-source membership of the LMC. Because such rapidly mass-losing AGB and RSG stars dominate the rate of return of nuclear-processed material to the interstellar medium (ISM), these objects play especially important roles in the chemical evolution of galaxies. Such stars also represent key tests of stellar evolution theory. Even before the advent of major mid-IR space missions, the LMC's AGB star populations served as litmus tests for models of, e.g., shell burning and carbon star production (Iben & Renzini 1983).
With the publication of the initial results of the Spitzer (Werner et al. 2004) Infrared Array Camera (IRAC) and Multiband Imaging Photometer for Spitzer (MIPS) imaging survey of the LMC ("Survey of the Agents of a Galaxy's Evolution" [SAGE]; Meixner et al. 2006), broadband IR photometry at wavelengths of 3.6, 4.5, 5.8, 8.0, and 24 μm is now available for over 30, 000 mass-losing evolved stars in the LMC (Blum et al. 2006). For most of these objects, the SAGE IRAC/MIPS photometry can be used to distinguish between, e.g., RSGs and AGB stars, and even between oxygen-rich and carbon-rich AGB stars. However, the most dust-obscured and hence most luminous IR sources in the LMC cannot be readily classified—e.g., as C-rich versus O-rich AGB stars or even as young planetary nebulae (PNs) versus compact H ii regions associated with massive pre-main-sequence stars—solely on the basis of SAGE colors (Blum et al. 2006).
For these, the most mid-IR luminous LMC sources, two predecessor IR surveys—the Two Micron All Sky Survey (2MASS) and the LMC survey conducted by the Midcourse Space Experiment (MSX)—have previously provided photometry in the wavelength range 1.2–8.3 μm. Egan et al. (2001; hereafter EVP01) compared the A (8.3 μm) band magnitudes obtained from the MSX survey of the LMC with J (1.25 μm), H (1.65 μm), and K (2.17 μm) magnitudes obtained from 2MASS. They identified 11 categories of stellar populations among the resulting sample of 1664 objects. EVP01 cross-checked their classifications of objects believed to reside in the LMC using spectral-type data obtained from the SIMBAD database; however, very few of the most IR-luminous (therefore most highly optically obscured) objects had classifications listed in SIMBAD.
The use of IR spectra alleviates most of the ambiguity that results from assigning stellar classes based on IR photometry alone (e.g., Groenewegen et al. 1995; van Loon et al. 1998b; Trams et al. 1999). The spectroscopic validation and refinement of IR-color-based classification systems necessary to interpret the large volume of photometric data flowing out of SAGE and other Spitzer imaging surveys of Local Group galaxies are made possible by the Spitzer Infrared Spectrograph (IRS; Houck et al. 2004, 8). Several Spitzer IRS surveys of the LMC have been carried out, most of these aimed at its evolved star populations (e.g., Buchanan et al. 2006; Zijlstra et al. 2006; Groenewegen et al. 2007; Matsuura et al. 2006; Speck et al. 2006; Stanghellini et al. 2007).
Buchanan et al. (2006), hereafter Paper I, conducted a Spitzer spectroscopic study of a sample of the most luminous 8 μm sources in the LMC. These sources were chosen from the EVP01 2MASS–MSX catalog with the expectation (indeed, bias) that the sample would be dominated by highly evolved, rapidly mass-losing stars. The IRS spectra covered the wavelength range of 5–35 μm, allowing the determination of evolved star envelope chemistries through identification of spectral signatures of C-rich and O-rich dust. The IR luminosities and evolutionary status of the objects were derived from the combined 2MASS, IRS, and (where available) IRAS spectral energy distributions (SEDs).
Among the sample of 60 objects studied in Paper I, we identified 16 C-rich AGB stars, 4 O-rich AGB stars, 21 RSG stars, and 2 OH/IR stars (one supergiant and one AGB star). This sample also included 11 H ii regions—presumably very young O or early B stars that are deeply embedded in their nascent, dusty, molecular clouds—as well as 2 B supergiants with peculiar mid-IR spectra suggestive of the presence of circumstellar disks (Kastner et al. 2006). We were thus able to establish a revised set of classifications of luminous 8 μm LMC sources on the basis of the IRS spectra, IR SEDs, and IR luminosities of the Paper I sources. In particular, all of the objects that EVP01 classified as PNs were reclassified as H ii regions, most objects classified by EVP01 as OH/IR stars were reclassified as C-rich AGB stars, and objects classified by EVP01 as O-rich AGB stars were reclassified as either RSGs or (in a handful of cases) foreground, mass-losing, O-rich AGB stars (Mira variables) in the halo of the Milky Way. These results led to a revised 2MASS–MSX (J, H, K, A band, i.e., 1.25, 1.65, 2.2, 8.3 μm) color–color and color–magnitude classification scheme—hereafter referred to as the "JHK8" scheme—for luminous 8 μm sources in the LMC (Paper I). The JHK8 color–color classification scheme, being distance independent, is in principle applicable to any studies of Galactic or extragalactic IR source populations that make use of combined near-IR and 8 μm photometry.
The LMC IRS sample in Paper I was selected to cover representative subsets of the types of luminous 8 μm sources in the LMC, but not their relative numbers. Therefore, this study is not proportionally representative of the luminous mid-IR stellar populations of the LMC. Here, we revisit the entire sample of luminous 8 μm sources in the EVP01 lists to reclassify these objects on the basis of the JHK8 color criteria in Paper I (revised so as to account for updates to the 2MASS and MSX photometry), as well as information available in the literature and in the Spitzer IRS archive. We thereby determine the distribution of IR spectral types among a complete, 8 μm flux-limited sample of IR sources, so as to elucidate the nature of the most mid-IR-luminous objects in the LMC. We then examine these results in light of SAGE point-source photometry obtained for the most luminous mid-IR sources in the LMC.
2. THE SAMPLE
We began with all 1664 objects from the sample compiled by EVP01 that were identified in both the MSX and the 2MASS surveys. In order to study the same population sampled for the Paper I Spitzer/IRS spectral study, we applied the same 8.3 μm mag limit, A ⩽ 6.5 or F8.3 ⩾ 150 mJy (based on the MSX photometric calibration cited in EVP01). Imposition of this limit eliminates ∼70% of the EVP01 sample. Objects that EVP01 classified as main-sequence stars ("MS(V)") were then discarded, on the grounds that these objects are neither evolved nor in the LMC. Those objects that EVP01 classified as M III and A − K III and have J ≲ 7.5 were assumed to be giants residing in the halo of the Milky Way and were therefore also rejected. The objects MSX LMC 140, 421, 946, 1046, 1080, 1270, 1419, 1734, 1752, 1015, and 1049 were not designated as either M III or A − K III stars by EVP01 but were classified as "star" or "M star" in the SIMBAD database. Given that the locations of these objects within 2MASS/MSX color–color diagrams are indicative of photospheric rather than dust emission, these objects are also most likely foreground, first-ascent red giants and were thus discarded. In addition, on the basis of updated 2MASS positions, we find that the EVP01 sources MSX LMC 470, 505, 585, and 1107 likely had spurious 2MASS associations.
The final sample considered here then consists of 250 objects (Table 1). As the MSX and 2MASS photometric catalogs have been revised since publication of EVP01, we used the Infrared Science Archive (IRSA)'s gator tool9 to compile the most recent available (2007 June) MSX and 2MASS photometry for these 250 sources. We find that the (version 6) MSX A-band magnitudes presently available via gator are typically ∼30–50% brighter than the (version 5) A-band magnitudes listed in EVP01; this discrepancy does not affect the fundamental results presented here (see below and Section 5). For the vast majority of the 2MASS data, the changes are on the order of ∼1% or less, the exceptions being the small fraction of Table 1 objects for which the 2MASS data available to EVP01 evidently suffered from source confusion or data reduction problems.
Table 1. Objects in the A-Band Flux-Limited 2MASS/MSX Sample
| Classification | ||||||||||||
|---|---|---|---|---|---|---|---|---|---|---|---|---|
| LMC MSX Number (1) | SIMBAD Namea (2) | Typea (3) | Jb mag. (4) | Hb mag. (5) | Kb mag. (6) | A mag. (7) | EVP01 (8) | Paper I (9) | Col–Colc (10) | Classd (11) | LIR L☉ (12) | Ref(s) (13) |
| 7 | IRAS 05095-6525 | IR | 8.83 | 8.06 | 7.69 | 6.17 | RSG | ... | RSG | RSG | 8.2 × 10⁴ | |
| 21 | IRAS 05053-6659 | IR | 15.58 | 14.55 | 13.58 | 5.80 | PN | ... | H ii | H ii | ... | |
| 22 | IRAS 05047-6644 | IR | 14.10 | 13.75 | 12.96 | 5.77 | PN | H ii | H ii | H ii | 6.8 × 10⁴e | |
| 43 | HV 888 | M4Ia V* | 8.01 | 7.19 | 6.78 | 5.13 | O AGB | ... | RSG | RSG | 1.9 × 10⁵ | |
| 44 | IRAS 05112-6755 | * | 16.41 | 14.07 | 11.69 | 5.28 | OH/IR | ... | C AGB | C AGB | 2.4 × 10⁴ | 1 |
| 45 | IRAS 05108-6839 | IR | 16.29u | 14.56 | 11.74 | 5.49 | OH/IR | ... | C AGB: | C AGB | 2.0 × 10⁴ | 2 |
| 46 | LHA 120-N 17A | EmO | 16.15 | 14.13 | 12.35 | 5.95 | OH/IR | ... | H ii? | ... | 3 | |
| 47 | 17.72u | 14.77 | 12.49 | 6.00 | OH/IR | ... | C AGB: | C AGB | 1.3 × 10⁴ | 2 | ||
| 48 | 18.03u | 15.33 | 12.83 | 6.02 | OH/IR | ... | C AGB: | C AGB? | 1.2 × 10⁴ | |||
| 80 | EQ 051005.7-685634 | IR | 15.22 | 14.89 | 13.07u | 3.83 | ... | ... | H ii | ... | 4 | |
| 83 | IRAS 05091-6904 | IR | 15.01 | 12.50 | 10.58 | 5.27 | OH/IR | ... | C AGB | C AGB | 2.5 × 10⁴ | |
| 87 | 14.63 | 12.73 | 11.10 | 6.05 | OH/IR | C AGB | C/O AGB | C AGB | 1.1 × 10⁴e | 5 | ||
| 91 | LI-LMC 372 | IR | 16.39u | 15.56 | 12.87 | 5.98 | OH/IR | ... | C AGB: | C AGB | 1.3 × 10⁴ | 2 |
| 95 | 13.40 | 11.53 | 10.02 | 6.23 | C IR | C AGB | C AGB | C AGB | 1.4 × 10⁴e | |||
| 108 | IRAS 05113-6939 | IR | 15.30 | 12.91 | 11.01 | 5.71 | OH/IR | ... | C AGB | C AGB | 1.6 × 10⁴ | |
| 134 | HD 269006 | ?p Em* | 10.67 | 10.64 | 10.55 | 5.22 | H ii | ... | B[e]?i | ... | 2 | |
| 138 | 15.87 | 13.40 | 11.28 | 5.74 | OH/IR | ... | C AGB | C AGB | 1.6 × 10⁴ | |||
| 141 | WOH S 156 | M* | 8.83 | 8.00 | 7.64 | 6.12 | RSG | RSG | RSG | RSG | 9.2 × 10⁴e | |
| 196 | IRAS 05125-7035 | IR | 18.04u | 16.77u | 14.52 | 5.28 | OH/IR | ... | C AGB | 1.8 × 10⁴ | 2 | |
| 198 | HD 269211 | N* | 13.97 | 13.84 | 13.48 | 5.84 | H ii | ... | H iif | H ii | ... | |
| 202 | 18.06u | 15.92 | 13.07 | 6.30 | OH/IR | ... | C AGB: | C AGB | 9.4 × 10³ | 2 | ||
| 215 | LHA 120-N 113A | EmO | 14.71 | 14.16 | 12.27u | 4.29 | PN | ... | H ii: | H ii | ... | |
| 216 | 11.36 | 10.84 | 9.80u | 5.64 | PN | ... | O AGB: | O AGB? | ... | |||
| 217 | IRAS 05137-6914 | IR | 14.86 | 14.27 | 13.40 | 5.61 | PN | H ii | H ii | H ii | 8.1 × 10⁴e | |
| 218 | 14.65 | 12.74 | 11.01 | 5.86 | OH/IR | C AGB | C/O AGB | C AGB | 1.3 × 10⁴e | 5 | ||
| 219 | 15.61u | 14.69u | 13.14 | 6.14 | ... | ... | H ii: | C AGB | 1.1 × 10⁴ | 2, 6 | ||
| 220 | 14.93 | 12.74 | 10.99 | 5.90 | C IR | C AGB | C AGB | C AGB | 1.6 × 10⁴e | |||
| 221 | 16.13u | 14.91 | 12.74 | 6.23 | OH/IR | ... | C AGB: | C AGB | 9.5 × 10³ | 2 | ||
| 222 | 14.79u | 15.16 | 13.90u | 6.22 | PN | H ii | H ii | H ii | 3.8 × 10⁴e | |||
| 223 | LI-LMC 623 | IR | 17.81u | 15.68u | 13.36 | 5.88 | OH/IR | ... | C AGB | 1.3 × 10⁴ | 2, 6 | |
| 224 | HD 269227 | WN WR* | 9.40 | 8.54 | 8.12 | 6.08 | ... | ... | RSG | WR? | ... | 3 |
| 225 | 17.99u | 16.74u | 13.43 | 6.09 | OH/IR | ... | C AGB | 1.2 × 10⁴ | 2 | |||
| 262 | HD 34664 | B0Iab:e Em* | 10.37 | 9.75 | 8.46 | 4.27 | PN | ... | C:/O: AGB | B[e] | ... | 3, 7 |
| 263 | HV 2360 | M2Ia V* | 8.78 | 7.98 | 7.59 | 5.44 | ... | RSG | RSG | 9.0 × 10⁴ | ||
| 264 | HV 916 | M3Iab: V* | 8.64 | 7.78 | 7.42 | 5.62 | RSG | RSG | RSG | RSG | 1.1 × 10⁵e | |
| 283 | IRAS 05128-6455 | * | 14.55 | 12.83 | 11.28 | 5.89 | ... | ... | O AGB | ... | 1, 2 | |
| 307 | IRAS 05190-6748 | * | 18.21u | 15.91u | 13.10 | 6.12 | OH/IR | ... | C AGB: | C AGB | 1.1 × 10⁴ | 2, 6 |
| 318 | IRAS 05195-6911 | IR | 16.10 | 14.45 | 12.86 | 5.09 | ... | ... | H ii | ... | 8 | |
| 320 | LI-LMC 810 | IR | 15.90 | 15.05u | 14.25u | 5.42 | H ii | ... | H ii | H ii? | ... | |
| 321 | AGPRS J051904... | V* | 13.33 | 11.83u | 10.61u | 5.53 | ... | ... | U | ... | ||
| 322 | 15.91u | 15.31u | 13.27 | 5.81 | ... | ... | U | ... | ||||
| 323 | ARDB 184 | A0:Iab: Em* | 12.22 | 11.71 | 10.52 | 5.82 | PN | ... | B[e] | ... | 3 | |
| 325 | 15.91 | 13.38 | 11.43 | 6.07 | OH/IR | ... | C AGB | C AGB | 1.1 × 10⁴ | |||
| 341 | 17.49u | 15.92 | 13.15 | 6.11 | OH/IR | ... | C AGB: | C AGB | 1.1 × 10⁴ | 2 | ||
| 344 | HD 35231 | ?... V* | 10.18 | 9.37 | 8.89 | 5.72 | ... | ... | U | ... | ||
| 349 | 17.44u | 16.88u | 14.82 | 6.20 | OH/IR | ... | C AGB | 8.2 × 10³ | 2, 6 | |||
| 356 | 15.43 | 14.75 | 14.67 | 5.30 | H ii | ... | H iif | H ii | ... | |||
| 357 | 14.63 | 12.57 | 10.90 | 5.57 | OH/IR | ... | C AGB | C AGB | 1.9 × 10⁴ | |||
| 358 | [BE74] 560 | Em* | 16.04 | 15.21u | 14.88 | 5.45 | H ii | ... | H iif | H ii | ... | |
| 359 | LHA 120-N 117 | EmO | 14.35 | 13.97 | 13.33 | 5.64 | H ii | ... | H ii | H ii | ... | |
| 360 | IRAS 05197-6950 | IR | 13.77 | 13.58 | 13.07 | 5.54 | H ii | ... | H ii | H ii | ... | |
| 362 | ZZ Men | M3 sr* | 8.52 | 7.50 | 7.12 | 5.89 | O AGB | ... | RSG/GMV | GMVg | ... | 3 |
| 398 | IRAS 05182-7117 | IR | 14.79 | 14.57 | 13.91 | 5.92 | H ii | ... | H ii | H ii | ... | |
| 412 | RS Men | Me Mi* | 6.58 | 5.72 | 5.26 | 4.55 | O AGB | GMV | GMV | GMV | 6.0 × 10³e | |
| 420 | 15.07 | 12.94 | 11.04 | 5.97 | OH/IR | ... | C AGB | C AGB | 1.3 × 10⁴ | |||
| 435 | LI-LMC 986 | IR | 15.14u | 14.08 | 11.91 | 4.91 | OH/IR | ... | C AGB: | C AGB? | 3.3 × 10⁴ | |
| 436 | 15.50u | 14.54 | 12.47 | 5.64 | OH/IR | ... | C AGB: | C AGB? | 1.7 × 10⁴ | |||
| 438 | LI-LMC 1028 | IR | 15.00 | 12.76 | 10.73 | 5.78 | OH/IR | C AGB | C AGB | C AGB | 1.1 × 10⁴e | |
| 441 | 17.16u | 16.44u | 14.48 | 6.17 | ... | ... | C AGB | 9.5 × 10³ | 6 | |||
| 461 | LHA 120-N 132E | EmO | 8.36 | 7.38 | 6.81 | 5.01 | O AGB | ... | RSG/GMV | H ii? | ... | 3 |
| 464 | [HS66] 272 | OpC | 14.24 | 12.51 | 11.06 | 5.48 | OH/IR | ... | H ii? | ... | 3 | |
| 465 | IRAS 05253-6830 | IR | 13.25u | 13.93 | 13.80 | 5.47 | H ii | ... | H iif | H ii | ... | |
| 466 | 18.07u | 17.15u | 14.46 | 5.77 | OH/IR | ... | U | ... | ||||
| 467 | 15.49 | 14.99 | 14.98 | 5.95 | H ii | ... | H iif | H ii? | ... | |||
| 468 | BSDL 1469 | As* | 15.65 | 15.16 | 14.62 | 6.16 | H ii | ... | H ii | H ii | ... | |
| 469 | 15.96 | 15.18 | 14.89 | 6.34 | H ii | ... | H ii: | H ii | ... | |||
| 500 | LI-LMC 861 | * | 13.00 | 12.02 | 10.46 | 3.56 | ... | ... | H iif | H ii | ... | |
| 501 | NGC 1936 | ?e... EmO | 16.03 | 14.51 | 12.47 | 4.60 | OH/IR | ... | H ii | ... | 3 | |
| 502 | IRAS 05230-6807 | IR | 13.79u | 13.63u | 14.23 | 5.20 | H ii | ... | H ii?f | H ii? | ... | |
| 503 | 14.84 | 14.42 | 13.62 | 5.82 | PN | ... | H ii | H ii | ... | |||
| 506 | BSDL 1474 | Neb | 9.98 | 9.16 | 8.90 | 6.23 | ... | ... | RSG | RSG? | 2.7 × 10⁴: | |
| 507 | 14.24 | 13.37 | 13.07 | 6.13 | H ii | ... | H ii: | H ii? | ... | |||
| 522 | 14.66 | 14.36 | 12.78u | 6.04 | PN | ... | H ii: | H ii | ... | |||
| 529 | HV 12793 | M3/M4 V* | 9.01 | 8.13 | 7.74 | 5.77 | RSG | RSG | RSG | RSG | 7.9 × 10⁴e | |
| 549 | NGC 1948 WBT 54 | *iC | 9.38 | 8.36 | 7.88 | 5.77 | O AGB | RSG | RSG | RSG | 7.9 × 10⁴e | |
| 551 | GRRV 43 | M4 V* | 9.19 | 8.38 | 8.03 | 6.08 | ... | ... | RSG | RSG | 6.0 × 10⁴: | |
| 558 | HV 2595 | M1 Ia V* | 8.45 | 7.78 | 7.45 | 5.29 | ... | ... | RSG | RSG | 1.0 × 10⁵ | |
| 559 | [HCB95] LH 52 4978 | UV | 14.25 | 13.57 | 12.38 | 5.76 | PN | H ii | H ii | H ii | 2.0 × 10⁵e | |
| 560 | IRAS 05300-6651 | * | 16.90u | 14.80 | 12.25 | 5.81 | OH/IR | ... | C AGB | C AGB | 1.6 × 10⁴ | |
| 561 | IRAS 05293-6715 | PN | 14.59 | 12.19 | 10.26 | 5.94 | OH/IR | ... | C AGB | PN | ... | 3, 9 |
| 562 | KMHK 915 | Cl* | 12.42 | 11.90 | 10.80 | 6.00 | PN | ... | H ii? | ... | 3 | |
| 563 | NGC 1974 | Cl* | 13.74 | 13.86 | 13.88 | 6.23 | H ii | ... | H iif | H ii | ... | |
| 581 | 14.72 | 13.88 | 11.94u | 4.10 | ... | ... | H iif | H ii | ... | |||
| 582 | [BE74] 292 | Em* | 12.82 | 12.71 | 12.60 | 4.08 | H ii | ... | H iif | H ii | ... | 3 |
| 585 | HD 269551 | B Em* | 7.76 | 7.01 | 6.62 | 4.62 | ... | ... | RSG | B[e]? | ... | 3 |
| 587 | 9.02 | 8.06 | 7.63 | 5.45 | O AGB | RSG | RSG | RSG | 8.5 × 10⁴e | |||
| 588 | IRAS 05281-6915 | M1* | 8.81 | 8.00 | 7.60 | 5.66 | ... | ... | RSG | RSG | 9.0 × 10⁴ | |
| 589 | SP77 46-19 | M2Iab:+.* | 8.49 | 7.60 | 7.26 | 5.67 | RSG | RSG | RSG | RSG | 1.3 × 10⁵e | |
| 590 | BSDL 1943 | As* | 8.41 | 7.68 | 7.30 | 5.61 | RSG | ... | RSG | RSG | 1.2 × 10⁵ | |
| 591 | IRAS 05313-6913 | IR | 9.55 | 8.62 | 8.27 | 5.65 | ... | ... | RSG: | RSG? | 4.8 × 10⁵: | |
| 592 | HV 2532 | M4 V* | 8.93 | 8.08 | 7.70 | 6.01 | RSG | ... | RSG | RSG | 8.2 × 10⁴ | |
| 593 | HV 2561 | M0Ia V* | 8.61 | 7.80 | 7.48 | 5.71 | RSG | RSG | RSG | RSG | 1.2 × 10⁵e | |
| 594 | 15.43u | 13.92 | 11.73u | 5.95 | OH/IR | ... | C AGB: | C AGB? | 1.3 × 10⁴:h | |||
| 596 | IRAS 05311-6836 | IR | 15.70 | 14.88 | 13.09 | 5.46 | ... | ... | H iif | H ii | ... | |
| 597 | IRAS 05300-6859 | M1Ia* | 7.92 | 7.19 | 6.89 | 5.91 | RSG | RSG | RSG/GMV: | RSGg | 1.6 × 10⁵e | 5 |
| 598 | HV 2604 | M1 V* | 8.75 | 7.99 | 7.59 | 6.14 | RSG | ... | RSG/GMV: | RSGg | 9.0 × 10⁴ | |
| 599 | 16.49 | 15.29 | 14.60 | 6.33 | H ii | ... | H ii | H ii? | ... | |||
| 601 | 13.88 | 11.98 | 10.52 | 6.33 | OH/IR | ... | C AGB | 1.0 × 10⁴ | 6 | |||
| 635 | IRAS 05278-6942 | IR | 17.53u | 15.59u | 12.35 | 4.83 | OH/IR | ... | C AGB | 3.4 × 10⁴ | 2 | |
| 638 | IRAS 05320-7106 | IR | 14.39 | 13.54 | 13.06 | 5.37 | H ii | ... | H ii: | H ii | ... | |
| 639 | 14.70 | 13.86 | 13.48 | 5.54 | H ii | ... | H ii: | H ii? | ... | |||
| 640 | LHA 120-N 129 | EmO | 14.49u | 13.90u | 14.06 | 5.74 | H ii | ... | H iif | H ii | ... | |
| 642 | IRAS 05294-7104 | * | 12.99 | 11.19 | 9.88 | 5.92 | C IR | O AGB | O AGB | 4.2 × 10⁴e | 5 | |
| 643 | 14.04u | 13.45 | 11.56 | 5.86 | ... | ... | C AGB: | C AGB? | 1.4 × 10⁴ | |||
| 644 | 16.39u | 14.28 | 11.93 | 6.00 | OH/IR | ... | C AGB | C AGB | 1.3 × 10⁴ | |||
| 645 | 15.36 | 13.05 | 11.28u | 6.11 | OH/IR | ... | C AGB | C AGB | 1.2 × 10⁴:h | |||
| 646 | [MLD95] LMC 1-289 | O7.5Ve* | 15.45 | 14.78 | 14.56 | 6.44 | H ii | ... | H ii: | H ii | ... | |
| 651 | IRAS 05310-7110 | IR | 15.24 | 14.48 | 13.84 | 5.95 | H ii | ... | H ii | H ii | ... | |
| 653 | IRAS 05298-6957 | * | 13.86u | 12.99u | 11.38 | 5.76 | OH/IR | ... | C AGB: | C AGB? | 1.6 × 10⁴ | |
| 661 | 14.73 | 12.53 | 10.69 | 6.27 | OH/IR | ... | C AGB | C AGB | 1.0 × 10⁴ | |||
| 689 | 15.31 | 13.14u | 11.36u | 5.98 | OH/IR | ... | C AGB | C AGB | 1.3 × 10⁴:h | |||
| 690 | 15.37 | 14.53 | 14.37 | 6.08 | H ii | ... | H ii: | H ii | ... | |||
| 692 | 16.80 | 14.31 | 12.18 | 6.14 | OH/IR | ... | C AGB | C AGB | 1.1 × 10⁴ | |||
| 716 | HV 12830 | M V* | 6.63 | 5.78 | 5.36 | 4.33 | O AGB | ... | RSG/GMV | GMVg | ... | |
| 720 | 17.86u | 14.87 | 12.52 | 6.19 | OH/IR | ... | C AGB: | C AGB? | 1.1 × 10⁴ | |||
| 733 | IRAS 05348-7024 | * | 17.66u | 15.49 | 12.85 | 5.38 | OH/IR | ... | C AGB: | C AGBi | 2.2 × 10⁴ | |
| 745 | 15.92u | 14.91 | 12.66 | 6.49 | OH/IR | ... | C AGB: | C AGB? | 8.0 × 10³ | |||
| 764 | IRAS 05333-6948 | IR | 14.05 | 13.68 | 12.76 | 4.72 | PN | H ii | H ii | H ii | 2.7 × 10⁵e | |
| 766 | LHA 120-N 150 | H ii | 15.77 | 14.78 | 14.03 | 5.04 | H ii | ... | H ii | H ii | ... | |
| 767 | IRAS 05363-6940 | IR | 14.38 | 14.43 | 13.96 | 5.26 | H ii | ... | H iif | H ii | ... | |
| 768 | 15.83 | 13.20 | 11.06 | 5.76 | OH/IR | ... | C AGB | C AGB | 1.6 × 10⁴ | |||
| 769 | 14.91 | 14.40 | 13.41 | 5.78 | PN | ... | H ii | H ii | ... | |||
| 770 | MDM 49 | Rad | 14.51 | 14.13 | 13.27 | 5.92 | PN | ... | H ii | H ii | ... | |
| 771 | 16.65 | 14.24 | 11.98 | 5.89 | OH/IR | ... | C AGB | C AGB | 1.4 × 10⁴ | |||
| 772 | 14.35 | 13.68 | 13.13 | 6.06 | H ii | ... | H ii | H ii? | ... | |||
| 773 | BAT99 69 | WC WR* | 9.56 | 8.52 | 8.07 | 5.96 | O AGB | ... | RSG | WR? | 3 | |
| 774 | 16.78u | 15.08 | 12.72 | 5.98 | OH/IR | ... | H ii: | C AGB | 1.3 × 10⁴ | 2 | ||
| 775 | 12.16 | 10.53 | 9.32 | 6.15 | C IR | C AGB | C/O AGB | C AGB | 1.9 × 10⁴e | 5 | ||
| 804 | IRAS 05325-6743 | IR | 13.09u | 13.84 | 13.44 | 5.04 | H ii | ... | H iif | H ii | ... | 10 |
| 805 | LI-LMC 1163 | M1Ia* | 8.99 | 8.16 | 7.64 | 5.07 | ... | ... | RSG | RSG | 8.6 × 10⁴ | |
| 806 | LHA 120-N 57E | EmO | 11.82 | 11.04 | 10.04 | 5.07 | PN | ... | H ii | ... | 3 | |
| 807 | 14.41 | 12.32 | 10.65 | 5.46 | OH/IR | OH/IR | C/O AGB | O AGB | 4.0 × 10⁴e | 5 | ||
| 809 | HV 5933 | M4Iab: V* | 8.95 | 8.19 | 7.82 | 5.77 | ... | ... | RSG | RSG | 7.3 × 10⁴ | |
| 810 | CCDM J05303-6653B | *i* | 9.14 | 7.99 | 7.70 | 5.88 | RSG | RSG | RSG/GMV: | RSGg | 9.4 × 10⁴e | 5 |
| 811 | 17.28u | 13.64 | 11.23 | 5.82 | ... | ... | C AGB: | C AGB? | 1.5 × 10⁴ | |||
| 813 | HV 12437 | M0.5 V* | 9.78 | 9.04 | 8.61 | 6.06 | ... | ... | RSG | RSG | 3.5 × 10⁵: | |
| 815 | HV 1001 | M4 V* | 9.38 | 8.53 | 8.02 | 6.02 | O AGB | RSG | RSG/GMV: | RSGg | 5.5 × 10⁴e | |
| 836 | IRAS 05325-6629 | IR | 16.01 | 15.06 | 13.54u | 5.68 | PN | H ii | H ii: | H ii | 7.7 × 10⁴e | 5 |
| 837 | 9.80 | 9.18 | 8.67 | 5.70 | ... | ... | U | ... | ||||
| 839 | 8.48 | 7.73 | 7.37 | 5.99 | RSG | RSG | RSG | RSG | 1.2 × 10⁵e | |||
| 840 | IRAS 05297-6517 | IR | 15.11 | 12.98 | 11.18 | 5.84 | OH/IR | ... | C AGB | C AGB | 1.5 × 10⁴ | |
| 853 | IRAS 05307-6410 | IR | 12.83 | 11.09 | 9.64 | 4.05 | ... | ... | U | ... | ||
| 869 | 8.64 | 7.89 | 7.50 | 5.65 | RSG | ... | RSG | RSG | 9.8 × 10⁴ | |||
| 870 | Dachs LMC 2-16 | M3Iab:* | 8.36 | 7.58 | 7.26 | 5.90 | RSG | RSG | RSG | RSG | 1.3 × 10⁵e | |
| 885 | [P93] 1339 | B0IV* | 12.86u | 13.26 | 11.40 | 2.77 | PN | ... | H ii: | H ii? | ... | |
| 886 | IRAS 05389-6922 | M0.5 IR | 10.21 | 9.38 | 8.51 | 3.75 | PN | ... | RSGi | 3.9 × 10⁴: | 11 | |
| 887 | IRAS 05406-6924 | IR | 10.46 | 9.85 | 8.60 | 4.43 | PN | ... | C:/O: AGB | C/O AGB? | ... | |
| 888 | 15.25u | 14.22 | 11.45 | 4.46 | OH/IR | ... | C AGB: | H ii | ... | 4 | ||
| 889 | [JGB98] 30 Dor-06 | MoC | 14.56 | 13.63 | 12.55 | 4.39 | PN | H ii | H ii | H ii | 4.0 × 10⁵e | |
| 890 | HD 37974 | B:e Em* | 10.13 | 9.76 | 8.76 | 4.58 | PN | Peculiar | O AGB: | B[e] | 7.1 × 10⁴e | 12 |
| 891 | 8.54 | 7.63 | 7.14 | 5.14 | O AGB | ... | RSG | RSG | 1.4 × 10⁵ | |||
| 892 | BRHT 54b | Cl* | 8.96 | 8.18 | 7.72 | 5.56 | ... | ... | RSG | RSG | 8.0 × 10⁴ | |
| 893 | IRAS 05413-6919 | IR | 8.77 | 7.94 | 7.49 | 5.74 | O AGB | ... | RSG/GMV: | RSGg | 9.9 × 10⁴ | |
| 894 | LHA 120-N 158B | EmO | 13.86 | 13.88 | 12.75u | 6.01 | PN | H ii | H ii | H ii | 5.6 × 10⁴e | |
| 897 | 8.82 | 7.91 | 7.45 | 6.01 | O AGB | RSG | RSG/GMV | RSGg | 9.4 × 10⁴e | |||
| 900 | [P93] 1938 | O7.5Vb:* | 14.87u | 15.50 | 14.33u | 6.21 | PN | ... | H ii: | H ii | ... | |
| 906 | 16.02 | 15.17 | 13.82 | 6.12 | ... | ... | H ii | H ii? | ... | |||
| 930 | [DMM94] J0539-696 | Rad | 12.34 | 12.27 | 11.67 | 2.81 | H ii | ... | H ii | H ii | ... | |
| 932 | IRAS 05405-6946 | IR | 14.09 | 13.14 | 12.97 | 4.15 | H ii | ... | H ii: | H ii? | ... | |
| 934 | [JGB98] N158-2 | MoC | 14.79 | 14.14 | 13.25 | 4.67 | PN | H ii | H ii | H ii | 2.5 × 10⁵e | |
| 936 | IRAS 05402-6956 | * | 14.34 | 11.74 | 9.79 | 5.02 | OH/IR | ... | C AGB | O AGB | ... | 13 |
| 937 | IRAS 05410-6954 | IR | 14.52 | 12.24 | 10.36 | 5.37 | OH/IR | ... | C AGB | C AGB | 2.3 × 10⁴ | |
| 938 | IRAS 05389-7042 | IR | 14.73 | 14.18 | 13.59 | 5.32 | PN | ... | H ii | H ii | ... | |
| 939 | [HS66] 385 | OpC | 9.16 | 8.20 | 7.71 | 5.53 | O AGB | RSG | RSG | RSG | 8.1 × 10⁴e | |
| 940 | [KRB97] 30DorCent | MoC | 15.70u | 15.12 | 13.33 | 5.94 | ... | ... | H ii: | H ii? | ... | |
| 941 | 15.04 | 12.77 | 10.85 | 6.16 | OH/IR | ... | C AGB | C AGB | 1.1 × 10⁴ | |||
| 942 | BSDL 2601 | As* | 16.18 | 15.39u | 14.93 | 6.14 | H ii | ... | H ii: | H ii | ... | |
| 943 | HV 2778 | M0 V* | 8.79 | 7.98 | 7.63 | 6.14 | RSG | RSG | RSG | RSG | 8.7 × 10⁴e | |
| 977 | IRAS 05406-7111 | IR | 16.24 | 15.66 | 13.46u | 5.16 | H ii | ... | H ii: | H ii | ... | |
| 978 | [O96] D293 - 39 | * | 15.67 | 14.21u | 13.45u | 5.48 | ... | ... | H ii | H ii | ... | |
| 981 | 17.59u | 16.19u | 13.43 | 6.48 | OH/IR | ... | C AGB: | C AGB? | 7.9 × 10³ | |||
| 1016 | 16.21 | 13.72 | 11.79 | 6.10 | OH/IR | ... | C AGB | C AGB | 1.1 × 10⁴ | |||
| 1048 | RT Men | Mi* | 7.73 | 6.92 | 6.50 | 5.38 | O AGB | ... | RSG/GMV: | GMVg | ... | 3 |
| 1072 | IRAS 04407-7000 | * | 10.66 | 9.48 | 8.69 | 5.14 | PN | O AGB | O AGB | O AGB | 6.5 × 10⁴e | |
| 1115 | IRAS 04496-6917 | IR | 13.81 | 13.63 | 13.17 | 4.93 | H ii | ... | H ii: | H ii | ... | |
| 1117 | IRAS 04498-6842 | * | 9.13 | 8.05 | 7.49 | 5.50 | O AGB | ... | RSG/GMV | O AGB | ... | 10, 14 |
| 1119 | 14.19 | 12.14 | 10.55 | 6.24 | OH/IR | ... | C AGB | C AGB | 1.1 × 10⁴ | |||
| 1120 | LI-LMC 31 | IR | 14.45 | 12.31 | 10.65 | 6.10 | OH/IR | C AGB | C AGB | C AGB | 1.1 × 10⁴e | |
| 1130 | IRAS 04496-6958 | C* | 12.66 | 10.85 | 9.43 | 5.40 | ... | ... | C/O AGB | C AGB | 2.6 × 10⁴ | 1 |
| 1132 | HV 2236 | M V* | 9.05 | 8.17 | 7.76 | 5.92 | O AGB | RSG | RSG | RSG | 7.7 × 10⁴e | |
| 1150 | WOH G 17 | * | 6.85 | 5.94 | 5.54 | 4.57 | O AGB | GMV | RSG/GMV | GMVg | 4.0 × 10³e | 5 |
| 1171 | IRAS 04545-7000 | * | 16.51 | 12.81 | 10.40 | 5.06 | OH/IR | ... | C AGB: | O AGB?i | ... | |
| 1173 | IRAS 04523-7043 | IR | 18.16u | 14.07 | 11.64 | 5.82 | OH/IR | ... | C AGB: | C AGB? | 1.5 × 10⁴ | |
| 1182 | IRAS 04553-6825 | M7.5* | 9.25 | 7.74 | 6.85 | 2.35 | OH/IR | RSG | 4.7 × 10⁵e | 5 | ||
| 1183 | BSDL 126 | Neb | 12.55 | 11.82u | 10.77u | 3.36 | PN | ... | H ii | H ii | ... | |
| 1184 | IRAS 04530-6916 | * | 13.94 | 11.86 | 9.96 | 4.16 | OH/IR | ... | C AGB | H ii | ... | 10, 13 |
| 1186 | IRAS 04542-6916 | IR | 14.39 | 13.78 | 13.43 | 4.67 | H ii | ... | H ii: | H ii? | ... | |
| 1187 | [L72] LH 5-1008 | *iA | 12.83 | 12.55 | 11.74 | 4.84 | PN | ... | H ii | H ii | ... | |
| 1189 | IRAS 04553-6933 | M2 IR | 8.66 | 7.68 | 7.20 | 5.12 | O AGB | RSG | RSG | RSG | 1.3 × 10⁵e | |
| 1190 | IRAS 04516-6902 | * | 9.93 | 8.62 | 7.91 | 5.35 | ... | ... | O AGBi | ... | 14 | |
| 1191 | WOH S 60 | M* | 9.32 | 8.46 | 8.06 | 5.85 | ... | ... | RSG | RSG | 5.9 × 10⁴ | |
| 1192 | IRAS 04509-6922 | * | 9.87 | 8.67 | 7.93 | 5.98 | ... | ... | GMV: | O AGB | ... | 15 |
| 1193 | 15.26 | 13.02 | 11.13 | 6.07 | OH/IR | ... | C AGB | C AGB | 1.2 × 10⁴ | |||
| 1204 | SP77 31-18 | M* | 8.56 | 7.75 | 7.37 | 6.07 | RSG | RSG | RSG/GMV: | RSGg | 1.0 × 10⁵e | 5 |
| 1207 | LHA 120-N 89 | EmO | 15.51 | 13.65 | 11.88 | 5.41 | OH/IR | ... | H ii? | ... | ||
| 1225 | 13.12 | 12.19 | 10.81 | 5.07 | ... | ... | U | ... | ||||
| 1227 | 14.44 | 13.15 | 11.71 | 6.17 | ... | ... | U | ... | ||||
| 1229 | 16.81 | 15.62 | 14.06 | 6.22 | ... | ... | H iif | H ii? | ... | |||
| 1247 | PGMW 3123 | O8.5V* | 13.72u | 13.48u | 13.73 | 5.10 | H ii | ... | H iif | H ii | ... | |
| 1248 | PGMW 3265 | * | 13.23 | 13.20 | 12.56 | 5.50 | H ii | ... | H ii | H ii | ... | |
| 1249 | 14.15 | 12.27 | 10.77 | 6.08 | ... | ... | C AGB | 1.2 × 10⁴ | 2 | |||
| 1278 | IRAS 05009-6616 | * | 15.64u | 14.57 | 12.40 | 5.97 | OH/IR | ... | C AGB: | C AGB | 1.3 × 10⁴ | 6 |
| 1280 | IRAS 05003-6712 | * | 12.04 | 10.46 | 9.32 | 6.14 | C IR | O AGB | C/O AGB | O AGB | 1.7 × 10⁴e | 2, 5 |
| 1282 | 16.98u | 14.54 | 12.20 | 6.07 | OH/IR | C AGB | C AGB | C AGB | 1.5 × 10⁴e | |||
| 1296 | HD 32364 | ?e* | 14.06 | 13.88 | 13.22 | 5.30 | PN | ... | H ii | H ii | ... | |
| 1297 | IRAS 04573-6849 | IR | 14.27u | 13.56u | 14.11 | 5.39 | H ii | ... | H iif | H ii | ... | |
| 1298 | 15.50 | 13.05 | 11.12 | 5.68 | OH/IR | ... | C AGB | C AGB | 1.7 × 10⁴ | |||
| 1302 | IRAS 04589-6825 | IR | 15.49 | 15.18 | 14.93 | 6.02 | H ii | ... | H iif | H ii?i | ... | |
| 1306 | LHA 120-S 5 | EmO | 15.71 | 15.26 | 14.16 | 6.04 | PN | H ii | H ii | H ii | 4.3 × 10⁴e | |
| 1326 | HD 268835 | B8Ia Em* | 10.08 | 9.68 | 8.85 | 4.66 | PN | Peculiar | B[e] | 5.5 × 10⁴e | 12 | |
| 1328 | HV 2255 | M4 V* | 8.44 | 7.65 | 7.32 | 5.39 | RSG | RSG | RSG | RSG | 1.3 × 10⁵e | |
| 1329 | WOH S 76 | M* | 8.23 | 7.45 | 7.11 | 5.73 | RSG | ... | RSG | RSG | 1.4 × 10⁵ | |
| 1330 | WOH S 74 | M* | 8.93 | 7.95 | 7.62 | 5.74 | RSG | RSG | RSG | RSG | 9.3 × 10⁴e | |
| 1360 | 17.97u | 15.47 | 12.76 | 6.05 | OH/IR | ... | C AGB: | C AGB? | 1.2 × 10⁴ | |||
| 1371 | IRAS 05469-7255 | IR | 14.80 | 12.80 | 11.06 | 5.81 | OH/IR | ... | C/O AGB | C/O AGB | ... | |
| 1378 | 16.28 | 13.71 | 11.72 | 5.73 | OH/IR | ... | C AGB | C AGB | 1.6 × 10⁴ | |||
| 1379 | 18.09u | 17.18u | 14.56 | 5.62 | OH/IR | ... | U | ... | ||||
| 1382 | PMN J0545-6946 | Rad | 14.05 | 13.54 | 12.91 | 5.61 | H ii | ... | H ii | H ii | ... | |
| 1383 | LI-LMC 1646 | IR | 18.05u | 15.88 | 13.09 | 5.71 | OH/IR | ... | C AGB: | C AGB? | 1.5 × 10⁴ | |
| 1384 | 16.29 | 13.55 | 11.46 | 6.45 | OH/IR | C AGB | C AGB | C AGB | 5.8 × 10³e | |||
| 1400 | 16.59 | 13.88 | 11.74 | 5.77 | OH/IR | C AGB | C AGB | C AGB | 7.1 × 10³e | |||
| 1411 | IRAS 05410-6520 | IR | 17.09u | 14.72 | 11.88 | 5.61 | OH/IR | ... | C AGB: | C AGB? | 1.8 × 10⁴ | |
| 1412 | IRAS 05404-6458 | IR | 15.31 | 12.97 | 11.11 | 5.80 | OH/IR | ... | C AGB | C AGB | 1.5 × 10⁴ | |
| 1429 | HV 2834 | M0.5 V* | 8.96 | 7.92 | 7.49 | 6.21 | O AGB | RSG | RSG/GMV | RSGg | 9.1 × 10⁴e | |
| 1436 | 16.14 | 14.78 | 12.71 | 5.92 | OH/IR | ... | C AGB: | C AGB? | 1.4 × 10⁴ | |||
| 1438 | HD 269997 | B3Ia* | 16.52 | 15.99 | 15.98u | 5.78 | H ii | ... | B[e]? | ... | 3 | |
| 1453 | IRAS 05506-7053 | * | 18.14u | 15.35 | 12.45 | 5.67 | OH/IR | ... | C AGB: | C AGB? | 1.7 × 10⁴ | |
| 1456 | 13.00 | 11.07 | 9.51 | 6.00 | ... | ... | C AGB | C AGB | 1.9 × 10⁴ | |||
| 1471 | 17.00u | 14.66 | 12.35 | 6.24 | OH/IR | ... | C AGB | C AGB | 1.0 × 10⁴ | |||
| 1488 | IRAS 05508-7146 | IR | 15.12 | 12.91 | 11.05 | 6.27 | OH/IR | C AGB | C AGB | C AGB | 1.0 × 10⁴e | |
| 1492 | 12.25 | 10.68 | 9.51 | 6.24 | C IR | C AGB | C/O AGB | C AGB | 1.9 × 10⁴e | 5 | ||
| 1524 | IRAS 05558-7000 | * | 11.98 | 10.34 | 9.13 | 5.81 | C IR | O AGB | C/O AGB | O AGB | 4.1 × 10⁴ | 5 |
| 1546 | 14.96 | 12.78 | 10.93 | 5.92 | OH/IR | ... | C AGB | C AGB | 1.4 × 10⁴ | |||
| 1567 | IRAS 05526-6520 | IR | 15.97 | 13.66 | 11.65 | 6.01 | OH/IR | ... | C AGB | C AGB | 1.2 × 10⁴ | |
| 1570 | IRAS 05540-6533 | IR | 17.81u | 16.75u | 13.40 | 6.23 | OH/IR | ... | U | ... | ||
| 1571 | IRAS 05547-6515 | IR | 18.15u | 15.90u | 13.80 | 5.96 | OH/IR | ... | C AGB: | C AGB? | 1.2 × 10⁴ | |
| 1589 | IRAS 05571-6827 | IR | 10.46 | 9.48 | 8.61 | 5.01 | PN | ... | O AGB | O AGB | ... | |
| 1650 | IRAS 06024-6645A | B3 HV* | 15.70 | 13.18 | 11.04 | 5.44 | OH/IR | ... | C AGB | C AGB? | 2.1 × 10⁴ | 3 |
| 1651 | 18.44u | 16.47 | 13.54 | 5.85 | OH/IR | ... | C AGB: | C AGBi | 1.3 × 10⁴ | |||
| 1652 | IRAS 06025-6712 | IR | 17.85u | 15.61 | 12.98 | 5.92 | OH/IR | C AGB | C AGB | C AGB | 1.2 × 10⁴e | |
| 1653 | 16.05 | 15.67 | 13.05u | 6.16 | ... | ... | C AGB | C AGB | 1.1 × 10⁴:h | |||
| 1677 | IRAS 06013-6505 | IR | 6.80 | 5.89 | 5.16 | 2.99 | O AGB | GMV | RSG:/GMV | GMVg | 9.7 × 10³e | 5 |
| 1679 | 7.73 | 6.89 | 6.48 | 5.01 | O AGB | ... | RSG/GMV: | RSGg | 2.5 × 10⁵ | |||
| 1686 | 6.33 | 5.41 | 4.85 | 3.51 | C AGB | GMV | RSG/GMV | GMVg | 4.6 × 10³e | 5 | ||
| 1689 | 14.91 | 12.71 | 10.87 | 5.88 | OH/IR | ... | C AGB | C AGB | 1.4 × 10⁴ | |||
| 1696 | 14.47 | 12.37 | 10.51 | 5.97 | OH/IR | ... | C AGB | C AGB | 1.4 × 10⁴ | |||
| 1753 | 15.26 | 12.99 | 11.20 | 6.14 | OH/IR | ... | C AGB | C AGB | 1.1 × 10⁴ | |||
| 1780 | 17.86u | 17.04u | 14.10 | 5.69 | OH/IR | ... | C AGB | 1.4 × 10⁴ | 2 | |||
| 1794 | 15.80 | 15.17 | 14.13 | 6.38 | PN | H ii | H ii | H ii | 1.7 × 10⁴e | 5 | ||
| 1797 | 14.13 | 12.29 | 10.70 | 6.42 | OH/IR | ... | C/O: AGB | C/O AGB? | ... | |||
Notes. aSource types and names obtained from SIMBAD (simbad.u-strasbg.fr/sim-fid.pl). Object types (other than stellar spectral types) are as follows: V* = variable star; EmO = emission-line source; IR = infrared source,* = star, sr* = semi-regular variable star; Mi* = variable star of Mira type; OpC = open cluster; As* = association of stars, Cl* = cluster of stars;*iC = star in cluster;*i* = star in double system; MoC = molecular cloud; Rad = radio source;*iA = star in association; HV* = high-velocity star. b2MASS source magnitudes followed by a "u" designate flux upper limits. cJHK8 color-based classifications (see Sections 3.1 and 3.2). Colons indicate tentative classifications; blank entries indicate sources that are not classifiable via JHK8 colors. dMost probable classifications for sources, based on the JHK8 color-based classification system, available literature, and additional cross-checks (see Section 3.2). Question marks indicate tentative classifications; the designation "U" indicates sources that have no classifications. eLIR determined in Paper I. fSource appears in the expanded H ii classification box. gK magnitude was used to determine classification as "RSG" or "GMV" (see Section 3.2.1). hLIR uncertain because K magnitude is an upper limit. iArchival Spitzer IRS spectrum available (see Section 3.2.1). References. (1) Trams et al. 1999 (see also Matsuura et al. 2005); (2) van Loon et al. 2006; (3) SIMBAD; (4) Oliveira et al. 2006; (5) Paper I; (6) Zijlstra et al. 2006; (7) de Winter et al. 2001; (8) Indebetouw et al. 2004; (9) Sanduleak et al. 1978; (10) van Loon et al. 2001; (11) Westerlund et al. 1981; (12) Kastner et al. 2006; (13) Wood et al. 1992; (14) van Loon et al. 2005a; (15) van Loon et al. 1998b.
Machine-readable and Virtual Observatory (VO) versions of the table are available.
Download table as: Machine-readable (MRT)Virtual Observatory (VOT)Typeset images: 1 2 3 4 5
Although we believe Table 1 to represent the LMC's most luminous, compact mid-IR sources, there remains some uncertainty in the assignment of individual objects to this sample. Given the 6'' MSX A-band point-spread function (PSF) there is the possibility that some MSX sources—particularly those associated with compact H ii regions, i.e., in clusters or regions of star formation—have been associated with the wrong 2MASS source or are contaminated with flux from nearby sources (the identification of 2MASS sources with MSX sources is discussed in detail in EVP01). Perhaps more importantly, because AGB stars (many of which are Mira variables) can exhibit strong IR variability, some sources included in (or excluded from) this study may actually exhibit time-averaged 8 μm fluxes that are somewhat below (or above) the cutoff we have imposed. However, we do not expect these quasi-random source inclusions (exclusions) to affect the basic source population results described in Section 4.
Table 1 lists the following for the sample of 250 objects: MSX LMC object number (column 1); SIMBAD10 designated name and spectral or object type (columns 2, 3); 2MASS J, H, K magnitudes (with flux upper limits indicated by "u") and MSX A magnitude, as obtained from the IRSA databases via gator (columns 4–7); IR classes as determined from 2MASS–MSX colors by EVP01 (column 8); IR classes determined from the spectroscopic study presented in Paper I (column 9); classifications we have assigned the objects in this paper, first based solely on revised Paper I color–color criteria, as described in Sections 3.1 and 3.2 (column 10), and then incorporating additional information gleaned from other sources, as described in Section 3.2.1 (column 11, with references listed in column 13); and IR luminosities for all sources identified as C-rich AGB stars and RSGs (see Section 3.3) as well as for those H ii regions, B[e] stars, and Galactic objects that were included in the Paper I study (column 12). Table 2 contains a summary of the classifications of the Table 1 objects as listed in column 11 of that table. Columns 10–12 of Table 1 and the summary in Table 2 thus reflect the results of the classification analysis carried out here (Section 3).
Table 2. Summary of Classifications of Luminous 8 μm Sources in the LMC
| Class | EVP01 | Paper I | This Papera |
|---|---|---|---|
| All | 250b | 60 | 250 |
| C AGB | 8c | 16 | 85 (17) |
| O AGB | 21 | 4 | 13 (3) |
| C/O AGBd | ... | ... | 3 (2) |
| RSG | 19 | 21 | 44 (2) |
| H ii | 39 | 11 | 78 (19) |
| GMV | 0 | 4 | 7 |
| PN | 34 | 0 | 1e |
| OH/IR | 88 | 2 | 2f |
| B[e] | 0 | 2g | 7 (3) |
| WR | 0 | 0 | (2) |
| Unclassified | 41 | 0 | 10 |
Notes. aNumbers outside parentheses indicate the total number of confirmed plus tentative classifications. Numbers within parentheses indicate the number of tentative classifications. bOnly includes objects considered in this paper. cIncludes objects classified as either "C AGB" or "C IR." dObjects that fall in the zone of confusion between O-rich and C-rich AGB star JHK8 color classification regions. eA small fraction of objects classified as H ii regions may be PNs; see Section 4.1. fOne AGB star (included in "O AGB" total) and one RSG (included in "RSG" total). gTwo B[e] supergiants in Paper I were classified as peculiar.
Download table as: ASCIITypeset image
3. SPITZER/IRS-BASED COLOR–COLOR AND COLOR–MAGNITUDE CLASSIFICATION OF LMC IR SOURCES
3.1. Revisions to JHK8 Color–Color Classification Criteria
Color–color diagrams constructed from the Table 1 2MASS–MSX photometry for the 60 objects studied via IRS spectroscopy in Paper I are displayed in Figure 1. As noted in Paper I, these J − K versus K − A and H − K versus K − A diagrams, as "calibrated" by Spitzer/IRS, illustrate that the RSGs, O-rich AGB stars, and C-rich AGB stars form a sequence of increasing redness. The Galactic AGB star group generically referred to in Paper I as Galactic Mira variables (GMVs) occupies a subset of the RSG space and, therefore, GMVs are indistinguishable from RSGs based solely on 2MASS–MSX color–color diagrams (we caution that it remains to be confirmed, via measurement of their V-band amplitudes, the Mira status of some of these "GMVs"). H ii regions appear as a distinct group, due to their combination of blue J − K and H − K colors and very red K − A colors (this region of color–color space may also include PNs, post-AGB stars, and/or other emission-line objects).

Figure 1. 2MASS–MSX color–color diagrams for those Table 1 objects studied spectroscopically with Spitzer/IRS (Paper I), overlaid with revised object classification "boxes" (see text and Table 3). Objects for which one or more 2MASS magnitudes are upper limits are indicated.
Download figure:
Standard image High-resolution imageIn light of the revisions to the MSX A-band photometry since publication of EVP01, and given that many compact H ii regions apparently lurk among the LMC's most luminous 8 μm point sources (Paper I), we have revisited the Paper I Spitzer/IRS-based JHK8 color–color classification criteria. Our revised JHK8 classification regions, based on the positions of these source classes, are overlaid in Figure 1 and are summarized in Table 3. The main differences between these JHK8 color–color classification criteria and the original Paper I criteria are as follows: (a) the positions of most of the classification regions are shifted ∼0.3 mag redward in K − A (i.e., rightward) relative to their positions in Paper I, as a consequence of the systematically larger A-band fluxes of the Paper I objects relative to those published in EVP01; (b) there is considerably more overlap between the "O AGB" (O-rich AGB) and "C AGB" (C-rich AGB) classification regions, mainly due to our inclusion here of the OH/IR star MSX LMC 807 in the "O AGB" group; and (c) we expand the H ii region classification zone to compensate for the fact that the Paper I selection criteria for such objects were overly restrictive (Section 4.1). The O AGB region is in fact very poorly constrained, due to the paucity of O-rich AGB stars in the Paper I sample. Only three objects in the Paper I study then remain outside the regions indicated in Figure 1. This "outlier" group consists of the OH/IR supergiant MSX LMC 1182, which is found redward (in K − A) of the O-rich and C-rich AGB color–color regions, and two B[e] supergiants with dusty circumstellar disks (MSX LMC 890 and 1326; Kastner et al. 2006) that lie between the RSG and H ii region boxes.
Table 3. Luminous LMC Mid-IR Sources: Revised JHK8 Color Classification Criteria
| Class | Criteria | |
|---|---|---|
| J − K vs. K − A colors | ||
| RSG | 0.75 ⩽ (K − A) ⩽ 2.5 | 0.7 ⩽ (J − K) ⩽ 1.75 |
| O AGB | [−0.7 × (J − K) + 4.69] ⩽ (K − A) ⩽ [0.87 × (J − K) + 2.02] | (J − K) ⩽ [0.44 × (K − A) + 1.56] |
| C AGB | [0.93 × (J − K) + 0.175] ⩽ (K − A) ⩽ [1.37 × (J − K) + 0.375] | 2.5 ⩽ (J − K) ⩽ 5.2 |
| H ii | 6.25 ⩽ (K − A) ⩽ 9.0 | 0.6 ⩽ (J − K) ⩽ 2.5 |
| Expanded H ii | 6.0 ⩽ (K − A) ⩽ 9.5 | (J − K) ⩽ 3.0 |
| GMV | 0.5 ⩽ (K − A) ⩽ 2.5 | [0.25 × (K − A) + 0.975] ⩽ (J − K) ⩽ [0.25 × (K − A) + 1.275] |
| H − K vs. K − A colors | ||
| RSG | 0.75 ⩽ (K − A) ⩽ 2.5 | 0.1 ⩽ (H − K) ⩽ 0.7 |
| O AGB | [−1.00 × (H − K) + 4.10] ⩽ (K − A) ⩽ [0.91 × (H − K) + 2.95] | (H − K) ⩽ [0.19 × (K − A) + 0.78] |
| C AGB | [2.22 × (H − K) − 0.22] ⩽ (K − A) ⩽ [2.22 × (H − K) + 1.78] | 1.0 ⩽ (H − K) ⩽ 2.8 |
| H ii | 0.75 ⩽ (K − A) ⩽ 2.5 | 0.5 ⩽ (H − K) ⩽ 1.5 |
| Expanded H ii | 6.0 ⩽ (K − A) ⩽ 9.5 | (H − K) ⩽ 2.0 |
| GMV | 0.5 ⩽ (K − A) ⩽ 2.5 | [0.2 × (K − A) + 0.1] ⩽ (H − K) ⩽ [0.2 × (K−A) + 0.4] |
Download table as: ASCIITypeset image
3.2. Application of JHK8 Color-Based Classification Criteria
The 2MASS and MSX color–color diagrams constructed for our sample of objects, overlaid with revised (Table 3) Spitzer/IRS-based JHK8 color classification regions, are displayed in Figure 2. It is apparent from Figure 2 that most objects fall within a unique classification region. We consider these objects to be classified with relatively high confidence. Many other objects appear in a given classification region on only one of the color–color plots, and we ascribe somewhat lower confidence to their classifications (these tentative classifications are indicated by a colon in Table 1). Hence, the majority of Table 1 objects can be classified (or tentatively classified) solely on the basis of their JHK8 colors (column 10 of Table 1).

Figure 2. 2MASS/MSX color–color diagrams displaying J − K vs. K − A (top) and H − K vs. K − A (bottom) colors for the Table 1 sample. The boxes indicate the revised (Table 3) Paper I Spitzer IRS-based IR color criteria for classification of IR-luminous LMC objects. The colored symbols indicate objects with IRS spectra obtained in the Paper I survey, with classifications as indicated in the figure legend. Crosses indicate objects with measured JHK magnitudes that were not included in the Paper I spectroscopic study. Objects for which one or more 2MASS magnitudes are upper limits are also indicated.
Download figure:
Standard image High-resolution imageNonetheless, because our sample is greatly enlarged compared with that studied in Paper I, a substantial fraction (∼25%) of Table 1 objects lack JHK8 (color-based) classifications, even after relaxing the classification criteria for H ii regions. Many others—particularly those with an upper limit in one or more 2MASS bands—lie on or just outside of the lines defining the various classification regions. Some objects lie within zones of confusion between classes. For all of these sources the classifications listed in column 10 are uncertain, ambiguous, or both. These tentative classifications are indicated by colons. The classifications of a few objects whose colors place them very near (within ∼0.2 mag of), but outside of, the Table 3 classification regions are also flagged with colons, while those within zones of confusion between RSGs and GMVs or between O-rich and C-rich AGB stars are classified as "RSG/GMV" or "C/O AGB," respectively, in column 10 of Table 1.
3.2.1. Cross-Checks of JHK8 Color-Based Classifications
We have employed a variety of means to cross-check the JHK8 color-based classifications in column 10 of Table 1 so as to verify or revise these classifications, as well as to determine the nature of as many as possible of the unclassified, tentatively classified, or ambiguously classified sources.
- 1.Previous classifications. We cross-checked the JHK8 classifications against the available literature as well as the available SIMBAD object class and/or spectral-type information (see the reference list in the notes to Table 1). Where a conflict exists between the JHK8 color-based classification and a previous classification, we defer to the previous (literature-based) classification.
- 2.Color–magnitude-based classifications of RSGs and Milky Way AGB stars. Most objects in the region of overlap between RSG and GMV classes within the 2MASS–MSX color–color diagrams (listed as "RSG/GMV" in Table 1) can be firmly classified on the basis of 2MASS–MSX color–magnitude diagrams. In Figure 3, we present such diagrams for the Table 1 sample (objects for which J and/or K fluxes are the upper limits are not displayed). As noted in Paper I, LMC RSGs and Galactic Mira variables are generally readily distinguished in these diagrams, due to the relative proximity of the latter group (Section 4.2). Objects for which this cross-check yielded a clear classification of an object as "RSG" or "GMV" are indicated by footnote "g" in Table 1.
- 3.Candidate H ii regions included in or excluded from the SAGE PSC. A check on the classification of Table 1 objects as H ii regions is provided by their presence—or, indeed, lack thereof—in the SAGE Point Source Catalog (PSC). Since the Spitzer/IRAC PSF is ∼2.5'' at 8.0 μm, many Table 1 sources (all of which appeared point-like to MSX, with its PSF full width at half-maximum [FWHM] of ∼6'' at 8.3 μm) are resolved by IRAC and, hence, are not included in the SAGE PSC (see Section 5). We regard all such Table 1 sources as having their H ii region status confirmed. On the other hand, the minority of sources with JHK8 colors indicative of H ii regions that do appear in the SAGE PSC (excluding MSX LMC 1794, which was studied in Paper I) are considered as tentative classifications. Their inclusion in the SAGE PSC assures that these sources are generally more compact than the H ii regions included in the Paper I spectroscopic study (most of which were well resolved by the short-wavelength spectrometer modules of the IRS). Therefore some of the Table 1 sources tentatively classified as H ii regions may in fact be PNs, pre-PNs, or circumstellar dust disks or envelopes associated with massive, early-type, emission-line stars (see Sections 4.1 and 4.4).
- 4.IRAS fluxes of candidate H ii regions. IRAS data provide an additional indication of H ii region status, although we regard IRAS fluxes as a rather weak constraint in this regard given the likelihood that such data may suffer from confusion in the crowded fields typical of H ii regions. We find that 16 of 17 candidate H ii regions in Table 1 for which IRAS data are available have 25 μm flux densities >1.3 Jy, similar to or, in many cases, larger than those of the H ii regions studied in Paper I. All of these sources display steeply rising SEDs in the IRAS data, leading to extrapolated luminosities ≳105 L☉ that are too large for PNs. Only three of these sources (MSX LMC 502, 932, and 1186) are compact enough to be included in the SAGE PSC (see Section 3.2.1) and hence retain tentative H ii region classifications.
- 5.Archival IRS spectra. Last but not least, good-quality unpublished archival Spitzer IRS spectra have become publicly available for several Table 1 objects. Where possible, we have used these spectra to confirm or revise source classifications (these classifications are indicated in Table 1 by footnote "i"). We defer publication and descriptions of these data to a later paper that will be devoted to all IRS spectra of Table 1 objects obtained subsequent to the Paper I study (C. L. Buchanan et al. 2008, in preparation).
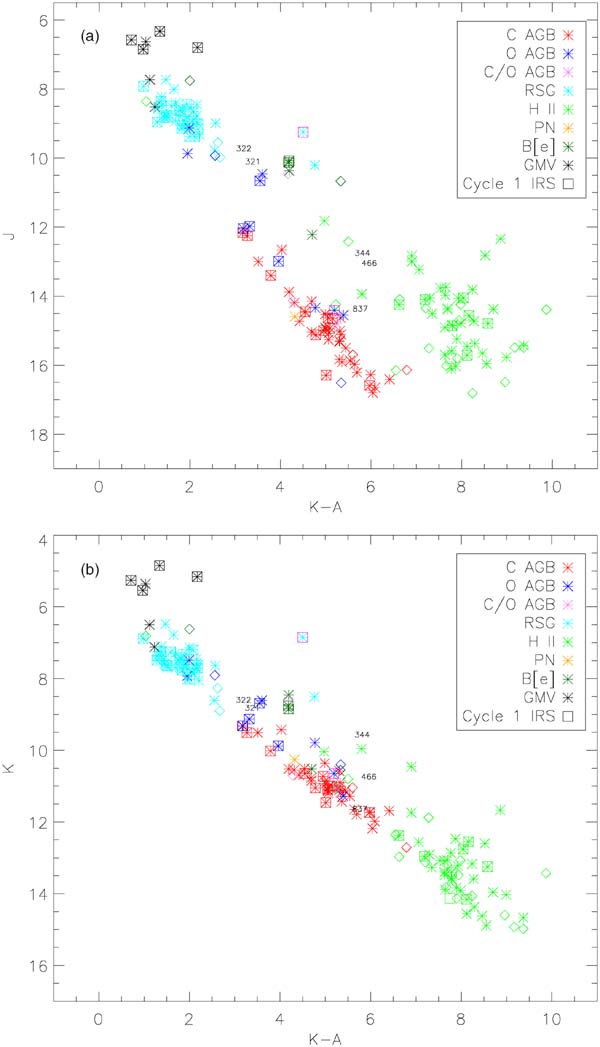
Figure 3. (a) 2MASS/MSX J vs. K − A color–magnitude diagram for the Table 1 sample. Objects with J-band upper limits have been omitted. The symbol color coding is based on classifications in column 11 of Table 1. Objects classified with high confidence are indicated by asterisks; objects with tentative classifications are indicated by diamonds. Points corresponding to objects included in the Paper I IRS sample are enclosed in squares. Objects with no classification in column 11 of Table 1 are indicated by the MSX number. (b) As in (a), but for K vs. K − A, omitting objects with K-band upper limits.
Download figure:
Standard image High-resolution imageAfter applying these five independent cross-checks, we are able to classify or tentatively classify 44 Table 1 objects whose classes could not be determined on the basis of JHK8 colors (excluding objects studied in Paper I). We firmly classify another 14 objects for which the color-based classifications are either ambiguous or uncertain. In all, there are 15 cases in which a color-based classification (either tentative or secure) is supported, and 10 cases in which we find an apparently "secure" JHK8 color-based classification to be incorrect.
3.2.2. JHK8 Classifications: Results and "Success Rate"
The results of application of JHK8 color-based classifications, and the cross-checks of these classifications, are listed in column 11 of Table 1. Tentative classifications are indicated by "?". Most of these sources either have tentative JHK8 color-based classifications which we are unable to confirm via the cross-checks described in Section 3.2.1, or reside within the boundaries of a JHK8 classification region for which the color-based classification is rendered questionable by one or more cross-checks.
We display color–color diagrams illustrating the Table 1, column 11 classification results in Figure 4. The final tabulations of the population within each object class (Table 2 and Figure 5) are based on these results. The population histograms (Figure 5) indicate that the vast majority of objects with upper limits in one or more 2MASS bands are either (confirmed or candidate) C-rich AGB stars, H ii regions, or are unclassified. The classification results, including individual objects of interest, are discussed in detail in Section 4.

Figure 4. (a) J − K vs. K − A color–color diagram for the Table 1 sample, color-coded to illustrate the results of classification based on the 2MASS/MSX color–color and color–magnitude diagrams combined with a cross-check of the available literature (column 11 of Table 1). Revised Paper I color–color classification regions (Section 3.1) are overlaid. Symbol meanings are as in Figure 3. (b) As in (a), but for H − K vs. K − A colors.
Download figure:
Standard image High-resolution image
Figure 5. Histograms illustrating the number of objects in each class, based on classifications in column 11 of Table 1, for objects with measured fluxes in all three 2MASS bands (upper left), those with upper limits in one or more 2MASS bands (upper right), and the entire sample (bottom). In each panel, the dark gray bars indicate the number of objects classified with high confidence, while the light gray indicates the total number of objects in each class when tentative classifications are included.
Download figure:
Standard image High-resolution imageComparison of columns 10 and 11 of Table 1 can be used to estimate (albeit rather crudely) the "success rate" of the application of the JHK8 color-based classification criteria in Table 3. In addition to the 25 cases of "success and failure" in applying the Table 3 criteria to objects not included in the Paper I sample mentioned above, these criteria (augmented by 2MASS–MSX color–magnitude diagrams) also, by definition, unambiguously and correctly classify ∼85% of the 60 Paper I sources—with the exceptions being the half-dozen or so sources that lie in the region of overlap between the C-rich and O-rich AGB stars, the OH/IR supergiant MSX LMC 1182, and the 2 MSX sources associated with B[e] supergiants. Hence, the JHK8 color-based classification system recovers the correct classification for ∼70% of ∼90 sources for which unambiguous spectral classifications are available. The actual "success rate" of the Table 3 classification system is likely to be higher than 70%, given that the Paper I sample does not proportionately represent the (relatively easily classified) C AGB and RSG populations.
3.3. Estimates of IR Luminosities for RSGs and Carbon Stars
For LMC RSGs and luminous carbon stars, Paper I established empirical relationships between integrated IR luminosity (LIR) and K-band flux density. In the case of carbon stars, the relationship depends on K − A color, while for RSGs the ratio of K-band flux to LIR is roughly constant over the observed (relatively small) range of RSG K − A colors. We have applied these "bolometric corrections" to the newly classified C AGB stars and RSGs in our sample; the results are listed in column 12 of Table 1. The tabulated luminosities of the C-rich AGB and RSG stars have estimated uncertainties of ∼30–50% and 15%, respectively, mainly due to source variability (Paper I). The carbon star luminosities also may be systematically overestimated by ∼30%, as a consequence of systematic errors in MSX A-band magnitudes (Section 5). Because the Table 1 sample is biased toward the highest-luminosity mid-IR sources in the LMC, the estimated values of LIR provide an indication of the peak luminosities reached by LMC carbon stars and RSGs (Section 6).
4. DISCUSSION
4.1. H ii Regions
We identify 78 sources (∼30% of the sample) as candidate H ii regions. A substantial fraction of these sources fall outside of the original Paper I H ii region classification "boxes" in one or both of the 2MASS–MSX color–color diagrams (Figure 2), even after accounting for updated 2MASS–MSX photometry, because the H ii regions studied spectroscopically in Paper I were selected so as to have a fairly narrow range of 2MASS–MSX colors resembling those of PNs. In addition, a substantial number of the sources in this region of JHK8 color–color space have upper limits in one or more 2MASS bands. Nevertheless, after applying "expanded" H ii region classification criteria (Table 3) and cross-checking with the SAGE PSC (Section 3.2.1), most are confirmed to be H ii regions. Only ∼25% of the H ii region classifications (19 objects) in Table 1 remain tentative.
Some of these objects may be PNs or pre-PNs. As noted in Paper I, many of the objects classified as H ii regions are difficult to distinguish from PNs purely on the basis of 2MASS–MSX colors. Indeed, of the objects that fall within the H ii region box on both of the color–color diagrams, all but two objects (MSX LMC 358 and 360) were previously classified as PNs by EVP01. However, all 11 of the EVP01 PN candidates selected for study in Paper I were revealed to be H ii regions associated with young OB stars. These reclassifications were based on Spitzer IRS spectral features, extensive surrounding nebulosity apparent in optical/IR images, large mid-IR source dimensions as inferred from IRS data, and/or exceedingly large luminosities (≳105 L☉).
Furthermore, our search of the literature reveals that the Table 1 sample includes only 1 PN, and this object, MSX LMC 561 (SMP 69, Sanduleak et al. 1978; see also Shaw et al. 2006), has the JHK8 colors of a C-rich AGB star. Hence, we are reasonably confident of the accuracy of the classifications of the majority of the candidate (tentatively classified) H ii regions in Table 1. Medium-resolution mid-IR spectroscopy and close examination of archival imagery would likely establish more firmly the nature of these objects.
4.2. RSGs and Oxygen-Rich AGB Stars
A total of 57 objects in Table 1 (22% of the sample) are identified (52) or tentatively identified (5) as oxygen-rich, mass-losing evolved stars. Of these, the vast majority (44 objects; 18% of the sample) are confirmed (42) or candidate (2) RSGs, most of which fall in the RSG classification box in both color–color diagrams. Only 13 confirmed (10) and candidate (3) O-rich AGB stars appear to be present in our sample. The total number of "O AGB" stars may be as high as 19, however, depending on the nature of the 3 stars with ambiguous "C/O AGB" classifications as well as 4 apparently "underluminous" RSGs (see below).
Included in the O-rich evolved star populations are MSX LMC 807 and 1171 (classified as "O AGB" and "O AGB?", respectively) and MSX LMC 1182 ("RSG"). These objects are OH/IR stars whose mid-IR silicate features are partially in absorption (Paper I; Section 3.2.1). The last object (IRAS 04553-6825) is particularly well studied, being the best-known LMC analog to the class of Galactic OH/IR supergiants typified by NML Cyg (e.g., van Loon et al. 1998a). Indeed, the IRS spectrum of MSX LMC 1182 (Paper I) bears an uncanny resemblance to the archival ISO spectrum of NML Cyg (J. H. Kastner et al. 2008, in preparation).
Four stars classified or tentatively classified here as RSGs on the basis of 2MASS-MSX colors, MSX LMC 506, 551, 591, and 813, have inferred bolometric luminosities of ∼3–6 × 10⁴L☉. Such luminosities are more consistent with bright AGB than RSG status. If these objects are indeed O-rich AGB stars (as opposed to very dusty RSGs), this would suggest that the large ratio of C-rich to O-rich AGB stars in our sample (see Section 4.3) may be in part a selection effect resulting from our minimum MSX A-band flux criterion combined with the "blue" mid-IR SEDs that are characteristic of O-rich AGB stars even at relatively high luminosity and mass-loss rate. Note that all three stars have A-band magnitudes not far from our cutoff of A ∼ 6.5. Hence, IR spectroscopic observations of fainter O-rich AGB candidates—i.e., objects with 8 μm fluxes <200 mJy and JHK8 or SAGE colors consistent with those of the O-rich AGB stars identified here and in Paper I—are needed in order to better establish the relative frequency of O-rich versus C-rich envelopes among the rapidly mass-losing AGB stars in the LMC.
Paper I established that four objects that reside within the O-rich AGB region (MSX LMC 412, 1150, 1677, and 1686) are in fact Mira variables located in the halo of the Milky Way. We have identified three more such candidate GMVs in the Table 1 sample, based primarily on their positions in the 2MASS–MSX color–magnitude diagrams (Figure 4). One of these objects, MSX LMC 1048 (RT Men), was included in a sample of GMVs studied by Jura & Kleinmann (1992) and was assigned a distance of 4.9 kpc. Another object, MSX LMC 362 (ZZ Men), was found by Wood & Bessell (1985) to have a radial velocity inconsistent with membership in the LMC. The third, MSX LMC 716, does not have a variable star designation but lies in the same region of JHK8 color–magnitude space as the other well-established GMVs. It is possible that a few additional RSG candidates are in fact GMV stars, given the overlap in the regions of color–color space occupied by these classes (over a dozen have ambiguous JHK8 color-based classifications; Table 1, column 10).
4.3. C-Rich AGB Stars
Carbon stars represent the single largest source population in our sample, with a total of 85 objects identified (68) or tentatively identified (17) among the 250 Table 1 sources. The total number of carbon stars may be as high as 91, depending on the nature of the three candidate O-rich AGB stars and the three AGB stars whose chemistries are ambiguous at present. The vast majority of the 88 Table 1 objects originally classified as OH/IR stars by EVP01 are reclassified here as carbon stars as a consequence of the application of revised Paper I IRS color–color criteria. As C-rich AGB stars with bluer JHK8 colors tend to overlap the O-rich AGB stars in color–color space (see Figure 2), and AGB stars exhibit considerable photometric variability, a small percentage of those objects lacking IRS spectra that are classified here as carbon stars may in fact be O-rich AGB stars. Furthermore, our cross-check against the available literature demonstrates that we had misclassified a few O-rich evolved stars as C stars on the basis of JHK8 colors; hence, there is a possibility that a few more such misclassifications remain. Ignoring this slight caveat, it appears that carbon stars constitute at least 26% and perhaps as much as 36% of the LMC's most luminous 8 μm sources, where the former percentage includes only the 65 high-confidence "C AGB" classifications.
Among the candidate carbon stars, the objects MSX LMC 83 and 435 are noteworthy for their very large inferred bolometric luminosities (Lbol ∼ 2.5 × 10⁴ L☉ and ∼3.3 × 10⁴ L☉, respectively). These stars may belong to the rare but important population of carbon stars that lie very near the AGB tip (e.g., Kastner et al. 1993; van Loon et al. 1998b, 1999b; Frost et al. 1998). Furthermore, the very red colors of MSX LMC 635 (IRAS 05278-6942)—a carbon star with Lbol ∼ 4 × 10⁴L☉ (Groenewegen et al. 2007) and 2MASS/MSX colors redder than those of the carbon stars surveyed in Paper I—indicate that more high-Lbol carbon stars may lurk among the very red, unclassified objects in Table 1 (see below).
4.4. Early-Type Emission-Line Stars with Dusty Disks
A number of MSX sources appear to be associated with dusty, early-type, emission-line stars. Several of these IR sources lie in the same general region of JHK8 color–color space—i.e., between the RSG and H ii region classification boxes—as the IR sources associated with the B[e] supergiants HD 268835 and HD 37974 (Kastner et al. 2006 and references therein). Like the MSX counterparts to these stars (MSX LMC 1326 and 890, respectively), three of these IR sources—MSX LMC 262, 323, and 1438—are associated with A, B, or B[e] supergiants. A handful of additional MSX sources in this general region of color–color space—i.e., MSX LMC 134, 198, 646, and 1296—also appear to be associated with optically luminous, early-type, and/or emission-line stars (Table 1). Another source in this color–color region, MSX LMC 344 (HD 35231), was tentatively identified as an O-rich evolved star by van Loon et al. (2005b), but its JHK8 colors and its association with a visually bright (HD catalog) star suggest that it may also be a dusty early-type emission-line object (we leave it unclassified at present). Meanwhile four other stars (MSX LMC 224, 461, 585, and 773) have the JHK8 colors of RSGs, but all have SIMBAD associations with early-type stars; MSX LMC 224 and 773 are associated with Wolf-Rayet (WR) stars.
Some or perhaps all of these objects could be luminous, early-type stars encircled by dusty disks. Provided the positional associations of any or all of the dozen or so Table 1 mid-IR sources that lie near early-type, emission-line stars can be confirmed, the "dusty disk" hypothesis is testable via mid-IR spectroscopy combined with modeling of the stars' IR SEDs (e.g., Kastner et al. 2006). Note that we classify MSX LMC 198, 461, 646, and 1296 as candidate H ii regions at present, due to their faint near-IR magnitudes (LMC B[e] supergiants and WR stars typically display JHK magnitudes ≲ 10), ambiguity in their SIMBAD spectral types, and/or a high probability of misidentification due to crowded fields.
4.5. Unclassified Objects
Out of our sample of 250 objects, only 10 (∼4% of the sample) neither fall into any of the Table 2 color–color regions nor have been previously classified in the literature. These objects (MSX LMC 321, 322, 344, 466, 837, 853, 1225, 1227, 1379, and 1570)—most of which are found above the H ii region boxes and/or to the right of the O AGB, C AGB, RSG, and GMV boxes in JHK8 color–color space (Figure 4)—therefore remain unclassified (designation "U" in column 11 of Table 1). The objects MSX LMC 466 and 1379 were classified as candidate OH/IR stars by EVP01; given that we find that most such candidate OH/IR stars are in fact C-rich AGB stars (Section 4.3), these two sources are most likely carbon stars with very high mass-loss rates. The sources MSX LMC 853 and 1570 are not present in the SAGE PSC and therefore may be H ii regions (Section 3.2.1). All of these unclassified objects are worthy of IR spectroscopy aimed at ascertaining their nature.
5. SPITZER IRAC/MIPS COLORS OF THE SAMPLE OBJECTS
In Paper I, we demonstrated how the IRS spectral classifications of luminous LMC mid-IR sources could be used to classify sources on the basis of Spitzer IRAC/MIPS (as well as 2MASS/IRAC/MIPS) color–color diagrams. To explore this potential, we used the SAGE IRAC and MIPS PSCs11 to identify counterparts to Table 1 sources. Specifically, we selected all SAGE point sources with IRAC 8.0 μm mag ⩽6.5 that have MIPS 24 μm counterparts, and then cross-correlated their positions with the 2MASS positions of the Table 1 sample, so as to identify those SAGE sources within 7'' (i.e., the approximate MIPS 24 μm PSF FWHM) of a Table 1 object. This procedure resulted in a subsample of 172 SAGE counterparts to Table 1 sources (Table 4). Most of the Table 1 objects not present in Table 4 are H ii regions that were rejected from the SAGE PSC as a consequence of their spatial resolution by IRAC (Section 3.2.1). Source variability likely accounts for most of the remaining omissions of Table 1 sources from the SAGE subsample. A plot of the difference between MSX A-band magnitude and IRAC 8.0 μm mag versus K − [8.0] color (Figure 6) illustrates the degree of 8 μm variability exhibited by the Table 4 sources. Figure 6 also shows an apparent systematic ∼0.3–0.4 mag discrepancy between MSX and IRAC 8 μm magnitudes. This discrepancy is likely a result of the systematically larger A-band fluxes in the version 6 MSX data (Section 2).

Figure 6. Comparison of MSX A-band and Spitzer IRAC 8.0 μm mag for the Table 1 stars for which SAGE PSC photometry is available (Table 4). The ordinate is K − [8.0] color and the abscissa is the difference between MSX A and IRAC 8.0 μm mag. Note the tight cluster of RSGs centered at K − [8.0] ∼ 1.5 and the looser distribution of objects with K − [8.0]>2. The latter group is dominated by AGB stars, which display larger amplitudes of variation than the RSGs. See text.
Download figure:
Standard image High-resolution imageTable 4. SAGE IRAC/MIPS Counterparts to Luminous LMC 8 μm MSX Sources
| SAGE (IRAC/MIPS) magnitudes | |||||||
|---|---|---|---|---|---|---|---|
| MSX LMC | Classa | SAGE ID | [3.6] | [4.5] | [5.8] | [8.0] | [24] |
| 7 | RSG | J050943.57-652159.3 | 7.39 | 7.33 | 7.04 | 6.48 | 4.13 |
| 43 | RSG | J050414.12-671614.4 | 6.20 | 6.29 | 6.02 | 5.45 | 3.40 |
| 44 | C AGB | J051110.46-675210.6 | 8.08 | 7.05 | 6.11 | 5.22 | 3.47 |
| 45 | C AGB | J051041.21-683606.6 | 9.26 | 8.04 | 7.00 | 6.03 | 4.41 |
| 46 | H ii? | J050354.56-671848.5 | 10.12 | 9.27 | 8.51 | 7.44 | 3.55 |
| 47 | C AGB | J051113.88-673616.2 | 8.64 | 7.66 | 6.66 | 5.78 | 4.19 |
| 48 | C AGB? | J050721.64-674742.9 | 9.09 | 8.17 | 7.29 | 6.42 | 4.03 |
| 83 | C AGB | J050854.15-690046.2 | 8.18 | 7.22 | 6.33 | 5.43 | 3.83 |
| 87 | C AGB | J051019.61-694951.5 | 9.14 | 8.34 | 7.53 | 6.67 | 5.27 |
| 91 | C AGB | J050338.54-685312.8 | 8.94 | 7.67 | 6.65 | 5.69 | 3.87 |
| 95 | C AGB | J050959.97-695609.4 | 7.79 | 7.12 | 6.54 | 5.93 | 4.94 |
| 108 | C AGB | J051056.78-693530.4 | 7.82 | 7.15 | 6.50 | 5.71 | 4.33 |
Note. aObject classification, from column 11 of Table 1.
Only a portion of this table is shown here to demonstrate its form and content. Machine-readable and Virtual Observatory (VO) versions of the full table are available.
Download table as: Machine-readable (MRT)Virtual Observatory (VOT)Typeset image
In Figure 7 we plot the positions of the SAGE counterparts to Table 1 sources on JHK8 color–color diagrams constructed from 2MASS J, H, K magnitudes and IRAC 8.0 μm mag. This figure demonstrates that the 2MASS+MSX JHK8 source classification regions (Table 3) are directly applicable to the combination of 2MASS (J, H, K) and IRAC (8.0 μm) data. The only significant modification to the Table 3 JHK8 classification criteria that is suggested by the figure is a "blueward" increase of the area bounding O-rich AGB stars by ∼1.0 mag in K − [8.0], so as to encompass three such sources that lie outside of the "O AGB" region.

Figure 7. JHK8 color–color diagrams for the Table 1 objects as constructed from available 2MASS and Spitzer (SAGE) data (Table 4), overlaid with 2MASS–MSX-based object classification regions (Table 3). Symbol meanings are as in Figure 3. Top: J − K vs. K − [8.0]; bottom: H − K vs. K − [8.0]. Objects for which 2MASS data are upper limits are not plotted.
Download figure:
Standard image High-resolution imageIn Figures 8–10, we display additional color–color diagrams that make use of Spitzer IRAC/MIPS data, IRAC data only, and 2MASS/IRAC data, respectively. In each of these diagrams, carbon stars and RSGs appear as distinct clusters, verifying the Paper I assertion that 2MASS-Spitzer color–color diagrams can be used to identify candidate C-rich AGB stars and RSGs among samples of luminous mid-IR point sources detected by IRAC/MIPS. Furthermore—in contrast to the extended region of overlap between C-rich and O-rich AGB stars seen in the JHK8 diagrams—those AGB stars whose O-rich nature has been firmly established via IRS spectroscopy appear as tight groupings, distinct from the C-rich AGBs, in both the IRAC/MIPS (Figure 8) and IRAC-only (Figure 9) color–color diagrams. A similar degree of separation between C-rich and O-rich objects was apparent in IRAC/MIPS color–color diagrams presented in Paper I and Lagadec et al. (2007), but the diagrams presented here include many more objects than the former, while the sample considered in the latter paper did not include RGSs and was not subject to a uniform minimum 8 μm luminosity criterion, as is the case here. Given the particularly sharp separation between C-rich and O-rich objects in Figure 8, we present in Table 5 a set of IRAC/MIPS color–color classification criteria for C-rich AGB, O-rich AGB, and RSG stars; the corresponding source classification regions are indicated in Figure 8.

Figure 8. Spitzer IRAC/MIPS [5.8] − [8.0] vs. [8.0] − [24] color–color diagram for the Table 4 objects. Symbol meanings are as in Figure 3. Boxes indicate the Table 5 IRAC/MIPS color criteria for classifying IR-luminous RSGs, C-rich AGB stars, and O-rich AGB stars in the LMC. The three RSGs near the bottom of the plot evidently have unreliable IRAC fluxes, perhaps as a result of detector saturation.
Download figure:
Standard image High-resolution image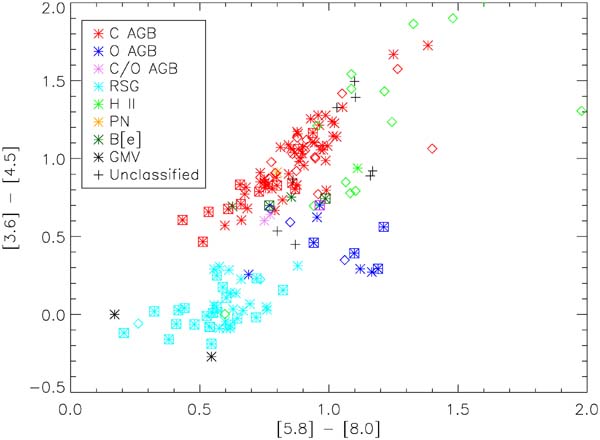
Figure 9. Spitzer IRAC [3.6] − [4.5] vs. [5.8] − [8.0] color–color diagram for the Table 4 objects. Symbol meanings are as in Figure 3.
Download figure:
Standard image High-resolution image
Figure 10. 2MASS J − K vs. Spitzer IRAC [3.6] − [4.5] color–color diagram for the Table 4 objects. Symbol meanings are as in Figure 3.
Download figure:
Standard image High-resolution image
Table 5. Luminous LMC Mid-IR Sources: IRAC/MIPS Color Classification Criteria
| Class | Criteria | |
|---|---|---|
| RSG | [−2.30 × ([5.8]−[8.0]) + 2.42] ⩽ [8.0]−[24] ⩽ [−2.30 × ([5.8]−[8.0]) + 4.22] | [0.49 × ([8.0]−[24]) −0.50] ⩽ [5.8]−[8.0] ⩽[0.49 × ([8.0]−[24]) −0.07] |
| O AGB | 2.5 ⩽ [8.0]−[24] ⩽ 2.85 | 0.925 ⩽ [5.8]−[8.0] ⩽ 1.25 |
| C AGB | [−2.30 × ([5.8]−[8.0]) + 2.09] ⩽ [8.0]−[24] ⩽ [−2.30 × ([5.8]−[8.0]) + 4.22] | [0.49 × ([8.0]−[24]) −0.06] ⩽ [5.8]−[8.0] ⩽ [0.49 × ([8.0]−[24]) +0.34] |
Download table as: ASCIITypeset image
Spitzer color–color diagrams such as those in Figures 8 and 9 may be of more limited use in identifying the more extreme and/or exotic evolved stars among samples of luminous mid-IR sources. Such objects (e.g., dusty B[e] stars) mainly "contaminate" the C-rich AGB group. However, the B[e] star IR sources do form a distinct grouping in the 2MASS/IRAC color–color diagram displayed in Figure 10. Furthermore, this color–color diagram is of particular interest due to its potential broad utility during the potential Spitzer "warm mission," wherein only the first two IRAC channels at 3.6 and 4.5 μm would generate scientifically useful image data. Indeed, comparison of Figures 7 and 10 demonstrates that the combination of 2MASS and "warm" Spitzer photometry at 3.6 and 4.5 μm will provide source classification capabilities similar to those provided by the JHK8 system.
6. SUMMARY AND CONCLUSIONS
To ascertain the nature of the most luminous mid-IR sources in the LMC, we have applied a revised version of the Buchanan et al. (2006) (Paper I) IR (JHK8) color classification scheme—which is based on the results of Spitzer IRS spectroscopy of a representative sample of ∼60 objects selected from among the catalog of ∼1650 2MASS/MSX sources compiled by EVP01—to all 250 EVP01 LMC sources satisfying the Paper I 8 μm flux limit (F8.3 ≳ 200 mJy; A ⩽ 6.5) for which 2MASS fluxes (or flux upper limits) are available. We have augmented, cross-checked, and revised (where necessary) the resulting JHK8 color-based classifications via a number of independent means (Section 3.2.1).
We thereby obtain the following results: 52 sources are confidently identified as evolved stars with oxygen-rich envelopes, where 42 of these are RSGs and 10 are O-rich AGB stars; 68 sources are confidently identified as C-rich AGB stars; 59 sources are confirmed as H ii regions; one source is a PN; 4 sources are dusty B[e] supergiants; and 7 objects are foreground Mira variables in the halo of the Milky Way. Another 46 objects are tentatively classified as either C-rich AGB (17), O-rich AGB (3), RSGs (2), H ii regions (19), or dusty, early-type, emission-line stars (B[e] supergiants or WR stars; five objects). Including these tentative classifications, we find the following proportions of objects among the LMC's 243 most luminous compact 8 μm sources (not including the seven foreground, Milky Way AGB stars): 35% (85 objects) are C-rich AGB stars, 5% (13 objects) are O-rich AGB stars, 18% (44 objects) are RSGs, 32% (78 objects) are compact H ii regions, and 4% (10 objects) are associated with early-type, emission-line stars (including one PN). Three additional sources are also most likely LMC AGB stars, but their circumstellar chemistries are unknown. Only ten objects (4%) cannot be classified or tentatively classified based on their positions in 2MASS–MSX color–color/color–magnitude diagrams and/or other means. Comparison of the classifications obtained via the JHK8 color–color and color–magnitude criteria (column 10 of Table 1) with classifications obtained via independent means (Section 3.2.1) indicates that the "success rate" of the JHK8 classification system is ∼70%.
The large ratio of C-rich to O-rich AGB stars (∼7:1, including confirmed and candidate objects of both classes) confirms that carbon stars are common, while O-rich AGB stars are quite rare among the most luminous 8 μm LMC sources. This result is consistent with the hypothesis that carbon stars form easily in low-metallicity environments, due to the relative ease of inverting the C/O ratio at the stellar surface (see review by Herwig 2005). The relatively small ratio of AGB stars to RSGs among our sample (∼2.3:1, including confirmed and candidate AGB stars and RSGs) is in keeping with the expectation that, in selecting the most luminous 8 μm sources among the population of highly evolved stars in the LMC, we are sampling the intermediate-to-high range of initial stellar masses.
We applied "bolometric corrections," that were established empirically in Paper I, to estimate the integrated IR luminosities of carbon stars and RSGs based on their K-band magnitudes. Because our sample includes all luminous 8 μm LMC sources with 2MASS counterparts, these estimates directly yield the peak IR luminosities reached by relatively "blue" RSGs (i.e., those with K − A ≲ 3) and those LMC carbon stars which have K − A ≲ 6. The most luminous such RSGs in the LMC therefore appear to be MSX LMC 1679 and 43, with estimated luminosities of 2.5 × 10⁵L☉ and 1.9 × 10⁵ L☉ respectively. These luminosities fall well short of that of the OH/IR supergiant MSX LMC 1182, with L⋆ ∼ 5 × 10⁵ L☉. It remains possible that a few more very luminous and highly obscured RSGs, as well as highly luminous (L⋆ ∼ 3 − 6 × 10⁴ L☉) carbon stars, lurk among the unclassified and/or tentatively classified objects in our sample.
Examination of Spitzer IRAC/MIPS (SAGE) photometry available for the Table 1 sources demonstrates that IRAC/MIPS color–color diagrams, augmented by near-IR survey data, should greatly facilitate the classification of the large number of luminous mid-IR point sources that have been and will be detected via Spitzer imaging of the Milky Way and external galaxies. In particular, we find that both IRAC-only ([3.6] − [4.5] versus [5.0] − [8.0]) and IRAC/MIPS ([5.8] − [8.0] versus [8.0] − [24]) color–color diagrams provide effective means to identify and distinguish between C-rich and O-rich evolved stars. These results argue for the broad application of such Spitzer IRS-based IR color–color classification techniques to other Local Group galaxies whose most luminous IR point sources are detectable and resolvable by 2MASS and/or Spitzer. In this way, one might determine and compare the number distributions of mid-IR-luminous sources spanning a wide range of metallicity and star-formation history, so as to understand the dependence of the populations of various classes of rapidly mass-losing evolved stars, as well as young and/or dusty massive stars, on galactic environment and star formation rate. Such work can continue unabated during the Spitzer "warm mission," via the combination of ground-based near-IR and short-wavelength IRAC photometry.
Further IR spectroscopic observations of the unclassified and tentatively classified sources among the sample of luminous 8 μm LMC sources studied here are required to determine unambiguously the nature of these sources. Meanwhile, IR spectroscopic observations of objects with 2MASS/MSX colors similar to those of the few O-rich AGB stars in Table 1, but with smaller 8 μm luminosities, would establish whether, and to what degree, our selection criteria bias our finding of a very large ratio of C-rich to O-rich AGB stars in the LMC.
The authors thank Bill Forrest and the referee, Jacco van Loon, for their extensive and incisive comments on this manuscript. Support for this research was provided by JPL/Caltech Spitzer Space Telescope General Observer grant NMO710076/1265276 to R.I.T. and NMO710076/1264276 to Valparaiso University and JPL. R.S. acknowledges additional support from a NASA Long Term Space Astrophysics award (NMO 710651, 399.20.40.06).
Facilities: Spitzer
Footnotes
- 8
The IRS was a collaborative venture between Cornell University and Ball Aerospace Corporation funded by NASA through the Jet Propulsion Laboratory and Ames Research Center.
- 9
- 10
- 11
The SAGE PSCs are available via the GATOR interface to the NASA/IPAC Infrared Science Archive (http://irsa.ipac.caltech.edu/applications/Gator/).