


ABSTRACT
We report on the discovery of three bright, strongly lensed objects behind Abell 1703 and CL0024+16 from a dropout search over 25 arcmin2 of deep NICMOS data, with deep ACS optical coverage. They are undetected in the deep ACS images below 8500 Å and have clear detections in the J and H bands. Fits to the ACS, NICMOS, and IRAC data yield robust photometric redshifts in the range z ∼ 6–7 and largely rule out the possibility that they are low-redshift interlopers. All three objects are extended, and resolved into a pair of bright knots. The bright i-band dropout in Abell 1703 has an H-band AB magnitude of 23.9, which makes it one of the brightest known galaxy candidates at z > 5.5. Our model fits suggest a young, massive galaxy only ∼60 million years old with a mass of ∼1010 M☉. The dropout galaxy candidates behind CL0024+16 are separated by 2 5 (∼2 kpc in the source plane), and have H-band AB magnitudes of 25.0 and 25.6. Lensing models of CL0024+16 suggest that the objects have comparable intrinsic magnitudes of AB ∼27.3, approximately one magnitude fainter than L* at z ∼ 6.5. Their similar redshifts, spectral energy distribution, and luminosities, coupled with their very close proximity on the sky, suggest that they are spatially associated, and plausibly are physically bound. Combining this sample with two previously reported, similarly magnified galaxy candidates at z ∼ 6–8, we find that complex systems with dual nuclei may be a common feature of high-redshift galaxies.
Export citation and abstract BibTeX RIS
1. INTRODUCTION
Deep observations and surveys with the Hubble Space Telescope (HST), such as GOODS (Giavalisco et al. 2004; Dickinson et al. 2004), the HUDF (Beckwith et al. 2006), the HUDF05 (Oesch et al. 2007), and the HUDF parallel observations (Bouwens et al. 2004a), have greatly enriched our knowledge of the distant universe, enabling the discovery of more than 600 i775-band dropouts (i-dropout; Bouwens et al. 2006, 2007), and eight z850-band dropouts (z-dropout; Bouwens et al. 2008) which are believed to be galaxies at z ∼ 6 and 7, respectively. An L* galaxy of M = −20.3 at z ∼ 6 exhibits an apparent magnitude ∼26.8 (AB, and hereafter); consequently, the majority of z > 5.5 galaxies are fainter than AB = 26.
Bright high-redshift galaxies are rare. Ten i-dropouts brighter than AB = 25.5 were found in ∼400 arcmin2 of GOODS, HUDF, and HUDF parallel fields (Bouwens et al. 2006, 2007). Two of them have been confirmed to be high-redshift objects spectroscopically (Bunker et al. 2003; Stanway et al. 2004). In a survey of the Subaru Deep Field of 767 arcmin2 (Shimasaku et al. 2005; Taniguchi et al. 2005), 18 i-dropout galaxies were spectroscopically confirmed to be at z ∼ 5.7, and nine at z ∼ 6.6, but the brightest among them is only at magnitude of 25.4. In a recent survey that covers 1 deg2 in the field of the Subaru/XMM-Newton Deep Survey (Ouchi et al. 2008b), 17 Lyα emitters (LAEs) at z ∼ 5.7 were found, of which only one is brighter than AB = 25.5 in the z band. At least one bright LAE has been found at z ∼ 6.6 (z-band magnitude 25.4, narrow band (921nm) magnitude 23.5; Ouchi et al. 2008a). Combining the results of these three surveys, the brightest z ∼ 6 candidate over 5000 arcmin2 is at AB = 24.5 (in broad bands–LAEs are intrinsically brighter in a narrow band).
Gravitational lensing by massive galaxy clusters enables the detection of high-redshift galaxies that are fainter than can be found even in very deep surveys. In addition, lensed galaxies can be resolved spatially and, if bright enough, can be candidates for spectroscopy (Hu et al. 2002; Kneib et al. 2004; Pelló et al. 2004; Schaerer & Pelló 2005; Richard et al. 2006; Frye et al. 2008; Bradley et al. 2008; Bouwens et al. 2009; Richard et al. 2008). The number of z ≳ 6 candidates reported, however, has varied considerably depending on how aggressive the selection criteria are (and consequently how reliable the detected sources are: see, e.g., discussions in Bouwens et al. 2009). The HST images of clusters are the best in terms of spatial resolution and photometric accuracy, thus permitting the most reliable selections of high-redshift galaxies. One salient example is the three i-dropout arclets in Abell 2218 found by Kneib et al. (2004). These arclets represent different views (multiple images) of the same source at z = 6.75 ± 0.1. Bouwens et al. (2003) found an i-dropout object in the field of cluster RDS1252 − 29 as bright as AB = 24.2, and follow-up spectroscopy (Dow-Hygelund et al. 2005) confirmed it as a Lyman-break galaxy at z = 5.515 and revealed stellar absorption lines in the continuum. Recently, Bradley et al. (2008) discovered a galaxy candidate at z ∼ 7.6 in the field of Abell 1689 that is spatially resolved and has an observed H-band magnitude of 24.7. The cluster lensing magnifies this galaxy (A1689-zD1) by a factor of ∼10.
Taking advantage of the NICMOS data of 21 arcmin2 over 11 galaxy clusters (including Abell 1689), Bouwens et al. (2009) searched for strongly lensed z-dropout galaxies at z ≳ 7 and found that A1689-zD1 is the only robust candidate in these fields. This suggests that bright high-redshift galaxies may be rare in cluster fields, even given the smaller field size of cluster regions. Since the amount of NICMOS data available over cluster fields is still very limited, there is reason to look at the surface density of such objects over larger areas and at somewhat lower redshifts, in order to overcome the effect of small number statistics.
The purpose of this paper is to report on the results of a search for bright (H-band magnitude ⩽25.6), highly magnified i- and z-dropout galaxies over a larger area than was used by Bouwens et al. (2009). Such sources provide us with a unique opportunity to examine the properties of lower-luminosity galaxies in detail. The lower-luminosity galaxy population is of great interest because it appears to dominate the UV luminosity density, SFR density, and production of ionizing (λ0 ≲ 912 Å) photons (Yan & Windhorst 2004; Yoshida et al. 2006; Beckwith et al. 2006; Bouwens et al. 2006, 2007; Oesch et al. 2007; Reddy et al. 2008; Frye et al. 2008; Chen et al. 2009). In particular, we consider ∼4 arcmin2 of additional search area over CL0024+16 and CL1056 − 03 obtained in a recent NICMOS program HST-GO10874 (PI: W. Zheng). These areas were not included in the z-dropout search of Bouwens et al. (2009).
The plan for this paper is as follows. In Section 2, we describe the observational data. In Section 3, we outline our search criteria and summarize the results of our search for bright z ∼ 6–7 galaxies. In Section 4, we use stellar-population modeling and the available lensing models to remark on the physical properties of the high-redshift galaxy candidates we are examining, and in Section 5, we summarize our results.
2. OBSERVATIONS
A summary of the HST ACS, WFPC2, and NICMOS imaging observations used here to search for z ∼ 6–7 i- or z-dropout galaxies is given in Table 1. Of particular interest are new NICMOS observations acquired over CL0024+16 (two NICMOS NIC3 pointings) and CL1056 − 03 (three NICMOS NIC3 pointings) from the program HST-GO10874. These observations were taken to better quantify the volume density of faint galaxies at z ∼ 7. Each NICMOS image is only 52'' × 52'' in size and covers just a portion of the total area with deep ACS data over these two clusters.
Table 1. HST NICMOS Data Around Massive Galaxy Clusters Used to Search for i- and z-Dropout Galaxies at z ∼ 6–7
| 5σ Depth AB Magnitudea | ||||||
|---|---|---|---|---|---|---|
| Name | Area (arcmin2) | i775b | z850 | J110 | H160 | Refc |
| New i- and z-Dropout Search Data (HST GO10874) | ||||||
| CL0024+16 | 1.5 | 27.8 | 27.4 | 26.7 | 26.6 | (1) |
| CL1056 − 03 | 2.2 | 27.5 | 27.3 | 26.6 | 26.5 | (1) |
| i-Dropout Search Datad | ||||||
| MS1358+61 | 1.4 | 28.0 | 27.5 | 26.8 | 26.7 | (2) |
| CL0024+16 | 1.4 | 27.8 | 27.4 | 26.8 | 26.7 | (2) |
| Abell 2218 | 1.2 | 27.9 | 27.6 | 26.8 | 26.7 | (2) |
| Abell 2219 | 1.4 | 27.5 | 27.2 | 26.8 | 26.7 | (2) |
| Abell 2390 | 1.5 | 26.6 | 26.9 | 26.8 | 26.7 | (2) |
| Abell 2667 | 1.5 | 26.5 | 26.9 | 26.8 | 26.7 | (2) |
| Abell 1689 | 5.7 | 28.1 | 26.8 | 26.4 | ⋅⋅⋅ | (3) |
| Abell 1703 | 3.1 | 27.9 | 26.7 | 26.0 | ⋅⋅⋅ | (4) |
| 1E0657 − 56e | 2.7 | 27.6 | 27.2 | 26.0 | ⋅⋅⋅ | (4) |
| Abell 1835 | 0.7 | 27.1 | 27.2 | ⋅⋅⋅ | 26.7 | (4) |
| AC114 | 0.7 | 27.1 | 27.2 | ⋅⋅⋅ | 26.7 | (4) |
Notes.
a5σ limits assume a 03-diameter aperture for ACS/WFPC2 and 06 diameter aperture for NICMOS. The source photometry in this paper uses a larger aperture, therefore leading to shallower limiting magnitudes.
bThe depth of the deepest single-band optical (⩽0.8 μm) image available over the cluster. Note that some of the clusters listed here have very deep data in two or more bands (particularly for MS1358+61, CL0024+16, Abell 2218, Abell 1689, Abell 1703), so the effective depth of the combined optical data is often >0.4 magnitude deeper than tabulated here.
cReferences: (1) This paper, (2) Richard et al. 2008, (3) Broadhurst et al. 2005; Bradley et al. 2008, (4) Bouwens et al. 2009.
dThese data were previously used by Bouwens et al. (2009) to search for z and J dropout galaxies. We use these data to search for bright i dropouts.
eThe "Bullet" cluster.
Download table as: ASCIITypeset image
The NICMOS/NIC3 images of CL0024+16 were obtained in 2007 July, with exposures of 9.4 ks in both the F110W and F160W band. The NICMOS/NIC3 images of CL1056 − 03 were obtained in 2007 January and December, and 2008 January, with exposures of 6.6–8 ks in both the F110W and F160W bands. We used a custom pipeline written at the University of California Santa Cruz to process the NICMOS images ("nicred;" Magee et al. 2007) into a final mosaic. The 5σ limiting magnitudes for these data are approximately 26.7.
CL0024+16 was observed in 2004 November in six broad optical bands: F435W, F475W, F555W, F625W, F775W, and F850LP, including 16.3 ks in the z band and 10.1 ks in the i band. CL1056 − 03 was observed in 2004 March in the F606W, F775W, and F850LP bands, including 17.7 ks in the z band and 17.3 ks in the i band. All the ACS science images over these fields were processed with our pipeline APSIS (Blakeslee et al. 2003) and registered with the available NICMOS data.
We retrieved archival Spitzer/IRAC images of the field of Abell 1703 and CL0024+16, observed in 2007 January and 2003 December, respectively. The mosaic images are in the form of Post-BCD (Basic Calibrated Data), produced by the Spitzer pipeline calibration MOPEX. For Abell 1703, the exposure times were 6.2 ks for both the 3.6 and 4.5 μm bands, reaching a 5σ limiting magnitude of ∼24.7. For CL0024+16, the exposure times were 2.7 ks in the 3.6 μm band and 4 ks in the 4.5 μm band, reaching a 5σ limiting magnitude of ∼24.5.
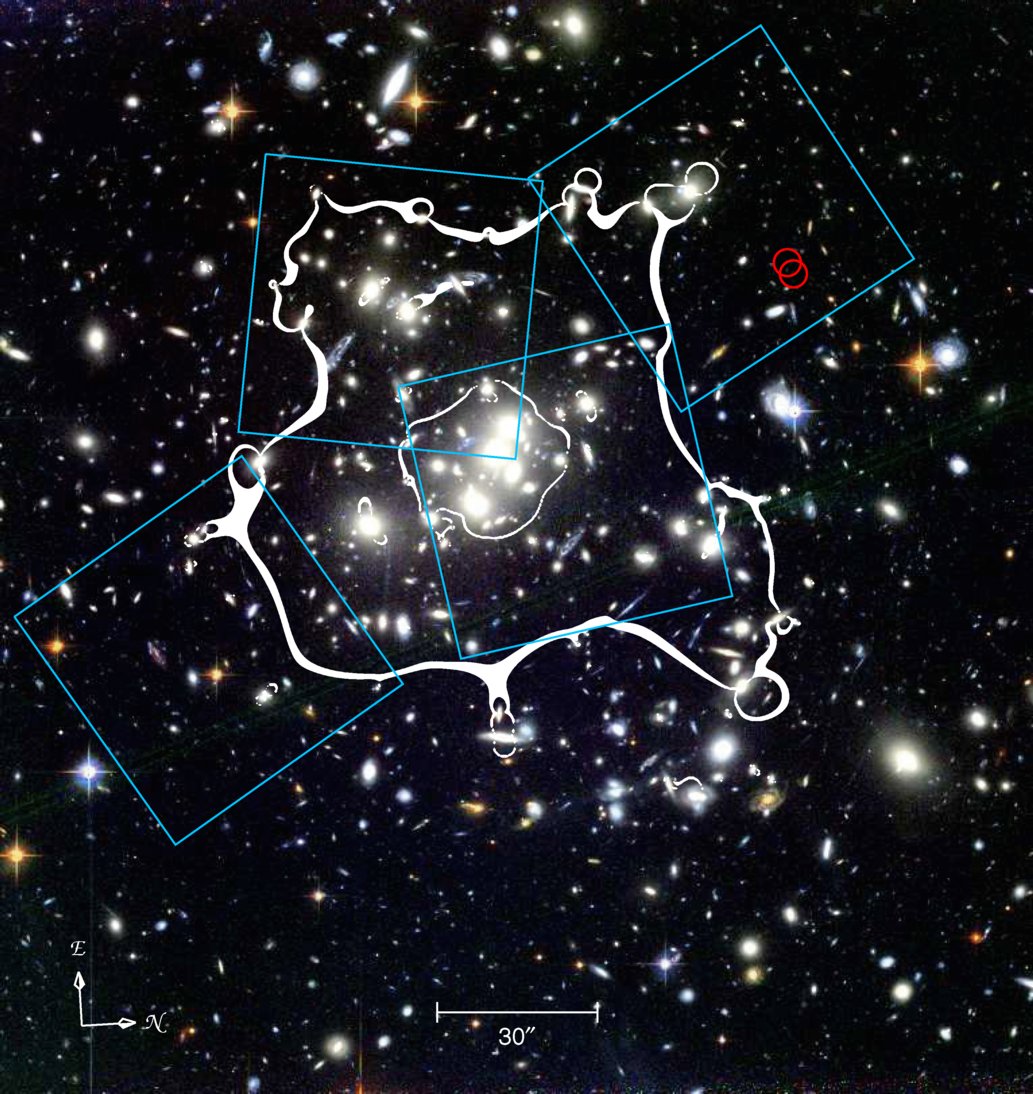
We also searched for bright z ∼ 6 i-dropouts in the cluster data considered by Bouwens et al. (2009), who had used these data to search for z- and J-band dropouts at z ⩾ 7 and include NICMOS observations over 11 high-redshift clusters (Abell 1689, Abell 1703, Abell 1835, Abell 2218, Abell 2219, Abell 2390, Abell 2667, AC114, CL0024+16, 1E0657 − 56, and MS1358+61). Most of these clusters have deep ACS and WFPC2 optical data to ensure that the candidates we select at z ∼ 6 as i-dropouts are not detected in the optical to very faint limits. We refer to Bouwens et al. (2009) for more details on the reductions and processing of those data. Since we will be reporting on a bright z ∼ 6 candidate behind Abell 1703, we will summarize its ACS + NICMOS observations as well. NICMOS/NIC3 images of Abell 1703 were obtained in 2007 July, with exposures of 2.6 ks in both the F110W and F160W band. The cluster was observed at three other positions in the F110W band (see Figure 1).

Figure 1. Composite color (r625, i775, z850) ACS image of Abell 1703. The z = 6 critical curves (magnification factor μ>75) for the lensing model of Limousin et al. (2008) are overplotted. The positions of the shallow (one orbit each) NICMOS/NIC3 F110W and F160W images are illustrated with the four blue boxes and an orange box, respectively. The location of A1703-iD1 is marked with a red circle.
Download figure:
Standard image High-resolution imageIndependently as part of another program to search for high-redshift galaxies, we have acquired deep IR images of these cluster fields using a wide variety of different ground-based telescopes (Gemini-North/NIRI, Magellan/PANIC, and the VLT/ISAAC). Abell 1703 was observed with the Gemini-N/NIRI on 2003 June 11, with a total exposure time of 7.6 ks in the J band, and a 5σ limiting magnitude of 23.3. The Magellan/PANIC observations of CL0024+16 were made in 2003 October 3 and 5: the J-band observations took 17.8 ks, and the image reaches a 5σ limit of AB ∼26. The infrared images were processed with the IRAF/XDIMSUM package. Images taken on each night and with the same instrument configuration were sky-subtracted, shifted by the amount determined using the positions of a bright point source in dithered images, and combined. We select dropout galaxies when they are not detected beyond 2σ level, and the color decrements are more than two magnitudes. While these ground-based observations are shallower than the NICMOS data, they were used to tentatively identify the i-dropout galaxies. In a forthcoming paper (W. Zheng et al. 2009, in preparation) we will be presenting a few of these z-dropout galaxies from these wider-area ground-based data
3. SELECTION OF BRIGHT I- AND Z-BAND DROPOUTS
Source catalogs were produced using SExtractor (Bertin & Arnouts 1996). We coadded the available NICMOS images for the clusters under study to create the detection image (Szalay et al. 1999). We then measured the fluxes on each of the ACS, WFPC2, and NICMOS images using the same scalable apertures, after PSF-correcting the higher resolution ACS and WFPC2 images to match the NICMOS images. As in Bouwens et al. (2009), we measure colors from smaller scalable apertures (Kron factor of 1.2; Kron 1980), typically ∼03. We then correct the fluxes measured in these smaller apertures to total magnitudes by comparing the light inside a larger scalable aperture (Kron factor of 2.5) of ∼06, on the detection image to that inside a smaller aperture.
Our color selection is based on the magnitudes measured in small-scalable apertures. The selection criteria for i-dropouts are similar to that of Giavalisco et al. (2004) and Bouwens et al. (2006), but with some variations:

or

where ∧ represents the logical AND symbol. In addition, we require that objects are not detected (<2σ) in all bluer bands to exclude lower-redshift interlopers. Also, selected dropout galaxies must have a star/galaxy index <0.8 and an image dimension greater than three pixels to exclude stars and artifacts.
The selection criterion for the z-dropouts (Bouwens et al. 2008) is

Also, we require that objects are nondetected in all the bands shortward of 8500 Å.
In cases of nondetection in a shorter-wavelength band, we define the color decrement by setting the flux in that band to be zero, with an error that is equal to the 1σ detection limit. The nondetection in the r, g, V bands is important, as some sources are weakly detected in some of these bands. We found five other objects that were weakly detected in the shorter-wavelength bands. Their large i − z color decrements are probably produced by a Balmer decrement instead of a Lyα edge, and therefore the objects are at low redshift, e.g., z ∼ 1. Without deep images in the shorter-wavelength bands, these objects may be considered as "high-redshift candidates." This may explain why some other searches yield a considerable number of dropout galaxies.
Finally, we set an H-band magnitude limit of 25.6 to identify only the brightest sources in our survey. Applying the above selection criteria across our search fields, we identify three new dropout galaxies in total. One source, called A1703-iD1, is found in Abell 1703 (see also Richard et al. 2009, who also report on this source) and two other sources, CL0024-iD1 and CL0024-zD1, are found over CL0024+16. We also identified the z ∼ 6.5 i-dropout in Abell 2218 (Kneib et al. 2004) and the z ∼ 7.6 z-dropout over Abell 1689 (Bradley et al. 2008). No bright dropouts are found in CL1056 − 03 or any other clusters. Our three new galaxy candidates are given in Table 2, along with the previously known sources. The positions of these sources in Abell 1703 and CL0024+16 are shown with the red circles in Figures 1 and 2. Their cutout stamps are given in Figures 3 and 4.

Figure 2. Composite color (r625, i775, z850) ACS image of CL0024+16. The z = 6.5 critical curves (magnification μ>200) for the lensing model of Zitrin et al. (2009) are overplotted. The blue boxes show the regions with deep NICMOS/NIC3 F110W imaging observations. Two of these NIC3 pointings are from Richard et al. (2008) and two are from HST program GO-10874. The positions of the two dropout galaxies CL0024-iD1 and CL0024-zD1 are marked with the red circles.
Download figure:
Standard image High-resolution image
Figure 3. Cutout images of the i-dropout galaxy A1703-iD1. Each cutout is 15'' on a side. The source is detected in the ACS z band and NICMOS F110W and F160W bands, but not in the five optical bands at shorter wavelengths. The χ2 image formed from the F435W, F475W, F555W, F625W, and F775W optical bands (Szalay et al. 1999) is presented here and labeled "Det." The J-band data taken with the Gemini North telescope are also shown. This source is clearly resolved into two extended nuclei. With an H-band magnitude of 23.9, it is one of the most luminous galaxy candidates at z ∼ 6 ever found.
Download figure:
Standard image High-resolution image
Figure 4. Cutout images of the i-dropout galaxies CL0024-iD1 (marked with a red circle) and CL0024-zD1 (green circle). Each cutout is 15'' on a side. The χ2 image formed from the F435W, F475W, F555W, F625W, and F775W optical bands (Szalay et al. 1999) is also presented here and labeled "Det." CL0024-iD1 is detected in the ACS z-band, NICMOS F110W and F160W bands, and the IRAC 3.6 μm and 4.5 μm bands while CL0024-zD1 is detected in the NICMOS F110W,F160W and the IRAC 3.6 μm band. Neither source is detected in the five ACS optical bands at shorter wavelengths. The J-band data taken with the Walter Baade (Magellan) telescope are also shown. In the J110 band, each source displays a dual-core structure, and the four components are well aligned.
Download figure:
Standard image High-resolution imageTable 2. Photometry of Bright z ≳ 6 Dropout Objects in Cluster Fields (AB Magnitude)
| Name | αJ2000 | δJ2000 | r625 | i775 | z850 | J110 | H160 | 3.6 μm | 4.5 μm |
|---|---|---|---|---|---|---|---|---|---|
| A1703-iD1a | 13 15 01.41 | +51 48 25.9 | >28.2 | 26.8 ± 0.3 | 24.2 ± 0.1 | 24.0 ± 0.1 | 23.9 ± 0.1 | 23.1 ± 0.3 | 23.5 ± 0.4 |
| CL0024-iD1a | 00 26 37.78 | +17 10 40.0 | >28.1 | >27.9 | 26.0 ± 0.2 | 25.1 ± 0.1 | 25.0 ± 0.1 | 24.4 ± 0.2 | 24.4 ± 0.3 |
| CL0024-zD1a | 00 26 37.93 | +17 10 39.0 | >28.1 | >27.9 | 27.3 ± 0.8 | 26.0 ± 0.2 | 25.6 ± 0.2 | 24.5 ± 0.5 | 24.8 ± 0.5 |
| A1689-zD1b | 13 11 29.96 | −01 19 18.7 | >27.8 | >27.8 | >27.5 | 25.3 ± 0.1 | 24.7 ± 0.1 | 24.2 ± 0.3 | 23.9 ± 0.3 |
| A2218-iD1c,d | 16 35 54.40 | +66 12 32.8 | >27.6 | >27.2 | 25.1 ± 0.1 | 24.3 ± 0.1 | 24.1 ± 0.1 | 23.7 ± 0.3 | 23.9 ± 0.3 |
Notes.
aThis paper. These two sources are only 25 apart, have similar redshifts, and are probably spatially associated (See Tables 3 and 4 and the text).
bBradley et al. (2008).
cEgami et al. (2005). The r- and i-band magnitudes are from our own measurements.
dComponent b. The other component (a) has a similar magnitude, but its IRAC fluxes are unavailable because of contamination from a neighboring source.
Download table as: ASCIITypeset image
For our high-redshift candidates, we used the available Spitzer/IRAC data to measure fluxes at 3.6 and 4.5 μm. Since these data have a considerably larger PSF than the ACS/NICMOS data, this poses a challenge for accurate photometry. First, the IRAC PSF (∼16 at 3.6 μm) is considerably larger than the apertures used in the HST images (typically ≲ 05 in radius). We used an aperture size of 25 diameter, and then applied corrections of 0.56 and 0.6 mag for the 3.6 μm and 4.5 μm band, respectively, to account for flux outside of the aperture. These corrections were derived for stellar profiles (see, e.g., Bradley et al. 2008). In the field of A1703-iD1, there are two nearby sources of comparable brightness approximately 2'' away (Figure 3). We ran the task Galfit (Peng et al. 2002) to deblend the source fluxes with fixed source positions and a standard PSF profile of FWHM = 16. The derived magnitudes are presented in Table 2.
A1703-iD1 is a prominent i-dropout object, with a z-band magnitude AB = 24.2. As shown in Figure 3, it is well detected in the ACS z-band and NICMOS J and H bands, but not in the i-band and the other bands at shorter wavelengths. The object is detected in the Gemini-N image in the J band, with a magnitude of 24.2 ± 0.4. Our confidence that this source is a galaxy at z ∼ 6 rather than a lower-redshift object (Stanway et al. 2005) is largely motivated by the source's large color decrement of >2.6, which is twice the threshold in a normal selection (1.3–1.5). The possibility that this source is a dusty galaxy at lower redshift is ruled out as the source is roughly equally bright in the z- and J-bands, and entirely undetected in the r606- (r) and i-bands, which is clearly a sign of a break in the spectral energy distribution (SED) instead of a gradual decrease toward bluer wavelengths. The source is resolved into two components (magnitudes 24.3 and 24.9; Figure 3) separated by ∼045. The only other objects with such colors are T-dwarfs, which can be ruled out by the fact that the source is extended. The FWHM for each component is ∼04, which is four times the ACS resolution. This source is detected at low significance (<2σ) in the F435W band (magnitude 27.7 ± 0.5), but not in an overlapping band F475W (>28.5) and F555W and F625W. This weak detection is probably just an upward statistical fluctuation and does not affect the SED fitting results noticeably.
The two sources in CL0024 pose an interesting question. These sources, CL0024-zD1 and CL0024-iD1, are separated by only 25. As we shall see below they have very similar redshifts and SEDs, and this small separation corresponds to just 2 kpc in the source plane. Thus they are likely to be spatially associated. This will be discussed further below, but for now we discuss their individual properties.
The source CL0024-iD1 is resolved in both the J- and H-band images. Its NICMOS J-band magnitude is 25.1 (Table 2). An independent check comes from our Magellan/PANIC image data which gives 25.8 ± 1.1, which is consistent with the NICMOS measurement. The source CL0024-zD1 appears to be marginally resolved into two components in the J110 band image (Figure 4), but not in the H160 band. In the Magellan images, its magnitude is 26.3 ± 1.3, which again is consistent with the NICMOS data. The detection in the 4.5 μm band is marginal, and appears to be consistent with background fluctuations.
It is interesting to note that A1689-zD1 (z ∼ 7.6; Bradley et al. 2008) also consists of two components separated by ∼1 kpc in the source plane. The apparent frequency of high-redshift galaxies with two bright components is perhaps not surprising, in that we expect to see bright star-bursting galaxies imbedded in massive halos that are merging at this very early epoch.
Because of the long time baseline of our ACS, NICMOS, IRAC, and ground-based observations, none of these sources are likely to be supernova outbursts or transiting objects. In addition, because the sources are detected in multiple bands, it is highly unlikely that they are spurious detections.
4. DISCUSSION
Current studies of the UV luminosity function (LF) at z ∼ 2–6 suggest that lower-luminosity galaxies provide the dominant contribution to the overall luminosity density in the UV, the stellar mass density, the ionizing photon budget necessary for reionization, and the build-up of metals (Yan & Windhorst 2004; Yoshida et al. 2006; Beckwith et al. 2006; Bouwens et al. 2006, 2007; Reddy et al. 2008; Chen et al. 2009). As such, clearly it is important to quantify the properties of this faint population. Unfortunately, this can be difficult to do in the field, due to the integration times required and due to crowding issues in deep IRAC images. This makes the present sample of highly magnified galaxy candidates at z ∼ 6–7 very useful for investigating the properties of lower-luminosity galaxies at high redshifts.
4.1. Intrinsic Luminosity
To determine the intrinsic properties of the high-redshift galaxy candidates identified in our search, it is necessary to model the effect of gravitational lensing on these sources. Fortunately, both clusters behind which our galaxy candidates lie have been the subject of substantial modeling efforts. Abell 1703 (z = 0.258) is known to have a large number (i.e., 16) of multiply lensed galaxies and has been the subject of detailed modeling (Limousin et al. 2008). CL0024+16 (z = 0.396) has also been the subject of several detailed efforts to model the lensing (Kneib et al. 2003; Jee et al. 2007; Natarajan et al. 2009; Zitrin et al. (2009). We adopt the model of Zitrin et al. (2009) as our fiducial lensing model, but compare with other models to gauge the approximate uncertainties. As shown in Table 4, we adopt a magnification at our source position of 3.1 for A1703-iD1, 6.3 for CL0024-iD1, and 6.2 for CL0024-zD1. For CL0024+16, a wide range of magnification exists in the literature. The model of Natarajan et al. (2009) yields a magnification of 2 and that of Jee et al. (2007) predicts a magnification of 17–20. The low magnification value probably is arose because Natarajan et al. (2009) assume the cluster mass profile as singular isothermal, and they used five multiple images of the same source near the center (as well as weak lensing constraints). The recent work of Zitrin et al. (2009) takes advantage of high-quality, multiband ACS data and identifies 11 sets of multiple images covering a wide range of background redshift 0.5 < z < 4.5, so that the gradient of mass profile slope can be meaningfully constrained and hence more reliable magnification measurements are obtained. While we have adopted perhaps the most reliable magnification model, the actual magnification factors in current lensing models are sensitive to details in the mass distribution of the foreground cluster and thus subject to significant uncertainties.
Adopting the photometric redshifts for A1703-iD1, CL0024-iD1, and CL0024-zD1 that we will determine in the next section (i.e., z = 6.0, z = 6.5, and z = 6.6, respectively), we estimate that their amplification factors are approximately 3.1, 6.3, and 6.2. respectively. This implies intrinsic J-band luminosities for these sources of AB = 25.2, 27.1, and 28.0, respectively. The two fainter dropout sources in CL0024+16 are estimated to have intrinsic magnitudes fainter than L* after demagnification and would not likely have been found in even the NICMOS data to the HUDF (Bouwens et al. 2004b; Thompson et al. 2005). A1703-iD1, on the other hand, appears to be quite bright, having an intrinsic magnitude of ∼25.
4.2. Spectral Energy Distribution and Photometric Redshift
We performed fits to the multiband photometry of these three sources by using the stellar-population models of Bruzual & Charlot (2003). For all of the models, we assume a simple stellar population (single-burst; SSP) with a Salpeter (1955) initial mass function with mass cutoffs of 0.1 and 100 M☉. We explored models with both solar (Z = 0.02) and subsolar (Z = 0.0004 = Z☉/50) metallicities. The models use the obscuration law of Calzetti et al. (2000) and are corrected for Lyman-series line-blanketing and photoelectric absorption following the procedure of Madau (1995). In the stellar-population model fits, we constrain the stellar age to be less than the age of the universe at the fit redshift (e.g., 0.8 Gyr at z = 6.5).
The best-fit stellar-population models are shown in Figures 5–7 and the parameters are given in Table 3. While the nondetections are shown in these figures as 2 σ upper limits, we used the measured fluxes, not the limits, to fit the SEDs. For both solar and subsolar metallicities, we found acceptable fits for the models. IRAC photometry places important constraints on the stellar-population models as it provides the rest-frame optical magnitudes for high-redshift galaxies (Labbé et al. 2006). Using the ratio of UV-optical luminosity one can estimate the galaxy age with considerable accuracy. Considering the uncertainties associated with the mass models themselves and in potential reddening factors, the real errors are likely somewhat higher than those listed in Table 3.
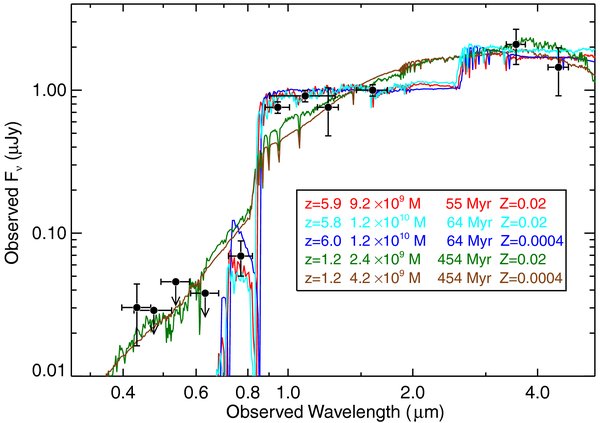
Figure 5. Best-fit stellar-population models for A1703-iD1. The stellar masses are intrinsic values, corrected for the magnification factor of 3 as predicted by the lensing model of Limousin et al. (2008). The vertical bars denote the 1σ flux uncertainties and the horizontal bars represent the filter bandwidths. Nondetection in a given band is marked with a 2σ upper limit in flux and a down arrow. The deep ACS data eliminate lower-redshift sources. The red and blue curves represent the z ≳ 5 fits with solar metallicity (Z = 0.02) and subsolar (Z☉/50) metallicity, respectively, and the cyan curve for the z = 5.827 fits with solar metallicity. The green and brown curves are for z ≲ 4 fits and have high values of χ2ν.
Download figure:
Standard image High-resolution image
Figure 6. Best-fit stellar-population models for CL0024-iD1. The stellar masses are intrinsic values, corrected for the magnification factor of 6.3 as predicted by the lensing model of Zitrin et al. (2009). The green and brown curves are for z ≲ 4 fits and have high values of χ2ν. See the caption of Figure 5.
Download figure:
Standard image High-resolution image
Figure 7. Best-fit stellar-population models for CL0024-zD1. The stellar masses are corrected for the magnification factors of 6.2 as predicted by the lensing model of Zitrin et al. (2009). The z ≳ 5 fit gives a much lower value of χ2ν ∼ 1 than for the z ≲ 4 fit where χ2ν ∼ 2.5. Also see the captions of Figures 5 and 6.
Download figure:
Standard image High-resolution imageTable 3. Best-fit Stellar-Population Model Results
| Object | zphot | zforma | Massb (109 M☉) | Agec (Myr) | AV | χ2ν |
|---|---|---|---|---|---|---|
| High Redshift, Solar Metallicity (Z = 0.02) | ||||||
| A1703-iD1 | 5.9 ± 0.1 | 6.2 | 9.2 ± 3.2 | 55+17−27 | 0.0 ± 0.2 | 1.2 |
| A1703-iD1 | 5.827 | 6.2 | 12 ± 0.6 | 64+10−9 | 0.0 ± 0.1 | 1.1 |
| CL0024-iD1 | 6.4 ± 0.1 | 6.7 | 1.5 ± 0.1 | 43+15−17 | 0.0 ± 0.1 | 0.7 |
| CL0024-zD1 | 6.5 ± 0.3 | 7.1 | 2.0 ± 0.4 | 81+41−72 | 0.0 ± 0.1 | 0.1 |
| High Redshift, Subsolar Metallicity (Z = 0.0004) | ||||||
| A1703-iD1 | 6.0 ± 0.1 | 6.5 | 12 ± 4.6 | 64+41−44 | 0.2 ± 0.2 | 1.1 |
| A1703-iD1 | 5.827 | 5.9 | 13 ± 3.4 | 13+12−2.5 | 1.2 ± 0.1 | 1.7 |
| CL0024-iD1 | 6.5 ± 0.1 | 7.0 | 2.1 ± 0.8 | 72+24−44 | 0.0 ± 0.2 | 0.5 |
| CL0024-zD1 | 6.7 ± 0.4 | 7.4 | 2.5 ± 0.2 | 90+101−77 | 0.2 ± 0.4 | 0.1 |
| Low Redshift, Solar Metallicity (Z = 0.02) | ||||||
| A1703-iD1 | 1.2 ± 0.1 | 1.4 | 2.4 ± 0.4 | 454+117−49 | 0.8 ± 0.3 | 9.3 |
| CL0024-iD1 | 1.3 ± 0.2 | 1.5 | 0.4 ± 0.1 | 571+235−156 | 0.3 ± 0.4 | 2.8 |
| CL0024-zD1 | 1.4 ± 0.5 | 1.5 | 0.4 ± 0.2 | 571+444−315 | 0.7 ± 0.9 | 0.6 |
| Low Redshift, Subsolar Metallicity (Z = 0.0004) | ||||||
| A1703-iD1 | 1.2 ± 0.2 | 1.4 | 4.2 ± 0.9 | 454+140−22 | 1.8 ± 0.3 | 11.4 |
| CL0024-iD1 | 1.3 ± 0.2 | 1.5 | 0.7 ± 0.2 | 454+187−167 | 1.4 ± 0.4 | 4.2 |
| CL0024-zD1 | 1.4 ± 0.6 | 1.6 | 0.6 ± 0.4 | 404+402−290 | 1.8 ± 1.0 | 0.9 |
Notes. aFormation redshift calculated from the fitted redshift and SSP stellar age. bBest-fit stellar mass, corrected for the cluster magnification. cAge of the single-burst stellar population (SSP model).
Download table as: ASCIITypeset image
For A1703-iD1 (Figure 5), the best-fit redshifts are z = 5.9–6.0 with an 1σ error of 0.1. The best-fit results, with χ2ν = 1.1, suggest a high-redshift galaxy with a mass of 0.9–1.2 × 10¹⁰ M☉ and age of 55–64 Myr. Richard et al. (2009) measure a redshift of z = 5.827 from Keck spectroscopy, which is broadly consistent with our fitting results. We also ran the fits to photometry with the redshift fixed to z = 5.827, and the results are presented in Table 3 and Figure 5. Using the spectroscopic redshift removes one of the degrees of freedom, but the modeling results still do show some dependence on the unknown metallicity: The fit with solar metallicity produces a satisfactory result, with χ2ν = 1.1, but that with a low metallicity does not fit as well, with χ2ν = 1.7, suggesting that the metallicity may well be high in this very luminous (3 L*) galaxy, or, if the metallicity is low, that the low-metallicity models may not match the SED very well in these high-redshift galaxies. The low-redshift solutions are inconsistent (χ2ν ∼ 10) with the observed photometry.
For CL0024-iD1 (Figure 6), again we find that the high-redshift solutions (χ2ν = 0.5–0.7) provide a better fit to the data than the low-redshift solutions (χ2ν = 2.8–4.2). Of note, the low-redshift SED models are inconsistent with the observed r- and i-band 1 σ upper limits and the z- and J110-band photometry. The best-fit redshifts are z = 6.4–6.5 with an 1 σ error of 0.1. The stellar masses are 1.5–2.1 × 10⁹ M☉ with ages of 43–72 Myr. The reddenings derived from the fits to both the solar and subsolar models were AV = 0.0.
For CL0024-zD1 (Figure 7), we find the high-redshift solutions (χ2ν ∼ 0.1) are only modestly better than the low-redshift solutions (χ2ν = 0.6–0.9). With the exception of the z-band photometry, which has large uncertainty, the low-redshift SED models can also reproduce the measured fluxes blueward of the break in the SED. We still favor the high-redshift solutions (z = 6.5–6.6 ± 0.4) over the low-redshift models (z = 1.4 ± 0.6). The stellar masses are ∼2–2.5 × 10⁹ M☉ and the ages ∼85 Myr. The solar and subsolar models have fit reddenings of AV = 0.0 and 0.2, respectively.
4.3. Are CL0024-iD1 and Cl0024-zD1 Physically Related?
As noted in Section 3, the source CL0024-zD1 is located only 25 from the CL0024-iD1 counterpart. For our fiducial lensing model where the amplification is 6.2 (Table 4), they would be separated physically by only 2.2 kpc. The two sources are of similar luminosity, differing by only approximately 0.7 magnitude in both the in J- and H-bands. The SED fits suggest very similar redshifts, differing only by Δz ∼ 0.1, which makes them essentially identical within the errors (see Table 3). The formal designation indicates that one is an i-dropout and one a z-dropout–at z ∼ 6.5 they have redshifts in the transition range where small changes in flux in the bands can result in a change in their dropout designation. Given the similar redshifts, SEDs, and luminosities, and the quite small separation in projection, it is possible that the two sources are simply components of the same source with a physical separation of 2 kpc. We think it is unlikely they are multiple images of the same source since our lensing models do not predict such a split pair. Both sources show dual-core morphology (see Section 4.6), and their four components seem well aligned over a scale of 6'' (see the J-band image in Figure 4). We have kept them as separate entities throughout our discussion but suspect that it is highly likely that they are spatially associated. Given the small separation and similarities these objects will likely be components of a group that will ultimately merge.
Table 4. Intrinsic Properties of Bright Dropout Objects
| Name | Photometric Redshift | Observed Size ('') | Demagnification Factor | Luminosity (1043 ergs s−1) | Size (kpc) | Component Separation (kpc) | Relative Flux |
|---|---|---|---|---|---|---|---|
| A1703-iD1 | 5.95 ± 0.15 | 0.66 + 0.51a | 3 | 21 | 2.2 + 1.7a | 0.9 | 1.0/0.57 |
| CL0024-iD1 | 6.45 ± 0.15 | 1.1 + 0.53a | 6.3 | 5.5 | 1.0 + 0.5a | 1.3 | 1.0/0.09d |
| CL0024-zD1 | 6.55 ± 0.35 | 0.6 + 0.5a | 6.2 | 4.8 | 0.5 + 0.4a | 1.4 | 1.0/0.51d |
| A1689-zD1 | 7.6 ± 0.4 | 1.6 + 1.0a | 9.3 | 6.9 | 0.9 + 0.5a | 1.6 | 1.0/0.62d |
| A2218-iD1b | 6.65 ± 0.1 | 3.0 × 0.3c | 15 × 1.7b | 3.2 | 0.2 | ⋅⋅⋅ | ⋅⋅⋅ |
Notes.
aFor two separate nuclei.
bEgami et al. (2005). These two sources are only 25 apart, have similar redshifts and are probably spatially associated (See Tables 2 and 3 and the text).
cAlong the major and minor axes, as the image is greatly stretched due to a gravitational lensing effect.
dMeasured in the J band.
Download table as: ASCIITypeset image
4.4. Surface Density of Bright High-Redshift Candidates
We compare our sample (Figure 8) with the distribution of known galaxy candidates at z ∼ 6, based on the LF of Bouwens et al. (2006) and scaled to a search area of 25 arcmin2. To a limiting magnitude of 25.6, a survey in an unlensed field is anticipated to find ∼1.4 candidates at z ∼ 6. We, however, find 4–5 such bright z ∼ 6–7 candidates behind lensing clusters. This effectively illustrates how lensing from foreground clusters can help us identify high-redshift galaxies at relatively bright magnitudes–which is helpful for numerous follow-up studies, including spectroscopy. The observed enhancement is expected because of the steep slope of the LF expected at higher luminosities (i.e., −d(log dΦ)/dlog L > 1: e.g., Broadhurst et al. (1995)). Such steep slopes are seen brighter than L* where there is an exponential cut-off, but not fainter than L*. For A1703-iD1, its intrinsic z-band magnitude is approximately 25 after correcting for the 3× model magnification factor (see Table 4). According to the z ∼ 6 LF, one would expect to require 40–250 arcmin2 to find one such bright candidate. Since the discovery of A1703-iD1 was made over an area of approximately 7 arcmin2 (after correcting for the 3× dilution factor), it would seem to be a rather serendipitous discovery. For the four other dropout candidates listed in Table 4, if we assume a nominal magnification factor of 9 in the cluster field, their intrinsic magnitudes are AB 27–28. Over 2 arcmin2 in the source plane, the z ∼ 6 LF predicts approximately 2–5 such galaxies. The four such galaxies found are therefore consistent, within the uncertainties, with the known distribution of high-redshift galaxies.

Figure 8. i-dropout surface density. The hatched area shows the number of i-dropouts per 20 arcmin2 in the field, as determined by Bouwens et al. (2007). The observed brightness for the five dropout galaxies in Table 2 are marked with stars, while their intrinsic (demagnified) H-band magnitudes are marked with the solid circles. The high magnification results in a number of bright sources (though they are intrinsically low luminosity, in general). As suggested in a number of studies, cluster magnification can result in bright z ∼ 6 galaxies (H < 25) that are rare in the field (see Section 4.3).
Download figure:
Standard image High-resolution image4.5. Rest-frame Optical Fluxes of the Lower-Luminosity Galaxy Population
Perhaps the most interesting property to examine in our small sample of highly magnified galaxy candidates is their stellar mass. The stellar masses tell us about the past star formation rate in a galaxy and therefore its likely contribution to the reionization of the universe as well as the production of metals. The stellar masses estimated in the previous section are useful for assessing the contribution of individual galaxies to the reionization of the universe. However, what we really want to know about the galaxy population at z ∼ 6–7 is their stellar mass density–since we can use this to constrain the SFR history at z > 7. It is difficult to determine this directly from the above measurements since we only have five high-redshift galaxy candidates from which to derive a mass function (and also the masses we derive will be sensitive to uncertainties in the model magnification factors: see, e.g., R. J. Bouwens et al. 2009, in preparation).
A better way of estimating the total stellar mass density is to start with determinations of the UV LF at z ∼ 6–7 and then use the measurements of UV-to-optical colors of z ∼ 6–7 galaxy candidates to estimate the stellar mass function of the galaxies (given the link between rest-frame optical colors and our estimates of stellar mass). Such colors have been available for the more UV luminous galaxy candidates at z ∼ 6–7 (Eyles et al. 2005; Yan et al. 2006; Stark et al. 2007), but until the present have been lacking for the less UV luminous galaxy candidates at z ∼ 6–7. This is where our sample of highly magnified galaxy candidates at z ∼ 6–7 is useful since they provide a luminosity-to-mass calibration for the less luminous galaxies that have previously lacked colors.
For the sake of uniformity, we will use the H − 3.6 μm colors of our sample of high-redshift galaxy candidates to represent the rest-frame UV-to-optical colors. We plot this color distribution for the four strongly lensed galaxy candidates in our sample with IRAC fluxes in Figure 9. We compare this distribution with the colors of more luminous galaxy candidates at z ∼ 6–7 identified in the HUDF (Yan et al. 2005; Labbé et al. 2006). No significant differences are observed between the H − 3.6 μm colors of our sample and the more luminous galaxy candidates Labbé et al. (2006) examined in the HUDF. A t-test yields a significance of 51%, suggesting no large differences between the ages (and mass-to-light ratios) of the lower-luminosity galaxy population at high redshift and that at higher luminosities. This has obvious implications for the total stellar mass density at z ∼ 6–7 and therefore the total star formation rate density at z ≳ 7 (Chary 2008), since it allows us to estimate the fraction of the total stellar mass density at z ∼ 6–7 that come from high- and low-luminosity systems. Our result does not suggest that lower luminosity galaxies have substantially different M/L ratios than at higher luminosities, and therefore provide no indication that lower luminosity galaxies contribute anything significantly different from what we might expect based upon their contribution to the luminosity density. It is also consistent with the hypothesis that more massive galaxies are unresolved aggregates of lower-luminosity galaxies.

Figure 9. H − 3.6 μm color distribution (red histogram) for the lower luminosity, highly magnified galaxy candidates at z ∼ 6.5–7.6 in our selection (Table 2). This distribution should provide an approximate measure of the size of the Balmer break and therefore provide us with an approximate measure of its age (though this color will also depend upon the dust content). In general, redder galaxies would be expected to be older and bluer galaxies younger. Also shown is the color distribution for the more luminous galaxy candidates at z ∼ 6.7–7.2 in the HUDF (black histogram: Yan et al. 2005; Labbé et al. 2006). Our sample of lensed galaxies has similar H − 3.6 μm colors to those of the more luminous sample. This suggests that the lower-luminosity galaxy population may have similar mass-to-light ratios as higher-luminosity galaxies (see Section 4.4).
Download figure:
Standard image High-resolution image
4.6. Morphology of High-Redshift Galaxies
Strong lensing enables us to resolve otherwise unobservable spatial structures in high-redshift galaxies, and thereby investigate the structure of young galaxies and the physical processes that drive both their growth and vigorous star formation. The observed and inferred physical sizes and separations of the resolved components of the three sources reported here are given in Table 4. For A1703-iD1, there are two knots separated by 045. Each of them can be fitted with a two-dimensional Gaussian with FWHM of 066 and 051, respectively. After demagnification (Table 4), this pair of components is separated by just 0.9 kpc, suggesting a merging event that drives star formation. Both the candidates in CL0024+16, which themselves are probably related as discussed in Section 4.3, seem to consist of two components, which are best seen in the J110 image.
It is interesting to note that the z-dropout in Abell 1689 (A1689-zD1) also has double nuclei, separated by ∼1 kpc (Table 4), in the source plane. Double nuclei seem to be almost ubiquitous in this sample (see Table 4), and even A2218-iD1 (Kneib et al. 2004) appears to show significant substructure. One interpretation is that these galaxies may consist of multiple star-forming regions that are UV luminous. The separation between the two sub-structures seems to be sufficiently large (Table 4) that they may be two merging systems. For A1689-zD1 or A1703-iD1 the models of Limousin et al. (2007, 2008) do not predict any counter images for these sources, and there is a lack of any luminous foreground sources that would be responsible for this lensing. Similarly as noted in Section 3, our models for CL0024+16 do not suggest multiple images for the sources. The complex and multiple nature of all these sources certainly suggests, as we would expect from numerical models, that interaction, merging and clumpy star formation are all aspects of the very dynamical nature of the galaxy buildup process at these redshifts.
5. SUMMARY
We have found three bright, strongly lensed i- and z-dropouts in the fields of the massive clusters Abell 1703 (see also Richard et al. 2009) and CL0024+16. Their large color decrements make the selection of these high-redshift galaxy candidates robust (with the exception of CL0024-zD1 for which the evidence is a little weaker), and detailed cluster mass models enable us to derive the intrinsic properties of the high-redshift galaxies. The similar redshifts, SEDs, and luminosities, and the quite small separation in projection, of the two sources in CL0024+16 suggest that they may be spatially associated with a separation of ∼2 kpc. Using stellar-population models to fit the rest-frame UV and optical fluxes, we derive best-fit stellar masses on the order of 109–10 M☉. Even after correcting for the lensing magnification (a factor of 3), A1703-iD1 remains intrinsically luminous. The three galaxy candidates are extended, with intrinsic sizes between 0.2 and 2 kpc, and resolved into a pair of nuclei. They, along with A1689-zD1 (Bradley et al. 2008), which is also double with component separation of ∼1 kpc in the source plane, suggest that merger driven growth and star formation may be a defining characteristic of high-redshift galaxies. Bright resolved galaxies such as these will be important targets for spectroscopy with the largest ground based telescopes and future large-aperture space telescopes like the James Webb Space Telescope.
The ACS was developed under NASA contract NAS 5-32865, and this research has been supported by NASA grant NAG5-7697. Infrared observations were made using the Gemini-North Telescope during the quarter GN-2003B-Q-28. We acknowledge the support of HST grants AR10310 and GO10874, and Spitzer grant GO20749. V.M. acknowledges the support by FONDECYT grant 1071008. Archival HST data were provided by the Multimission Archive at the Space Telescope Science Institute (MAST). We thank the anonymous referee for many thoughtful and detailed comments, which enabled us to improve the quality of this paper considerably.
Footnotes
- *
Based on observations with the NASA/ESA Hubble Space Telescope, obtained at the Space Telescope Science Institute, which is operated by the Association of Universities of Research in Astronomy, Inc., under NASA contract NAS5-26555, and at the Gemini Observatory, which is operated by the Association of Universities for Research in Astronomy, Inc., under a cooperative agreement with the NSF on behalf of the Gemini partnership: the National Science Foundation (United States), the Particle Physics and Astronomy Research Council (United Kingdom), the National Research Council (Canada), CONICYT (Chile), the Australian Research Council (Australia), CNPq (Brazil), and CONICET (Argentina).