


ABSTRACT
We observed the soft gamma repeater SGR 0501+4516 with Suzaku for ∼51 ks on 2008 August 26–27, about 4 days after its discovery. Following the first paper, which reported on the persistent soft X-ray emission and the wide-band spectrum of an intense short burst, this paper presents an analysis of the persistent broadband (1–70 keV) spectra of this source in outburst, taken with the X-ray Imaging Spectrometer (XIS) and the Hard X-ray Detector (HXD). Pulse-phase folding in the 12–35 keV HXD-PIN data on an ephemeris based on multi-satellite timing measurements at soft X-rays revealed the pulsed signals at ≳99% confidence in the hard X-ray band. The wide-band spectrum clearly consists of a soft component and a separate hard component, crossing over at ∼7 keV. When the soft component is modeled by a blackbody plus a Comptonized blackbody, the hard component exhibits a 20–100 keV flux of 4.8+0.8−0.6(stat.)+0.8−0.4(sys.) × 10−11 erg s−1 cm−2 and a photon index of Γ = 0.79+0.20−0.18(stat.)+0.01−0.06(sys.). The hard X-ray data are compared with those obtained by INTEGRAL about 1 day later. Combining the present results with those on other magnetars, we discuss a possible correlation between the spectral hardness of magnetars and their characteristic age and magnetic field strengths.
Export citation and abstract BibTeX RIS
1. INTRODUCTION
Soft gamma repeaters (SGRs, ∼6 sources) and Anomalous X-ray Pulsars (AXPs, ∼10 sources) are now believed to host magnetars, i.e., ultra-magnetized neutron stars with surface field largely exceeding the quantum critical field (BQED = 4.4 × 10¹³ G). As such they provide unique laboratories where quantum electrodynamics can be tested in the strong field limit. Although SGRs and AXPs have been primarily detected in soft (<10 keV) X-rays, characteristic hard X-ray components above 10 keV, or spectral "hard tails", were discovered recently in the persistent emission from about five sources (den Hartog et al. 2006; Kuiper et al. 2006; Götz et al. 2006). These components have very hard photon indices (Γ ∼ 1) and high pulsed fractions. Their origin has been discussed extensively (Thompson & Beloborodov 2005; Baring & Harding 2007; Heyl & Hernquist 2005), but no definite conclusion has been reached yet.
From an observational viewpoint, it is still unclear whether the hard component is common to all magnetars or specific to some of them. We do not yet know, either, how this enigmatic component behaves during their active phases. This is because the hard X-ray detections of magnetars require long exposures, and are therefore achieved mostly in their quiescent states, except for one during a low-level activity period of SGR 1806−20 (Götz et al. 2006).
The newly discovered SGR 0501+4516 (Barthelmy et al. 2008) gave us an opportunity to investigate some of these questions. As part of prompt follow-up observations (Chandra, Woods et al. 2008; XMM-Newton, Rea et al. 2008a), we performed a Target of Opportunity (ToO) observation of this source with Suzaku (Mitsuda et al. 2007). Enoto et al. (2009; Paper I) reported initial results from this ToO observation of SGR 0501+4516, focusing on its persistent emission at energies below 10 keV, its soft X-ray pulsations at P = 5.76 s, and the 0.5–200 keV spectra of an intense short burst. In this paper, we analyze the same Suzaku ToO data and report on the detection of a hard component up to ∼70 keV in the persistent emission. Taking it into account, we also revise our modeling of the soft X-ray spectrum derived in Paper I. These results thus provide one of the first wide-band studies of this object. In the following analysis, the uncertainties refer to 90% confidence levels unless otherwise stated.
2. OBSERVATION
As described in Paper I, the Suzaku observation was carried out for a gross duration of ∼120 ks (net exposure of ∼51 ks) starting at 2008 August 26 UT 00:05, 4.2 days after the activity onset, and ending on August 27 UT 08:25. Since the persistent 1–10 keV flux decayed over ∼24 days (Rea et al. 2009), the persistent soft X-ray emission was still bright during the Suzaku observation.
During the observation, the X-ray Imaging Spectrometer (XIS; Koyama et al. 2007) was operated with a time resolution of 2 s. The Hard X-ray Detector (HXD; Takahashi et al. 2007) was operated in the standard mode, with a time resolution of 61 μs. Further details of the observation are described in Paper I. There were no contaminating hard X-ray sources within the fields of view (FOV) of HXD-PIN, as judged from the INTEGRAL observations (Bird et al. 2010). Three sources were within the FOV of HXD–GSO, but two of them (RX J0440.9+4431 and LEDA 168563) were at its edge, and the other, the galaxy cluster 4U 0446+44 (Lane et al. 2002), is unlikely to be a strong hard X-ray source.
3. DATA ANALYSIS
Following the same data analysis described in Paper I, 32 short bursts were detected with the XIS. In order to investigate the persistent emission, we eliminated 2 s time intervals before and after each of these bursts from the data of the XIS and HXD-PIN.
Soft X-ray spectra were extracted from a circular region of 1 92 radius around SGR 0501+4516 from the three XIS sensors (XIS0, XIS1, and XIS3), while background spectra were taken from source-free regions of the same CCDs. The response matrices and ancillary responses were generated using xisrmfgen and xissimarfgen (Ishisaki et al. 2007), respectively. The individual XIS sensors recorded average 0.8–10 keV count rates of ∼1.6 counts s−1.
To subtract non-X-ray background (NXB) events that are included in the HXD-PIN and HXD–GSO data, we used the "tuned" (LCFITDT) NXB model (Fukazawa et al. 2009). To examine the reproducibility of this method, we compared 18 ks of Earth occultation data with the NXB model prediction. The model was found to overestimate the 15–40 keV and 40–70 keV HXD-PIN counts by 2.1% and 0.7%, respectively. Similarly, the model overestimated the 50–100 keV and 100–200 keV HXD–GSO data by 0.5% and 1.6%, respectively. These values are consistent with the nominal systematic errors associated with the method. Following Fukazawa et al. (2009), we hence assign a systematic error of 2.0% to the modeling of the HXD-PIN NXB and 1.0% to that of the HXD–GSO.
After subtracting the synthesized NXB from the HXD-PIN data, we also subtracted contributions of the Cosmic X-ray Background (CXB) using a nominal model by Moretti et al. (2009). Since the CXB amounts to only ∼5% of the NXB, its sky-to-sky fluctuation (∼11% at 1σ) corresponds at most to ∼0.6% of the NXB and is negligible. From the HXD–GSO data, we subtracted only the NXB, because the CXB contribution is negligible.
4. RESULTS
4.1. Pulse Profiles
As reported in Paper I, the XIS data, after barycentric correction (Terada et al. 2008), revealed the source pulsations at a period of P = 5.762072(2) s. This is consistent with the ephemeris given in Rea et al. (2009) and quoted in Table 1, which is based on multi-satellite X-ray timing measurements during the outburst. Panels (a) and (b) of Figure 1 show pulse profiles in two soft X-ray bands, obtained by folding the XIS data with this ephemeris.
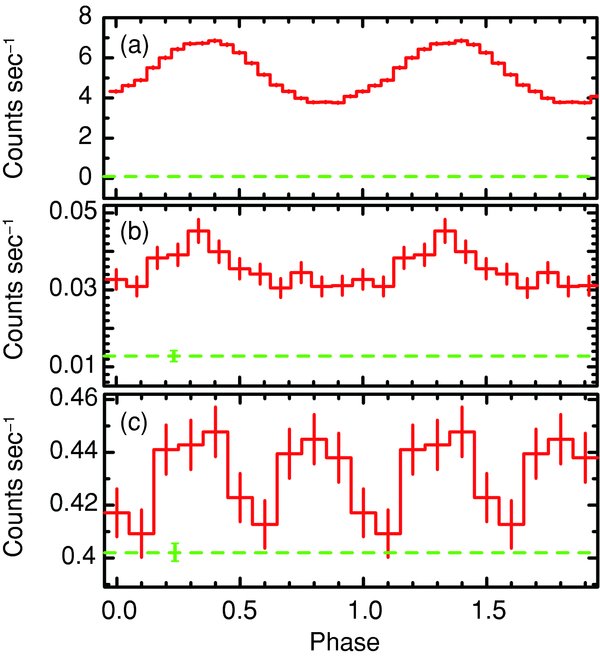
Figure 1. Dead-time corrected and energy-sorted pulse profiles of SGR 0501+4516 in outburst, obtained by folding the background-inclusive data at the barycentric pulse period in Table 1. Two cycles are shown for clarity. Panels (a) and (b) are in the 0.5–8 keV and 8–12 keV energy bands from the XIS (three cameras summed), while (c) is from the 12–35 keV HXD-PIN data. Dashed lines show the average background (NXB+CXB) levels. Error bars are statistical ±1σ. Those in panel (a) are smaller than the line width.
Download figure:
Standard image High-resolution imageTable 1. Timing Parameters Used for Data Folding (Rea et al. 2009)
| P (s) | 5.76207163 |
 (s s−1) (s s−1) |
6.66 × 10⁻¹² |
| Epoch (MJD) | 54704.684 (2008 Aug 26 16:24:58.0) |
Note. Epoch is defined as the barycentric corrected time.
Download table as: ASCIITypeset image
By folding the 12–35 keV background-inclusive HXD-PIN data in the same way, we obtained the folded light curve shown in Figure 1(c). When fitted with a constant, the HXD-PIN light curve gives χ2/ν = 22.3/9, which indicates a chance probability of about 0.01 that the measured pulse-phase distribution results from random fluctuations. In other words, we can rule out, at 99% confidence level, the null hypothesis that the 12–35 keV HXD counting rate is constant as a function of the phase of the soft X-ray pulsations. This inference is strengthened by the bin-free Z2n test (Buccheri et al. 1983) with n = 2, which gives Z22 = 17.6 for a total event number of N ≃ 2.2 × 10⁴, and an associated null-hypothesis probability of 1.5 × 10⁻³.
In the same way, we folded the background-inclusive 70–210 keV HXD–GSO data (a gadolinium silicate crystal Gd2SiO5). The χ2 test gave χ2/ν = 21.5/9, with a null-hypothesis probability of 0.01. Similarly, the Z2n test with n = 2 and N ≃ 8 × 10⁵ yielded Z22 = 12.7, which corresponds to a null-hypothesis probability of ∼0.01. Thus, the 5.76 s modulation is not significant in the GSO data, and we do not discuss this any further.
4.2. Wide-band Spectrum
After subtraction of the NXB and the CXB (Section 3), an average 12–70 keV source count rate of (3.1 ± 0.3) × 10−2 count s−1 was measured with the HXD-PIN. In Figures 2 and 3, we show the derived HXD-PIN spectrum, together with those of the XIS which are essentially the same as presented in Paper I. The signal intensity corresponds to ∼10% of the NXB level in the 15–70 keV energy range and is comparable to the CXB in the 12–24 keV range. Thus, the persistent X-ray emission has clearly been detected by the HXD-PIN with a 3σ detection significance around ∼70 keV (∼10σ if averaged over 10–70 keV). This statement remains valid even taking into account the conservative systematic error (∼2%) of the NXB. The HXD-PIN spectrum is rather featureless and can be fitted over 12–70 keV with a single power law with Γ = 0.4 ± 0.5 (stat.) and χ2/ν = 3.3/6.
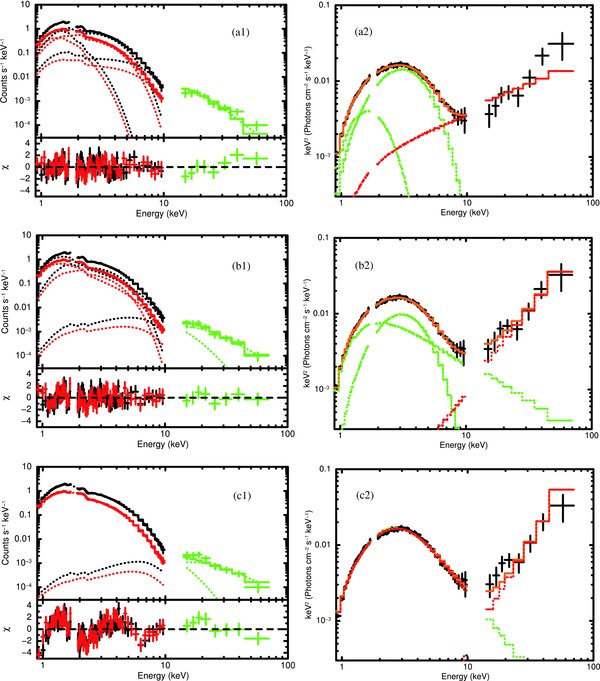
Figure 2. Background-subtracted and pulse-phase-averaged spectra of SGR 0501+4516 observed in 2008, fitted with model (a) (panels a1 and a2), model (b) (panels b1, b2), and model (c) (panels c1, c2). The left and right panels present raw count rates and the corresponding νFν spectra, respectively. The error bars associated with the HXD data point are statistical only.
Download figure:
Standard image High-resolution image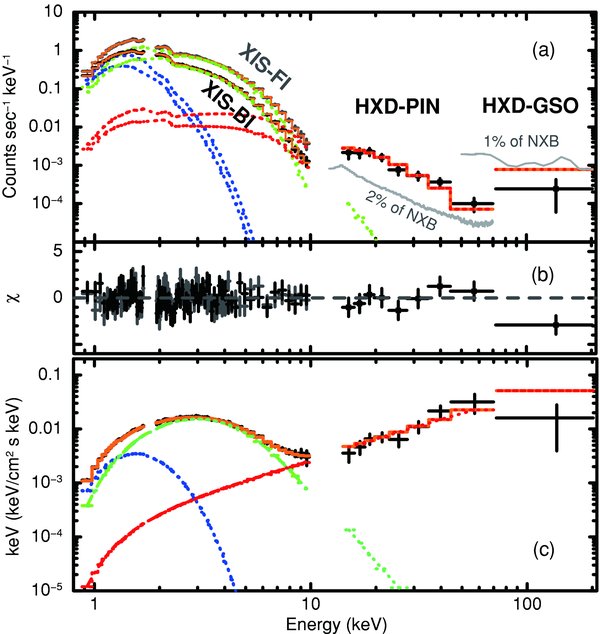
Figure 3. (a) Same spectra as presented in Figure 2, but fitted with model (d). Typical NXB uncertainties are also shown (gray). (b) Residuals from the model. (c) A νFν presentation of panel (a).
Download figure:
Standard image High-resolution imageThe XIS and HXD spectra were fitted simultaneously over 0.5–70 keV, but ignoring XIS channels around the Si-K edge (1.84 keV) due to response uncertainties. The spectra of the XIS-FI detectors (XIS0 and XIS3) were added together, and the cross normalization between XIS-FI and XIS-BI (XIS1) was allowed to differ by up to 3%. Considering the poorer statistics of the HXD data, the relative model normalization between HXD-PIN and XIS-FI was fixed at 1.09 (Ishida et al. 2007). A 1% systematic uncertainty was assigned to the XIS spectra.
To describe the soft component, we tried three empirical models, which are often used to describe magnetar spectra, namely, (a) two blackbodies, (b) a blackbody and a steep power law, and (c) a resonant cyclotron scattering model (Rea et al. 2008b). In each case, a separate flat power law was added to account for the hard tail. Table 2 summarizes the fits with these models, and Figure 2 presents the fit results. Model (c) was unsuccessful because of significant residuals in the soft X-ray band. Although (a) and (b) gave formally acceptable fits, the photon indices of the flat power law, obtained with model (a) (Γ ∼ 1.2) and model (b) (Γ ∼ 0), are close to the ends of the 90% confidence range of Γ as derived above using the HXD-PIN data only. Furthermore, the data deviate systematically from the model in the HXD-PIN energy band. These effects occur because the high signal statistics in the XIS band tend to shift differences between the data and the model into the HXD-PIN band, where the data errors are much larger. Recall also that the XIS data alone favor model (b) over model (a) (Enoto et al. 2009); adding the hard component appears, instead, to favor model (a) (Table 2).
Table 2. Spectral Parameters for Empirical Models
| Model | (a) | (b) | (c) | (d) |
|---|---|---|---|---|
| 2BB+PL | (BB+PL)+PL | RCS+PL | (BB+CBB)+PL | |
| NH (1021 cm−2) | 8.0+0.5−0.4 | 11.3 ± 0.4 | 6.2 ± 0.2 | 8.3 ± 0.2 |
| kTLow (keV) | 0.30 ± 0.02 | ⋅⋅⋅ | ⋅⋅⋅ | 0.27 ± 0.01 |
| RLow (km)a | 2.22 ± 0.02 | ⋅⋅⋅ | ⋅⋅⋅ | 2.68+0.04−0.07 |
| kTHigh (keV) | 0.72+0.01−0.02 | 0.708 ± 0.009 | ⋅⋅⋅ | 0.58 ± 0.01 |
| RHigh (km)a | 0.529 ± 0.002 | 0.46+0.02−0.01 | ⋅⋅⋅ | 1.87 ± 0.01 |
| Γsoft | ⋅⋅⋅ | 3.1+0.2−0.1 | ⋅⋅⋅ | ⋅⋅⋅ |
| RCS τ | ⋅⋅⋅ | ⋅⋅⋅ | 5.1+1.9−0.8 | ⋅⋅⋅ |
| RCS β | ⋅⋅⋅ | ⋅⋅⋅ | 0.31 ± 0.01 | ⋅⋅⋅ |
| RCS T (keV) | ⋅⋅⋅ | ⋅⋅⋅ | 0.385+0.012−0.014 | ⋅⋅⋅ |
| α(=Γtail − 1) | ⋅⋅⋅ | ⋅⋅⋅ | ⋅⋅⋅ | 5.6+0.1−0.3 |
| Fsoft b | 2.73 ± 0.04 | 2.72+0.06−0.02 | 2.71+0.08−0.54 | 2.72+0.58−0.29 |
| Fsoft(unabsorbed) b | 3.05 ± 0.04 | 3.20+0.07−0.02 | 2.96+0.09−0.60 | 3.06+0.65−0.33 |
| Γ | 1.33+0.23−0.16 | −0.05 ± 0.55 | 0.15+0.35−0.30 | 0.79+0.20−0.18 |
| Fhard c | 3.7 ± 0.8 | 7.8+3.9−2.8 | 7.8+2.3−2.8 | 4.8+0.8−0.6 |
| χ2/dof | 161.0/150 | 164.9/150 | 259.0/150 | 150.8/149 |
| χ2ν | 1.07 | 1.10 | 1.73 | 1.01 |
| Probabilityd | 0.25 | 0.19 | 8 × 10⁻⁸ | 0.44 |
Notes. BB, PL, RCS, and CBB represent blackbody, power law, resonant cyclotron scattering, and (magnetic) Comptonized blackbody, respectively. All the quoted errors are statistical only at the 90% confidence level. aAt a distance of 1.5 kpc (Gaensler & Chatterjee 2008; Leahy & Aschenbach 1995). b10−11 erg s−1 cm−2 in the 2–10 keV energy range. c10−11 erg s−1 cm−2 in the 20–100 keV energy range. dNull-hypothesis probability.
Download table as: ASCIITypeset image
To avoid the above problems, we introduced a fourth model for the soft component. Namely, we modified the higher-temperature blackbody component of model (a) to a Comptonized blackbody defined as CE−α−1∫E0E'2+α/(exp(E'/kT) − 1)dE', where C, E, and kT are the normalization factor, photon energy, and blackbody temperature (Tiengo et al. 2005; Halpern et al. 2008; Enoto et al. 2010), respectively. As shown in the last column of Table 2 and in Figure 3(b), this model (model (d)) gives a fully acceptable fit, which is better than those of models (a) and (b) by Δχ2>9. In addition, the hard power-law index, Γ = 0.79+0.20−0.18(stat.)+0.01−0.06(sys.), is consistent with the result obtained using the HXD-PIN data alone: here, the systematic error was determined by varying the HXD-PIN background within its uncertainty range of 2%. The νFν form of this fit is shown in Figure 3(c), where the distinct hard and soft components are seen to cross over at ∼7 keV. Using this model, the 20–100 keV flux is estimated as 4.8+0.8−0.6(stat.)+0.8−0.4(sys.) × 10−11 erg s−1 cm−2. Figure 3 also includes, just for reference, a nominal GSO data point after the NXB subtraction, although it is not significant.
5. DISCUSSION AND SUMMARY
The present Suzaku observation of SGR 0501+4516, performed for a net exposure of 51 ks in its burst-active phase, has allowed the HXD detection of a distinct hard X-ray component in the burst-removed persistent emission up to at least 70 keV. Exhibiting a very flat slope of Γ ∼ 0.8, this component crosses over with the soft component at ∼7 keV. These properties are very similar to those of the hard components previously observed from several magnetars during quiescence (Section 1). With a confidence of >99%, the hard component was found to be pulsed, at least in the 12–35 keV range, at the same 5.76 s period as the soft component. While the pulse profiles have single-peaked sinusoidal shapes in soft X-rays (Figures 3(a) and (b)), they become double-peaked in the hard X-ray band (Figure 3(c)). One of the hard X-ray peaks appears at approximately the same phase as the soft-pulse peak, while the other emerges at the opposite phase approximately corresponding to the soft-pulse bottom. Similar energy-dependent changes in the pulse profiles have been reported from quiescent sources, including in particular 4U 0142+61 and 1RXS J170849−400910 (den Hartog et al. 2008a, 2008b). Any theoretical explanation of the hard-tail production must be able to account for these properties. Although Figure 1 suggests a higher pulsed fraction in harder X-rays (as often observed in other magnetars, e.g., Kuiper et al. 2006), the effect is not significant when considering the statistical and systematic uncertainties of the HXD-PIN signals.
These spectral and timing results obtained with Suzaku suggest that the broadband properties of magnetars in quiescence are approximately retained when SGR 0501+4516 entered the burst-active state, and it is mainly the spectral normalization that increases (by at least ∼80 times in the present case; Rea et al. 2009). In addition, the measured 20–100 keV flux is 1.6 ± 0.4 times higher than the absorption-corrected 2–10 keV one. Therefore, the hard X-ray component energetically dominated the persistent emission from SGR 0501+4516 during the activity, although it must cut off at some as yet-undetermined energy.
An INTEGRAL ToO observation of SGR 0501+4516, performed for 204 ks about 1 day later (2008 August 27 00:31–28 08:36), detected the hard X-ray emission up to ∼100 keV (Rea et al. 2009). The hard-tail slope they measured, Γ = 0.8 ± 0.2, is consistent with our measurement. Modeling of the 0.5–100 keV XMM-Newton plus INTEGRAL spectrum with a BB+2PL (Rea et al. 2009) gave unabsorbed 2–10 keV and 20–100 keV fluxes of 2.8(1) × 10−11 erg cm−2 s−1 and 3.4(1) × 10−11 erg cm−2 s−1, respectively. The latter corresponds to 0.71± 0.12 times that measured 1 day before with Suzaku. Further considering the INTEGRAL upper limit on September 5 or later (Rea et al. 2009), the enhanced hard tail appears to decay on a shorter time scale (i.e., 3–13 days) than the soft X-rays (23.8 days; Rea et al. 2009).
Although the present observation reinforces the view that two-component spectra are common to magnetars, there is no acceptable theoretical explanation for them. Thus, it is necessary to quantify them empirically based on current observational data. For this purpose, we propose to utilize the hardness ratio (HR) of the 20–100 keV to 2–10 keV unabsorbed fluxes, which were introduced above. Figure 4 shows the HRs of magnetars versus their characteristic age  s and surface magnetic field
  G. In Figure 4(a), we also convert τch to the electric potential due to rotation, V = vBL ∼ ΩBR2 = 2.7 × 10¹⁸(B/4.4 × 1013G)P−1 V ∝τ−1/2ch, where v, L, and R are the typical rotational speed, acceleration scale, and stellar radius, respectively. In addition to the Suzaku and INTEGRAL results on SGR 0501+4516, we also include the published results for other magnetars, which were mainly obtained during quiescent states. The HR appears to correlate negatively with τch, while positively with B and V.

Figure 4. (a) 20–100 keV vs. 2–10 keV (unabsorbed) flux ratios (HRs) of magnetars, shown vs. their characteristic age. The red star indicates the present Suzaku results, and open blue circles are from Götz et al. (2006) and the McGill SGR/AXP Online Catalog. The green open circle is based on Rea et al. (2009), where the XMM-Newton flux is corrected for the 4% day−1 decay. (b) The same HRs as panel (a), plotted vs. the surface magnetic field.
Download figure:
Standard image High-resolution image
In Figure 4, the burst-active magnetar SGR 0501+4516 approximately lies on the correlation defined by the other objects which are observed mostly in quiescence. Therefore, the luminosities of the two components appear to increase primarily in proportion to each other when a magnetar becomes active. In addition, a closer look at Figure 4 suggests that the HR of SGR 0501+4516 is more enhanced than those of the other magnetars. If this possible deviation of the Suzaku data point represents a common behavior of magnetars, one possibility is that the hard-tail component is somewhat more enhanced than the soft component when the activity increases.
We thank the Suzaku operation team for successfully carrying out the ToO observation. We gratefully acknowledge the referee for providing detailed comments and suggestions, which significantly improved this paper. N.R. is supported by an NWO Veni Fellowship, D.G. thanks the CNES for financial support, and S.Z. acknowledges support from STFC. We thank Matthew Baring for a helpful discussion. K.H. is grateful for support under the INTEGRAL US Guest Investigator program, NASA grant NNX09AI74G. P.E. was supported by ASI through ASI/INAF contract I/011/07/0.