


ABSTRACT
Since the launch of the Fermi Gamma-ray Space Telescope on 2008 June 11, 55 gamma-ray bursts (GRBs) have been observed at coordinates that fall within 66° of the Fermi Large Area Telescope (LAT) boresight with precise localizations provided by the NASA Swift mission or other satellites. Imposing selection cuts to exclude low Galactic latitudes and high zenith angles reduces the sample size to 41. Using matched filter techniques, the Fermi/LAT photon data for these fields have been examined for evidence of bursts that have so far evaded detection at energies above 100 MeV. Following comparisons with similar random background fields, two events, GRB 080905A and GRB 091208B, stand out as excellent candidates for such an identification. After excluding the six bright bursts previously reported by the LAT team, the remaining 35 events exhibit an excess of LAT "diffuse" photons with a statistical significance greater than 2σ, independent of the matched filter analysis. After accounting for the total number of photons in the well-localized fields and including estimates of detection efficiency, one concludes that somewhere in the range of 11%–19% of all GRBs within the LAT field of view illuminate the detector with two or more energetic photons. These are the most stringent estimates of the high-energy photon content of GRBs to date. The two new events associated with high-energy photon emission have similar ratios of high- to low-energy fluences as observed previously. This separates them from bursts with similar low-energy fluences by a factor of 10, suggesting a distinct class of events rather than a smooth continuum.
Export citation and abstract BibTeX RIS
1. INTRODUCTION
One of the more surprising results of the Compton Gamma-Ray Observatory was the EGRET discovery of an 18 GeV photon associated with GRB 940217 (Hurley et al. 1994). This was not an entirely unique event; about a half-dozen bursts were seen over the course of the mission with photons above 100 MeV (Catelli et al. 1998; Dingus 2003). Since the GRB spectral energy distribution at lower energies has been well characterized by a modified power law with peak fluxes at energies of the order of 200 keV, the existence of photons at energies 104 times higher puts a significant constraint on any viable model of the GRB phenomenon (e.g., Band et al. 2009). The obvious question is whether high-energy photons are associated with all GRBs or only with a small sub-class. We are now in a unique period when two space missions are providing GRB coordinates with arcsecond accuracy (Swift; Gehrels et al. 2004) and the ability to measure photon energies to 300 GeV (Fermi/LAT; Atwood et al. 2009). Once these two missions cease functioning, the resources to investigate GRBs over a broad energy range are not likely to be available for decades. Thus, it is a matter of some urgency to extract the maximum amount of information from the assets now at hand. Prior to the launch of the Fermi Gamma-ray Space Telescope, it was possible to speculate that the LAT instrument would detect more than 200 GRB events per year (Dingus 2003). In the two-year period since the launch of the Fermi Gamma-ray Space Telescope, the Gamma-ray Burst Monitor (GBM; Meegan et al. 2009) has reported approximately 475 GRBs, i.e., a rate of about 250 per year. Over essentially the same period, only 17 bursts3 have been identified by the Fermi/LAT. Given that roughly 50% of all GBM triggers point to directions within 66° of the LAT boresight, the fraction of bursts with photons above 100 MeV is apparently not much larger than 7%. Thus, it is an important task to apply the best possible techniques to explore whether this fraction would be significantly bigger if the detection threshold could be lowered. Such studies might significantly inform the design of future missions while extracting additional information from rather expensive facilities.
From launch through 2010 March 16, 55 GRBs have been detected (mainly by Swift, as well as INTEGRAL: Winkler et al. 2003; AGILE: Giuliani et al. 2008) at celestial coordinates that were simultaneously viewed by the Fermi/LAT. The angular resolutions of the Swift BAT and XRT are arcminutes and arcseconds, respectively. Compared with the mean point-spread width for the Fermi/LAT of a few degrees, these GRB coordinates are known with zero error. This sample is an excellent target for statistical methods that can take advantage of the precisely determined source direction. The basic technique that is employed here is the matched filter, most familiar to those detecting signals in the time domain. The underlying assumption of this method is that the characteristics of both the signal and background are a priori known functions of one or more variables. Since the matched filter maximizes the signal-to-noise ratio, moderate departures from optimality degrade the filter performance relatively slowly, making this a valuable tool for investigating the possible existence of faint signals. We present the sample and data processing in the following section, and details of the signal detection technique in Section 3. Results are given in Section 4 followed by a brief discussion in Section 5.
2. SAMPLE SELECTION AND DATA PROCESSING
A selection of 148 precisely located GRBs (<1 8) was obtained from the Swift Web page4 devoted to cataloging all bursts. The data correspond to the period from launch until the end of 2010 March. Most of these events were observed by the Swift/XRT, augmented by a few from INTEGRAL and AGILE. The resulting list was cross-correlated with Fermi spacecraft attitude data obtained from the Fermi Science Support Center5 (FSSC) to identify only those events within 66° of the LAT boresight.
Having identified the principal focus of this investigation, two sets of LAT photon data were obtained from the FSSC corresponding to the 55 precisely located GRB fields and to 464 additional fields taken at random on the sky to study the background behavior. Throughout the following, they will be identified as "GRB" or "random" data. The FSSC data selection criteria corresponded to any of the three event classes, "transient," "source," or "diffuse," photon energies above 100 MeV but below 300 GeV, a zenith angle less than 105° and time intervals when the DATA_QUAL parameter was 1 and the South Atlantic Anomaly parameter, IN_SAA, was 0. The 105° zenith-angle limit might be considered a bit risky but with an orbiting altitude of 565 km, the Earth's limb appears at a zenith angle of 112 83 which is easily resolvable. For the random LAT fields, fictitious GRB directions were chosen randomly over the sky but constrained by the less than 66° boresight requirement. Further cuts were imposed of less than 105 for the angle between the photon and GRB directions and a time window spanning from t0 − 100 s to t0 + 150 s. With LAT point-spread width maxima of the order of 4°, the 105 cut was imposed to allow up to 2.6σ errors without worrying about the effects of significant variations in the background flux over the effective solid angle of 0.105 sr. All data fields were additionally constrained to lie above or below the Galactic plane by more than 10°. Such additional criteria reduced the number of GRB fields from 55 to 41. Six of these have been previously associated with significant fluxes of energetic photons (>100 MeV) and thus provided guidance about the characteristics of the signals we were seeking.
3. SIGNAL DETECTION TECHNIQUE
The central theme of this paper is the use of a matched filter to enhance the signal-to-noise ratio for the detection of GRB photons in a diffuse background. There are four independent variables that are involved: energy (E), photon angle with respect to the GRB direction (θ), photon time of arrival (t), and photon event class (c ∈ {1, 2, 3}). The most obvious consideration is that the photon direction should be correlated with the GRB coordinates within an angle related to the LAT point-spread function (PSF) for that specific photon energy. Photons that fall far outside this criterion are almost certainly background. The energy criterion is less intuitive. The energy spectra for both the GRB signal and the background are approximately represented by decreasing power laws with exponents ΓGRB and Γback, respectively. Unfortunately, the background has a somewhat harder spectrum with Γback ≃ 1.5 while ΓGRB ≃ 2.2. Thus, higher energy photons are more likely to represent background than signal. Photon directional accuracy is also critical, so photons with small uncertainty (i.e., high energy) should be weighted more heavily. The time filter is the most problematic because GRB light curves lack a uniform shape. Particularly for the most energetic burst photons, the time delay relative to the low-energy trigger can be substantial, up to thousands of seconds (Hurley et al. 1994). However, uniquely identifying such late quanta with a GRB can be problematic, especially in view of the lack of a distinguishing spectral characteristic. One feature that is generally observed is a prompt flux within a few seconds of the low-energy trigger. This can be seen in Figure 1 of Ghisellini et al. (2010). Most of the depicted LAT light curves exhibit a significant flux within 10 s of the burst. There are a few exceptions such as GRB 090328, so it must be recognized that not every fish can be caught with the same net. This led us to adopt a standard GRB light curve described by a broken power law with a break at tb = 5 s. Prior to tb, the flux rises as (t/tb) after which it falls as (t/tb)−α. The value for α0 was set rather arbitrarily at 1/2, while α was picked to be 7/5 in concert with the general behavior of a large number of GRB afterglows. We emphasize that all the filter parameters were determined prior to applying them to either the GRB or random data sets.
When we began this analysis, we were unaware of the nuanced distinctions between the three LAT photon event classes, "transient," "source," and "diffuse," identified as 1, 2, and 3. Since we were looking for a transient point source, it seemed reasonable to include the "transient" quanta on equal footing with the other two. Only after going through the complete development of the matched filter search did we discover that the signal content of the "transient" photons is extremely small, ∼3.5%. This was determined by looking at the event class photon counts for the most intense GRBs, 080916C, 090510, 090902B, and 091003. The ratio, rGRB, of "transient" and "source" GRB photons to "diffuse" is 0.34 and 0.44, respectively, roughly independent of the particular burst. On the other hand, the same ratios for the selected random LAT fields, rback, are 9.65 and 0.85. Consequently, we realized that we needed to include a weighting factor, wc, based on event class that reflected this wide dispersion of information content. Serendipitously, the simple existence of a strong correlation of GRBs with "diffuse" class photons provided an independent verification of the validity of the matched filter technique.
From these considerations, the mathematical form of the matched filter weight functions is given by

The PSF for the LAT has been specified by the FSSC team in terms of a half-angle that includes 68% of a random sample. We have fit this to a power law in energy (Akerlof & Yuan 2007) to obtain separate parameter sets corresponding to conversion in either half of the LAT tracker using the form
For this analysis, we have assumed that the LAT PSF is Gaussian as described above for wθ with a characteristic width determined by the containment condition:
Although the actual LAT angular error distribution function exhibits non-Gaussian tails, this approximation is unlikely to affect subsequent conclusions. As indicated above, the weight value for each photon is computed as a product of the four elements, wE, wθ, wt, and wc. The time filtering algorithm substantially ignores all photons that occur more than a few tens of seconds after the GRB trigger. For the parameters selected, this can best be described by an effective T90 window time for the signal of 16.864 s starting 1.624 s after the burst. The sum over all photons, ∑wi, is the statistic used to identify events with significant fluxes of high-energy photons. In assessing this technique, the mean contribution from background photons turns out to be negligibly small. The identification problem is driven entirely by infrequent but large fluctuations of ∑wi contributed by background quanta. As an additional safeguard, a weight-sharing measure was introduced to ensure that the entire event weight was not generated by a single extreme photon. This parameter is defined by
In this formula, w0, w1, and w2 are the maximum three photon weights for a particular event. The combined statistic, ζ∑wi, incorporates both the sum of photon weights and the additional requirement that no single photon contributes an overwhelming fraction of the value. The downside is that at least three photons must be associated with an event, an issue that will arise later.
The significances of the ∑wi and ζ∑wi statistics were determined by Monte Carlo simulations of the background. For each field of the GRB data set, 2000 events were generated using the measured background spectral distribution to determine energy and uniform distributions over solid angle and time to determine θ and t. The number of background photons for each field was set by the measured background rate. By looking at the weight statistics for simulated events with and without injected GRBs, we gained reasonable confidence that the matched filter algorithm would correctly identify a significant fraction of real bursts. This work also demonstrated that the modified sharing-compensated statistic, ζ∑wi, was the stronger measure.
As described earlier, 41 GRB fields were selected for examination. These are listed in Table 2. Six of these events have been previously identified with >100 MeV LAT-detected photons. These are GRB 080916C (Abdo et al. 2009a), GRB 090323 (Ghisellini et al. 2010), GRB 090328A (Ghisellini et al. 2010), GRB 090510 (Abdo et al. 2009b), GRB 090902B (Abdo et al. 2009c), and GRB 091003 (Ghisellini et al. 2010).
The 35 GRB fields with no previous claims for LAT detections were the target of this investigation. We recognized that the most convincing argument for a true LAT identification should rely on the statistical distributions for the matched filter weights in LAT fields with similar characteristics. To increase that number as much as possible, the LAT fields of view (FoVs) were segmented into 24 circular tiles embedded on a spherical surface as shown in Figure 1. Each tile subtends a cone with a half-angle of 105. This tiling scheme was applied to both the GRB and random field data sets to realize 697 and 8802 independent directions in space satisfying all the criteria described previously. Taking advantage of the fact that each field observation was blocked into a 250 s segment, the number of independent observations was multiplied by 5 by regarding each 50 s time slice as a separate sample. Thus, there are 3485 background measurements taken from LAT observations obtained simultaneously with the candidate GRB fields and an additional 44,010 samples taken under similar but not identical conditions. One particular concern for an analysis of this type is that false positives will selectively occur as the sample photon rate rises substantially above the mean. Evidence that this is not the case here is shown in Figure 2 which plots the cumulative distribution of the total number of photons within the LAT FoV over a 250 s interval. These rates explicitly exclude contamination from photons beyond the 105° zenith-angle cut. As shown in the plot, the two low-fluence GRB events reported here are not associated specifically with fields with high-ambient background rates. The similarity of the distributions for GRB and random fields also shows that the GRB data are not pathological as far as rates are concerned.
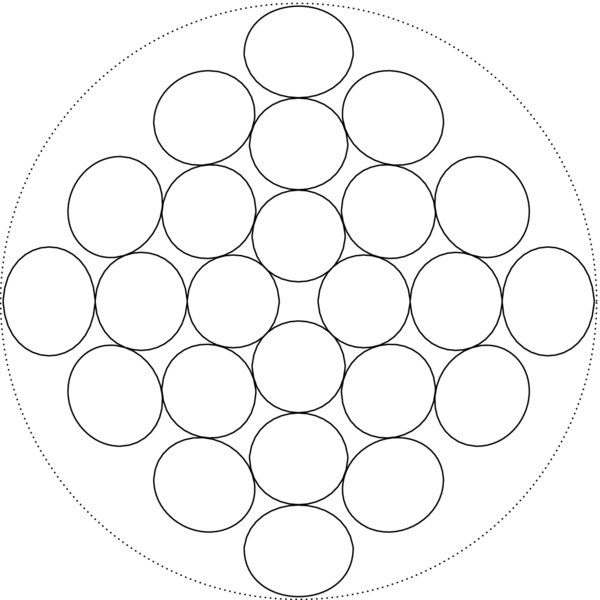
Figure 1. 105 tiling of the LAT FoV. Twenty-four disks are closely confined within the 68° radius of the dotted circle that characterizes the acceptance of the LAT instrument.
Download figure:
Standard image High-resolution image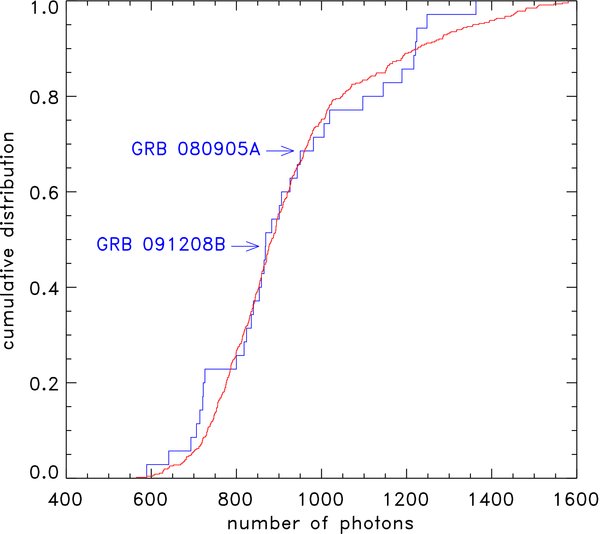
Figure 2. Cumulative distributions of LAT photon rates over 250 s intervals for the GRB (blue) and random background (red) fields. These rates reflect the entire LAT FoV except for photons that lie outside the 105° zenith-angle cut. The rates corresponding to the two claimed GRB detections are indicated by arrows.
Download figure:
Standard image High-resolution image4. RESULTS
The statistical weighting scheme with the additional fractional sharing requirement clearly identified four of the six events previously associated with high-energy gamma-ray emission. The exceptions were GRB 090323 and GRB 0903028A for which photon counts were very sparse during the first 50 s following the burst trigger. Of the two, 090323 was marginally detected by the matched filter technique but GRB 0903028A provided no sign of a signal whatsoever. This gives some order of magnitude indication of the likely efficiency of the method. Three of the six were extremely intense with 100 or more energetic photons (GRB 080916C, GRB 090510, and GRB 090902B). As will be discussed later, the existence of such a substantial bright fraction is a rather surprising situation.
Most significantly, our analysis identified two additional bursts, GRB 080905A and GRB 091208B, as probably associated with energetic photon detections in the LAT. The best estimate for the probability of these occurring by chance alone was obtained by performing identical searches on random LAT fields with the same criteria. Thus, 1 out of 44,010 random fields generated matched filter weights exceeding the value for GRB 080905A and 11 similar fields generated weights exceeding the value for GRB 091208B. Multiplying by a trial factor of 35 for the number of localized fields considered, the associated probabilities are 8.0 × 10⁻⁴ and 8.7 × 10⁻³. To check that these correlations were simply not due to preferentially higher background rates for the GRB exposures, we also performed similar calculations for the LAT data confined to ∼20 uncorrelated directions and five independent time intervals from the same GRB data sets. All of these results are plotted as cumulative distributions in Figure 3. The statistical similarity of the GRB off-axis and random field data demonstrates that the GRB data set is not correlated with anomalous environmental conditions such as higher cosmic ray background rates. A list of photons associated with these two events is provided in Table 1.

Figure 3. Complements of the cumulative distributions for ζ∑wi for 35 well-localized GRB fields (blue), 3485 random fields obtained nearly simultaneously with the GRB data (red), and 44,010 random fields obtained at random times (green).
Download figure:
Standard image High-resolution imageTable 1. List of High-energy Photons for GRB 080905A and GRB 091208B
| i | t (s) | θ (°) | E (MeV) | c | wi |
|---|---|---|---|---|---|
| GRB 080905A | ζ = 0.2118 | ζ∑wi = 69.66 | |||
| 1 | 10.019 | 0.21 | 474 | 3 | 267.07 |
| 2 | 5.661 | 2.27 | 181 | 3 | 61.06 |
| 3 | 6.727 | 10.41 | 103 | 2 | 0.77 |
| GRB 091208B | ζ = 0.8442 | ζ∑wi = 17.23 | |||
| 1 | 17.932 | 2.06 | 131 | 3 | 11.18 |
| 2 | 20.985 | 2.72 | 125 | 2 | 3.94 |
| 3 | 4.968 | 1.66 | 544 | 1 | 3.02 |
| 4 | 6.364 | 1.16 | 1179 | 1 | 2.07 |
| 5 | 19.735 | 7.17 | 197 | 3 | 0.20 |
Download table as: ASCIITypeset image
Two independent observations at significance levels of 0.1% and 1% already make this a reasonably credible result. However, as we discovered the importance of LAT "diffuse" photons for identifying point sources such as GRBs, we realized that independent of the matched filter weight analysis, a simple count of the number of such quanta was statistically quite significant. Thus, for the 35 well-localized GRB fields that do not include the previously reported LAT-detected GRBs, the total number of "diffuse" photons is 25 for a rate of 0.714 ± 0.143. For the GRB off-axis fields and the random fields, the comparable numbers are 1384 for 3485 fields and 17,414 for 44,010 to yield per field rates of 0.397 ± 0.011 and 0.396 ± 0.003. The random probability of such differences is less than 2.7%. As can be seen from the lists of photon counts in Tables 1 and 2, the two new GRB identifications are strongly correlated with these "diffuse" photons as well. Thus, the combined probability that these claims might be randomly generated must be less than 1 × 10⁻⁵.
Table 2. List of 41 Precisely Located LAT-observed GRBs
| i | GRB | T90 | UT | Triggera | αb | δc | θzenithd | θboree | bf | ntotalg | n1h | n2h | n3h | ζ∑wii | SGBMj | SLATk |
|---|---|---|---|---|---|---|---|---|---|---|---|---|---|---|---|---|
| (s) | (°) | (°) | (°) | (°) | (°) | (μerg cm−2) | (μerg cm−2) | |||||||||
| Previously reported GRBs with LAT-detected photons | ||||||||||||||||
| 1 | 080916C | 100.9 | 00:12:45 | Fermi/GBM | 119.847 | −56.638 | 83.657 | 48.838 | −13.760 | 916 | 26 | 31 | 85 | 7910.540 | 120.00 | 70 |
| 2 | 090323 | 70.0 | 00:02:42 | Fermi/GBM | 190.709 | 17.054 | 69.558 | 59.538 | 79.731 | 763 | 2 | 0 | 2 | 10.570 | 100.00 | 36 |
| 3 | 090328A | 100.0 | 09:36:46 | Fermi/GBM | 90.665 | −41.883 | 71.005 | 64.538 | −26.384 | 932 | 4 | 2 | 1 | 0.606 | 80.90 | 33 |
| 4 | 090510 | 0.3 | 00:23:00 | 351588 | 333.553 | −26.583 | 52.541 | 13.468 | −55.074 | 898 | 26 | 48 | 112 | 31389.817 | 21.00 | 37 |
| 5 | 090902B | 21.0 | 11:05:08 | Fermi/GBM | 264.939 | 27.325 | 41.225 | 50.954 | 26.911 | 1088 | 54 | 49 | 93 | 8530.459 | 352.00 | 590 |
| 6 | 091003 | 21.1 | 04:35:45 | Fermi/GBM | 251.520 | 36.625 | 62.298 | 12.306 | 40.055 | 1062 | 8 | 2 | 7 | 1107.330 | 37.60 | 13 |
| New candidate GRBs with LAT-detected photons | ||||||||||||||||
| 7 | 080905A | 1.0 | 11:58:54 | 323870 | 287.674 | −18.880 | 30.418 | 29.860 | −12.605 | 950 | 2 | 1 | 3 | 69.660 | 0.56 | 3 |
| 8 | 091208B | 14.9 | 09:49:57 | 378559 | 29.392 | 16.890 | 28.815 | 55.885 | −43.150 | 868 | 2 | 1 | 3 | 17.227 | 5.80 | 3 |
| GRBs with no significant LAT-detected photons | ||||||||||||||||
| 9 | 080804 | 34 | 23:20:14 | 319016 | 328.668 | −53.185 | 83.852 | 58.149 | −48.369 | 641 | 0 | 0 | 0 | 0 | *6.00 | |
| 10 | 080810 | 106 | 13:10:12 | 319584 | 356.794 | −0.320 | 29.913 | 62.123 | −59.066 | 1019 | 1 | 0 | 0 | 0 | 6.90 | |
| 11 | 080906 | 147 | 13:33:16 | 323984 | 228.042 | −80.518 | 71.429 | 36.599 | −19.264 | 1189 | 11 | 1 | 1 | 0.034 | *5.83 | |
| 12 | 080916B | 32 | 14:44:47 | 324907 | 163.665 | 69.065 | 55.357 | 27.941 | 44.707 | 1248 | 9 | 0 | 1 | 1.975 | 10.90 | |
| 13 | 080928 | 280 | 15:01:32 | 326115 | 95.070 | −55.200 | 76.016 | 45.239 | −26.313 | 726 | 3 | 0 | 1 | 0 | 3.50 | |
| 14 | 081003A | ∼30 | 13:46:12 | INTEGRAL | 262.391 | 16.571 | 21.858 | 56.387 | 25.363 | 926 | 2 | 0 | 1 | 0 | ... | |
| 15 | 081012 | 29 | 13:10:23 | 331475 | 30.201 | −17.638 | 68.915 | 61.566 | −71.399 | 721 | 1 | 0 | 0 | 0 | 4.30 | |
| 16 | 081016B | 2.6 | 19:47:14 | 331856 | 14.564 | −43.530 | 83.851 | 65.064 | −73.540 | 1224 | 2 | 0 | 0 | 0 | *0.17 | |
| 17 | 081029 | 270 | 01:43:56 | 332931 | 346.773 | −68.156 | 79.789 | 57.063 | −46.109 | 981 | 3 | 0 | 1 | 0.001 | *3.50 | |
| 18 | 081104 | 59.1 | 09:34:42 | 333666 | 100.489 | −54.720 | 66.142 | 32.627 | −23.173 | 835 | 3 | 0 | 1 | 0 | *3.33 | |
| 19 | 081118 | 67 | 14:56:36 | 334877 | 82.593 | −43.301 | 65.099 | 30.522 | −32.485 | 706 | 2 | 1 | 0 | 0.001 | 0.11 | |
| 20 | 081127 | 37 | 07:05:08 | 335715 | 332.064 | 6.851 | 20.654 | 52.608 | −37.920 | 869 | 2 | 0 | 0 | 0 | *0.82 | |
| 21 | 081222 | 24 | 04:53:59 | 337914 | 22.741 | −34.096 | 29.145 | 51.259 | −79.017 | 714 | 7 | 1 | 2 | 0.447 | 13.50 | |
| 22 | 090113 | 9.1 | 18:40:39 | 339852 | 32.057 | 33.429 | 21.263 | 32.518 | −26.760 | 883 | 3 | 0 | 2 | 0 | *1.27 | |
| 23 | 090407 | 310 | 10:28:25 | 348650 | 68.979 | −12.679 | 13.189 | 34.739 | −35.741 | 800 | 3 | 1 | 0 | 0 | *1.83 | |
| 24 | 090516A | 210 | 08:27:50 | 352190 | 138.261 | −11.854 | 11.567 | 31.509 | 24.261 | 1217 | 6 | 0 | 0 | 0 | 23.00 | |
| 25 | 090518 | 6.9 | 01:54:44 | 352420 | 119.954 | −0.759 | 33.312 | 49.588 | 14.806 | 854 | 2 | 0 | 1 | 0 | 1.60 | |
| 26 | 090519 | 64 | 21:08:56 | 352648 | 142.279 | −0.180 | 51.625 | 50.424 | 34.312 | 693 | 3 | 1 | 0 | 0.018 | *2.00 | |
| 27 | 090529 | >100 | 14:12:35 | 353540 | 212.469 | 24.459 | 80.559 | 23.511 | 72.163 | 589 | 11 | 0 | 0 | 0.017 | *1.13 | |
| 28 | 090702 | ∼10 | 10:40:37 | INTEGRAL | 175.897 | 11.502 | 80.386 | 62.327 | 67.683 | 859 | 1 | 0 | 0 | 0 | ... | |
| 29 | 090708 | 15.0 | 03:38:15 | 356776 | 154.632 | 26.616 | 79.492 | 56.487 | 56.031 | 1006 | 1 | 0 | 0 | 0 | 0.40 | |
| 30 | 090709B | 27.2 | 15:07:42 | 356912 | 93.522 | 64.081 | 85.836 | 46.897 | 20.304 | 818 | 2 | 1 | 1 | 0.025 | 1.30 | |
| 31 | 090712 | 145 | 03:51:05 | 357072 | 70.097 | 22.525 | 60.746 | 33.281 | −15.676 | 865 | 8 | 1 | 0 | 0.715 | 4.20 | |
| 32 | 090728 | 59 | 14:45:45 | 358574 | 29.653 | 41.633 | 90.838 | 60.660 | −19.505 | 1221 | 2 | 0 | 0 | 0 | *1.67 | |
| 33 | 090813 | 7.1 | 04:10:43 | 359884 | 225.779 | 88.568 | 72.707 | 35.418 | 28.328 | 824 | 2 | 0 | 0 | 0 | 3.50 | |
| 34 | 091010 | 8.1 | 02:43:09 | AGILE | 298.666 | −22.518 | 68.465 | 55.714 | −23.488 | 1145 | 3 | 0 | 3 | 0.001 | 10.90 | |
| 35 | 091127 | 7.1 | 23:25:45 | 377179 | 36.583 | −18.953 | 54.011 | 25.423 | −66.738 | 840 | 8 | 0 | 1 | 0.130 | 18.70 | |
| 36 | 091202 | ∼50 | 23:10:12 | INTEGRAL | 138.834 | 62.550 | 69.166 | 23.256 | 40.214 | 906 | 7 | 0 | 1 | 0.289 | ... | |
| 37 | 091221 | 68.5 | 20:52:52 | 380311 | 55.797 | 23.241 | 87.598 | 53.620 | −24.755 | 943 | 4 | 0 | 0 | 0 | 13.80 | |
| 38 | 100111A | 12.9 | 04:12:49 | 382399 | 247.048 | 15.551 | 48.142 | 33.854 | 38.604 | 1363 | 6 | 0 | 2 | 0 | 1.50 | |
| 39 | 100206A | 0.12 | 13:30:05 | 411412 | 47.162 | 13.157 | 49.423 | 44.608 | −37.742 | 1097 | 6 | 0 | 0 | 0.001 | 0.93 | |
| 40 | 100212A | 136 | 14:07:22 | 412081 | 356.418 | 49.494 | 56.829 | 23.422 | −11.989 | 901 | 4 | 0 | 0 | 0 | 0.38 | |
| 41 | 100316D | ∼740 | 12:44:50 | 416135 | 107.628 | −56.255 | 90.330 | 50.079 | −19.759 | 722 | 5 | 0 | 0 | 0 | *0.50 | |
Notes.
aSwift trigger number if numeric; otherwise satellite name.
bGRB right ascension.
cGRB declination.
dAngle between the local orbit zenith direction and GRB.
eBoresight angle of GRB with respect to the LAT principal axis.
fGRB Galactic latitude.
gTotal number of LAT-detected photons over 250 s interval excluding those beyond 105° zenith-angle cut.
hn1, n2, and n3 are the number of photons within 105 of the GRB direction in 47.5 s window.
iTotal event matched filter weight including the sharing parameter, ζ.
jGBM fluence, SGBM, calculated as described in the main text. * indicates an entry with no available GBM fluence measurement; the value is estimated from the BAT fluence by multiplying by a factor of 1.67, as derived from a joint sample of BAT and GBM measurements. Most other fluence values were taken from Table 2 in Guetta et al. (2010). The exceptions were obtained from the following references: GRB 080905A, Bissaldi et al. (2008); GRB 081118, Bhat et al. (2008); GRB 090510, Guiriec et al. (2009); GRB 090518, Paciesas (2009); GRB 100206A, von Kienlin (2010).
kLAT fluence, SLAT, calculated as described in the main text.
GRB 080905A is a short burst with optical counterparts and a redshift of 0.128 (Rowlinson et al. 2010), while GRB 091208B is a long burst also with optical counterparts (Pagani et al. 2010) and a redshift of 1.063 (Wiersema et al. 2010; Perley et al. 2010). As listed in Table 1, the estimated number of >100 MeV photons for each event is about 3. This is substantially lower than any previous LAT GRB identifications. Estimating the corresponding fluence of >100 MeV photons raised some interesting statistical issues that are perhaps not well appreciated. To first order, one would anticipate simply adding up all the energies of the detected quanta and dividing by the effective detector area. Although this produces a number, it bears only a casual relation to the intrinsic properties of the GRB in question. The reason is that the spectral number distribution, dN/dE follows a power law with exponent between −3 and −2. Thus, the mathematical mean is defined but the variance is infinite. This leads to the conclusion that sums of energies drawn from the identical parent population will vary by factors of the order of unity, independent of the number of photons in the sample. In our case, the statistical uncertainty is already substantial since only three photons are detected for each event. Thus, we opted for a solution that invoked the least number of new assumptions: we adopted the LAT fluence values for bright bursts computed by Ghisellini et al. (2010) and listed in their Table 1. We next assumed that the spectral distribution for all bursts was an approximately universal function of energy so that fluences would scale with photon number. This led to estimates of the LAT fluence value of 3 × 10⁻⁶ erg cm−2 for both events. Unfortunately, the proportionality of fluence to photon counts is not very evident. As can be seen in Table 2 for the two bursts, GRB 090510 and GRB 090902B, for essentially the same number of photons, the fluences differ by a factor of 16. This problem may require a better realization of how fluences should be estimated. For future purposes when dealing with events with more numerous quanta, there is a robust measure of fluence: multiply the number of photons by the median energy. In the continuum limit, a power-law distribution generates the following relation between Emean and Emedian over the interval from threshold to infinity:
Thus, a robust proxy for gamma-ray burst fluence can be obtained by multiplying this estimate of Emean by the number of detected photons.
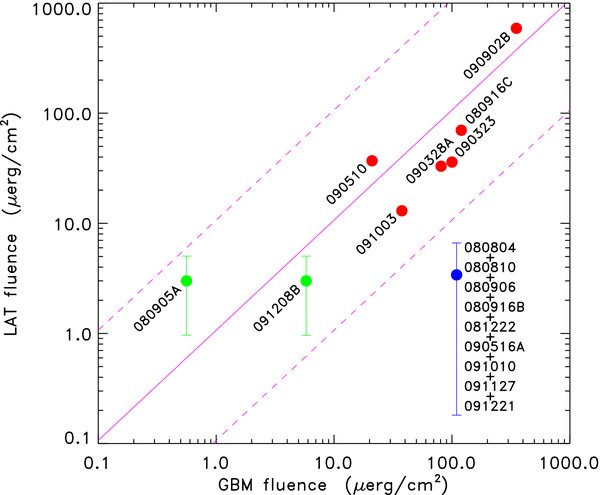
The fact that >100 MeV photons have been observed with both long and short bursts suggests that the production mechanism is generic to relativistic jets, independent of the detailed structure of the progenitor system. So far, most of the high-energy photon observations have been associated with large fluences at the lower energies measured by the Swift/BAT and the Fermi/GBM detectors. To explore such fluence correlations, Figure 4 shows a scatterplot of LAT fluences versus GBM fluences for the six bright bursts previously identified by the LAT collaboration, the two bursts uncovered by the statistical analysis described in this paper and the co-added sum of nine bursts with no strong perceptible radiation above 100 MeV. For these purposes, GBM fluences were defined by photons in the range of 8–1000 keV within the T90 time interval. The LAT fluences were obtained from Ghisellini et al. (2010) and the scaling method described previously.
Figure 4. Plot of high-energy (LAT) fluences vs. low-energy (GBM) fluences for the bursts considered in this paper. The six red points indicate the events previously reported by the LAT team. The two green points were identified by the matched filter technique. The solid magenta line is a linear fit to the six LAT-detected bursts, 080916C, 090323, 090328A, 090510, 090902B, and 091003. The dashed lines above and below indicate LAT fluences 10 times greater and smaller. The blue point is the co-added sum of nine GRBs with GBM fluences comparable to or greater than GRB 091208B, i.e., greater than 5 μerg cm−2. The abscissa is the sum of all nine GBM fluences and the ordinate is estimated from the total of all event class 2 and 3 photons in the corresponding burst fields. This indicates a significant population with high-energy fluences below the approximately 1:1 fluence ratio represented by the diagonal solid magenta line.
Download figure:
Standard image High-resolution image
The salient feature of Figure 4 is the overall linear correlation of the LAT and GBM fluences with a ratio of unity between the two. The short burst identified by our analysis, GRB 080905A, lies above the trend line, a feature previously noted for this class of events (see the discussion of GRB 081024B in Abdo et al. 2010 and GRB 090510 in Ackermann et al. 2010). GRB 091208B is completely consistent with the higher fluence events. An interesting aspect of this graph is the estimate for the total co-added LAT fluence for nine bursts with GBM fluences roughly equal to or greater than GRB 091208B, but which lie a factor of 10 lower but with rather large errors. If one believes that all GRBs have a similar generic behavior, it is possible that a large fraction of these events have delayed high-energy emission that evades our estimates. It is more likely that there is a real population difference between events such as 080916C, 090926A, and 091208B and the majority of all other GRBs. Examining this question with larger data sets may shed some light on the mechanisms that drive high-energy emission processes.
Although the statistics are admittedly crude, we can use this analysis to set some limits on the fraction of high-energy photon GRBs at the present levels of sensitivity. Starting with a sample of 41 well-localized events, we have identified two with high statistical significance. The remaining number of LAT "source" and "diffuse" photons above background is no more than approximately three. The efficiency of this technique is about 50% for a total, so as many as 16 GRBs out of 41 fields could be associated with >100 MeV photons. Thus, instead of 17 LAT-detected GRBs over a two-year period, there might be 45 events or 19% of all viewable GBM triggers with a lower limit of 25 events or 11% of the total. That is lower than any estimates prior to the Fermi launch.
5. DISCUSSION
By using optimal signal detection techniques, we have demonstrated that the existence of GRB high-energy photon emission can be extended downward in brightness by a significant factor. Increasing the dynamic range over which such phenomena can be measured puts a number of constraints on physical models that can describe these events. As we have shown, these statistical methods can set interesting limits on the behavior of ensembles of events at lower levels than is possible for single isolated bursts, raising serious questions about the homogeneity of the GRB phenomenon. After another two years in orbit, the Fermi data will increase enough to allow more careful re-examination of the initial conclusions presented here.
The most surprising aspect of this work is the very small number of GRBs that could be positively identified with high-energy emission as a result of the substantially lower fluence thresholds. Almost any model would anticipate an increase in number proportional to the inverse of the ratio of detection thresholds raised to the power of unity or greater. Monte Carlo estimates indicate that our detection efficiency was of the order of 50% for the two events reported. This does not come close to explaining the apparent deficit of low-intensity events compared to the number of bursts similar to GRBs 080916C, 090510, and 090902B. We look forward to pursuing this problem during this precious and unique period when both Fermi and Swift are working magnificently.
We thank Chris Shrader, director of the Fermi Science Support Center for his considerable help in obtaining and interpreting the Fermi mission data products. Fang Yuan provided valuable assistance in the initial process of learning how to access and manipulate the Fermi data. This research is supported by NASA grant NNX08AV63G and NSF grant PHY-0801007.
Footnotes
- 3
- 4
- 5