


ABSTRACT
We explore the longitude–velocity distribution of 6.7 GHz methanol masers in the context of the inner structure of our Galaxy. We analyze the correlation in velocities within this distribution and identify density enhancements indicating large-scale regions of enhanced star formation. These are interpreted as the starting points of the spiral arms and the interaction of the Galactic bar with the 3 kpc arms. The methanol masers support the presence of a long thin bar with a 45° orientation. Signatures of the full 3 kpc arm structure are seen, including a prominent tangent at approximately −22° Galactic longitude. We compare this distribution with existing models of the gas dynamics of our Galaxy. The 3 kpc arm structure appears likely to correspond to the radius of corotation resonance of the bar, with the bar on its inner surface and the starting points of the spiral arms on its outer surface.
Export citation and abstract BibTeX RIS
1. INTRODUCTION
Studying the structure and dynamics of the Milky Way is complicated by our location within it, and the resultant obscuration along the line of sight, but nevertheless it has established that our Galaxy has a grand spiral structure, with spiral arms, interior structures such as the 3 kpc arms (van Woerden et al. 1957; Dame & Thaddeus 2008) and one or two Galactic bars (Blitz & Spergel 1991; Gerhard 2002, and references therein; Benjamin et al. 2005). Early descriptions of the structure of our Galaxy were inferred from star counts and positioning of objects with photometric distances, but current revisions have been largely based upon the kinematics of atomic and molecular tracers, such as H i and CO. The sinusoidal distribution of velocities with Galactic longitudes has established the approximately circular and symmetric rotation of the Galaxy and both tracers have been used to constrain dynamical models (e.g., Peters 1975; Burton & Liszt 1978; Liszt & Burton 1978; Binney et al. 1991; Weiner & Sellwood 1999; Fux 1999). However, there are limitations to this approach. H i is detected throughout the Galaxy in such great abundance that only the highest or lowest velocities along a given line of sight (the terminal velocities and spiral arm tangent deviations) can be used to constrain dynamical modeling. CO is less diffuse and more concentrated in the major structural features of our Galaxy, but surveys of CO are limited by a lack of sensitivity to material on the far side of the Galaxy. An alternative tracer, the population of 6.7 GHz methanol masers, has the advantage of only being observed toward regions of high-mass star formation (Pestalozzi et al. 2002; Minier et al. 2003; Sridharan et al. 2002; Walsh et al. 2003; Xu et al. 2008) and the strong and narrow emission of these masers is well correlated with their systemic velocity, the central maser velocity typically within 3–5 km s−1 (Szymczak et al. 2007; Pandian et al. 2009). They are also found in abundance throughout the Galaxy (Pestalozzi et al. 2005) and have been detected to Galactocentric distances of 13.5 kpc (Honma et al. 2007). Inner Galaxy structures have been shown to be traced by 6.7 GHz methanol masers: 45 sources are associated with the 3 kpc arms (Green et al. 2010), seven sources with the high velocities associated with Galactic bars (Caswell 1997; Caswell et al. 2010; Green et al. 2010), and 11 with Sagittarius B2 (Caswell et al. 2010, and references therein). The 6.7 GHz methanol masers are excellent measures of the kinematic behavior of the structure of our Galaxy within the terminal velocities outlined in H i and CO.
In this paper, we explore how 6.7 GHz methanol masers trace the major star-forming structures of the inner Galaxy, specifically: the Galactic bar, the 3 kpc arms, and the origins of the spiral arms. All of these structures are believed to be confined within ∼4 kpc of the Galactic center. Assuming a solar distance of 8.4 kpc (Ghez et al. 2008), the inner 4 kpc of the Galaxy is geometrically contained within the Galactic longitude range −28° to +28°. The Methanol Multibeam (MMB) survey (Green et al. 2009b), which observed from −174° to +60° with the Parkes Radio Telescope, detected ∼550 masers within longitudes ±28°. The MMB had a 3σ sensitivity of 0.7 Jy, covered the latitude range of ±2°, and had a velocity coverage encompassing the extent of CO emission seen in Dame et al. (2001). The MMB catalog therefore represents the most complete survey of current high-mass star formation traced by 6.7 GHz methanol masers in the region, providing a census of the regions which includes their kinematic behavior. Through examining the distribution and densities of these masers in longitude and velocity, in comparison with the spiral arms, we attempt to delineate the inner Galactic structure.
2. 6.7 GHz METHANOL MASER DISTRIBUTION AND DENSITY ENHANCEMENTS
The longitude–velocity (l, v) distribution of 6.7 GHz methanol masers between longitudes ±28° is shown in Figure 1. It is immediately apparent by eye that the maser distribution is not entirely random, but contains clumps of sources on the sub-degree scale over a few kilometers per second, together with structures on the scale of several degrees over tens of kilometers per second. The former is due to multiple sources within molecular cloud complexes, while the latter is a signature of Galactic scale structures. A structure function of the l, v distribution formally demonstrates the presence of this structure, quantifying the velocity correlation for given angular separations. We define the second-order structure function of velocity as a function of angular separation:

where x is the angular position of a maser site and r is the angular separation between a pair of maser sites. We take the ensemble average of measurements with the same range of angular separation (denoted by the angular brackets). The resulting structure function is shown in Figure 2 for both the masers and a Monte Carlo simulation together with statistical errors. The Monte Carlo simulation is a random distribution of masers in the plane of the Galaxy with longitudes between ±28° and Galactocentric distances between 3 and 13.5 kpc. The masers were assigned velocities based on a Galactocentric solar distance of 8.4 kpc (Ghez et al. 2008; Gillessen et al. 2009) and flat rotation curve with a circular rotation of the Sun of 246 km s−1 (Reid et al. 2009b; Bovy et al. 2009). We generated 482 sources by this method, to match the observed quantity for the l, v domain, i.e., not including the 63 masers mentioned in the introduction associated with the 3 kpc arms (45), Galactic bar (7), and Sagittarius B2 (11). A power-law fit to the structure function gives a gradient in the log–log plane of +0.09 ± 0.01 for the masers and −0.02 ± 0.01 for the Monte Carlo simulation (with the errors the formal errors in the fit). The consistent positive gradient of the structure function of the data is indicative of a clumpiness of structure on large scales (both angular and in velocity) and a correlation on small scales. In comparison, the approximately flat structure function of the Monte Carlo simulation demonstrates the same level of velocity correlation at all scales, i.e., no scale-specific structure. The measured structure function departs from the simulation, within the errors (both formal and statistical), at scales less than 0 03 (with correlated velocities up to 30 km s−1) and at scales greater than 3° (with correlated velocities up to 50 km s−1). Smoothing the distribution of sources on the small scales (by counting all sources within 003 and 30 km s−1 singularly) and binning the data on the large scales, we produce the l, v density distribution seen in Figure 3. The non-zero mean of the bins is 3.7 sources, giving a Poisson noise of 1.9 sources. At a 5σ confidence level, statistically significant density fluctuations are therefore those with 9.7 or more sources, and these are highlighted in Figure 3. The density enhancements are also apparent in the distribution of number counts with longitude as shown in Figure 4.
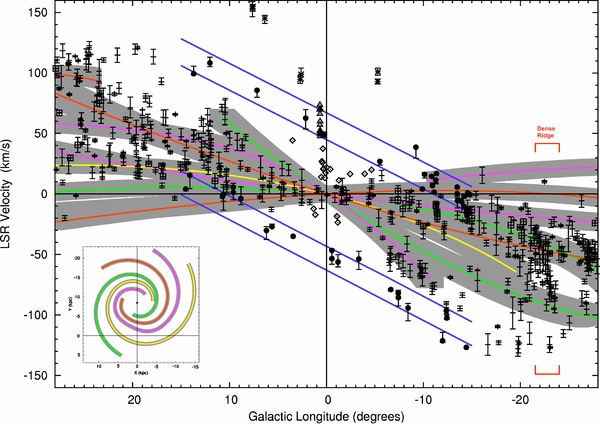
Figure 1. Longitude–velocity "crayon" plot showing the distribution of 6.7 GHz methanol masers within ±28° overlaid with example spiral arm loci (the spatial pattern of Taylor & Cordes (1993), transferred to the l, v domain by the Brand & Blitz (1993) rotation curve). Colored loci are the spiral arms defined by the model, and gray shading incorporates an arm thickness of 1 kpc and a velocity tolerance of 7 km s−1. Yellow loci represent the Perseus spiral arm; purple, Carina–Sagittarius; orange, Crux–Scutum; and green, Norma. The blue lines delineate the region identified in CO emission as the 3 kpc arms by Dame & Thaddeus (2008). Crosses show 6.7 GHz methanol masers of the MMB survey. Circles are masers associated with the 3 kpc arms (see Green et al. 2009a, 2010; Caswell et al. 2010, for details). Diamonds are masers which are interior to the 3 kpc arms, primarily candidates for belonging to the Galactic center zone (Caswell et al. 2010). Triangles are masers associated with the Sagittarius B2 complex. Stars are masers associated with the Galactic bar. Crosses enclosed in squares are masers with high latitudes (and therefore likely to be closer to us than 4.5 kpc, see Section 2). The starting points of the spiral arms have been adjusted from Taylor & Cordes (1993) to match the discussion of Section 3.3. The red brackets highlight the longitude range of the dense ridge of sources discussed in the text.
Download figure:
Standard image High-resolution image
Figure 2. Velocity structure function showing the correlation in velocity for given angular separations of maser sites. The data are binned in equal logarithmic bins (0.3) and compare all the MMB data between ±28° longitude (red) with a Monte Carlo simulation (black). The Monte Carlo simulation has been systematically offset in angular separation by +0.05 for clarity of comparison. The error bars represent the statistical (Poisson) error in the mean of each bin.
Download figure:
Standard image High-resolution image
Figure 3. Longitude–velocity "blockbusters" plot showing the density of masers within the l, v domain. As described in the text, the distribution of sources seen in Figure 1 has been smoothed on scales <003 and then binned on scales ⩾3°. Hexagonal bins were used as they reduce the visual distortion in the distribution caused by binning. The color scale represents the number of sources. Black lines delineate statistically significant dense regions, at the 5σpoisson level. Labels correspond to enhanced star formation at the ends of the Galactic bar and the starts of the spiral arms.
Download figure:
Standard image High-resolution image
Figure 4. Distribution of sources with longitude in 2° bins. Median number count per bin is 18 (red line). Errors represent Poisson statistical error margins. Beyond the limits of the figure, existing maser data suggest the number counts decline to (or below) the average beyond −28°, but show a peak at positive longitudes, beyond +28°.
Download figure:
Standard image High-resolution imageThe majority of the Galactic scale structure seen in the 6.7 GHz methanol maser l, v domain is interpretable as the spiral arms. Figure 1 overlays the masers on the loci of the spiral arms commonly adopted in analyses of structure in the l, v domain: the four-arm shape of Taylor & Cordes (1993), effectively the same as that of Georgelin & Georgelin (1976), transferred to the l, v domain using the rotation curve of Brand & Blitz (1993). We adopt the solar rotation and radius as mentioned in the previous paragraph and use these throughout the discussion. The choices of rotation curve, solar parameters, and spiral arm shape have minimal effect, but these are addressed in detail in the Appendix. Sources already associated with star-forming regions toward the Galactic center (Sgr B2, the Galactic center zone (GCZ), and sites within 3.5 kpc of the Galactic center; see Caswell et al. (2010) for details) and the parallel sections of the 3 kpc arms between longitudes ±15° are distinguished by different symbols. With these excluded from consideration, then incorporating an arm thickness of 1 kpc with a velocity tolerance of ±7 km s−1, we find the spiral arms account for 79% of the masers. The Monte Carlo simulation (from 100 realizations) gives an average (both mean and median) number of associated sources of 69% with a standard deviation of 2%, implying the association of real masers is statistically significant (none of the Monte Carlo simulations exceed 72% association). We chose an arm thickness of 1 kpc based on estimates of the inter-arm separation and typical widths of the arms in models (see, for example, Gómez & Cox 2004; Sewilo et al. 2004; McClure-Griffiths et al. 2004; Levine et al. 2006). Varying the arm thickness between 0.5 and 1.5 kpc results in the level of association varying between 49% and 79%. Our velocity tolerance of ±7 km s−1 is chosen based on the kinematic uncertainty of the masers in relation to the high-mass star-forming region they are tracing (Reid et al. 2009b; Pandian et al. 2009). Varying the velocity tolerance between 5 km s−1 and 10 km s−1 results in an association of between 58% and 80%. The unassociated sources (approximately 20%) lie almost exclusively in the longitude regions 18°–28° with velocities >100 km s−1 and between −19° and −24° with velocities between 0 and −130 km s−1. These sources will be discussed in the following sections.
3. STRUCTURAL INTERPRETATION OF l, v DISTRIBUTION
The l, v distribution raises the question: what are the causes of the statistically significant overdensities—are they related to Galactic structure or random fluctuations in star formation? Regions of star formation are contained within giant molecular clouds (GMCs) which have physical scales of tens of parsecs. With the high-mass star formation traced by the 6.7 GHz masers, we are looking at regions at typical distances of ⩾2 kpc (the l, v distribution within ±28° suggesting mostly ⩾4 kpc). At these distances, most GMCs subtend angular scales smaller than 1°. The coherent dense regions of sources seen in Figure 1, and listed in Table 1, are on scales of >1° (highlighted by their presence post-smoothing in Figure 3). This makes random fluctuations, unrelated to Galactic scale processes, an unlikely cause of the increased star formation. This section analyses the 6.7 GHz methanol maser l, v distribution in relation to the major structural features of the inner Galaxy. We begin with the Galactic bar, then the 3 kpc arms, and follow with the starting points of the spiral arms or the spiral arm "origins." Excluded from the discussion are masers at high latitudes, as these are unlikely to lie within 4 kpc of the Galactic center. With a scale height of star formation estimated to be ∼30–40 pc (Fish et al. 2003), any masers whose latitudes imply a Galactic height, z, greater than ±60–80 pc at a heliocentric distance of 4.4 kpc can be excluded from inner Galaxy considerations. This corresponds to latitudes 08–10 and we therefore adopt 09 as a cutoff. Within the longitude region ±28°, there are 29 masers with latitudes in excess of 09 from the plane.
Table 1. Parameters of Density Enhancements of 6.7 GHz Methanol Masers in the Longitude–Velocity Domain
| Longitude Range | Latitude Range | Velocity | Source | Associated | |||
|---|---|---|---|---|---|---|---|
| l min | l max | b min | b max | b med | Range | Density | Galactic Structures |
| (°) | (°) | (°) | (°) | (°) | (km s−1) | (kpc−2) | |
| +24 | +28 | −0.3 | +0.3 | 0.1 | >90 | 11 | Crux–Scutum arm origin |
| +18 | +22 | −0.5 | +0.1 | −0.1 | +40,+65 | 15 | Near-side Galactic bar? |
| +10 | +14 | −0.6 | +0.5 | −0.1 | 0,+70 | 38† | Norma arm origin? |
| All spiral arms | |||||||
| −4 | +6 | −0.5 | +0.3 | −0.1 | −20,+20 | 18† | Sgr B2, GCZ, |
| All spiral arms | |||||||
| All solar circle masers | |||||||
| −11 | −6 | −0.2 | +0.2 | 0.0 | −45,−70 | 15 | Carina–Sgr arm origin |
| −15 | −9 | −0.5 | +0.4 | 0.0 | −30,+10 | 16 | Far 3 kpc arm |
| and far-side Galactic bar | |||||||
| −24 | −20 | −0.5 | +0.6 | −0.1 | −30,−95 | 48† | 3 kpc arm tangent, |
| Perseus arm origin, | |||||||
| and Norma, Crux–Scutum arms | |||||||
| −28 | −24 | −0.7 | +0.8 | −0.2 | −35,−70 | 20† | Crux–Scutum |
| and Norma arms | |||||||
Notes. For explanation of source density see the main text. Densities with † are the sum of more than one enhancement, confused by multiple passes of spiral arms along the line of sight. The last column lists Galactic structures which are believed to be responsible for the enhancement.
Download table as: ASCIITypeset image
3.1. The Galactic Bar
The Galactic bar has usually been regarded as either a triaxial boxy bulge (or "peanut"), principally on the basis of Cosmic Background Explorer (COBE) infrared observations, or as a long thin bar. Blitz & Spergel (1991) speculated that the Galaxy might contain two bar components and recent consensus is that both these types of bars exist (Hammersley et al. 2000; Benjamin et al. 2005; Cabrera-Lavers et al. 2008). The orientation of the bar with respect to the Sun–Galactic-center line of sight is thought to lie between 14° and 45°, but many of the lower inclination angles are for boxy bulge bar models, while the larger angles are for long thin bars (and confusion has been added with the interchangeable and sometimes ambiguous use of the bulge and bar terms, see discussions of Ng 1998 and López-Corredoira et al. 1999). This has led to a likely picture of a triaxial bulge bar inclined at 20°–30° and a long thin bar at ∼45°. This combination is shown relative to the 3 kpc arms in Figure 5. Primarily on the basis of models based on infrared (IR) data, the radius of corotation resonance of the bar (of the order of 1.2 times the semi-major axis of the bar; Elmegreen et al. 1996; Englmaier & Gerhard 2006; Buta & Zhang 2009) is estimated to be 4 ± 0.5 kpc (Gerhard 2002, and references therein). In galaxies, this radius marks the transition from elliptical orbits following the bar to circular orbits beyond (Contopoulos & Papayannopoulos 1980). As noted in the introduction, several 6.7 GHz methanol masers have been associated with the Galactic bar. Where the Galactic bar and the 3 kpc arms meet (discussed in Section 3.2), a region of enhanced star formation is expected (e.g., Fux 1999; Englmaier & Gerhard 1999; López-Corredoira et al. 2001; Binney & Tremaine 2008). This means that a density enhancement in either the near or far 3 kpc arm 6.7 GHz methanol maser population could indicate the interaction with the end of the bar. Such an enhancement has been suggested in the far 3 kpc arm population (Green et al. 2010) and we now address both this and possible near-side interactions.

Figure 5. Schematic of the two simple interpretations of the 3 kpc arms. The blue represents the 3 kpc arms as either an elliptical structure or a ring. The black line is the Sun–Galactic center. Black short dashes represent the long bar and gray long dashes represent the short bar.
Download figure:
Standard image High-resolution image3.1.1. Density Enhancement at the Far End of the Bar
The 6.7 GHz methanol maser population tracing the 3 kpc arms exhibits a high density of sources within the far 3 kpc arm between longitudes −9° and −15° (see Figure 3 and Table 1). Within this dense region, eight sources with velocities >0 km s−1 partially overlap with the extrapolated outer Galaxy components of the Carina–Sagittarius and Crux–Scutum arms (at distances >15 kpc) and six sources with velocities between 0 and −30 km s−1 overlap with the Carina–Sagittarius arm (which passes between the Galactic center and the Sun at a distance of <1.1 kpc Sato et al. 2010).
The distances of these arms will have an impact on the flux–density distribution of the sources, an effect that can be estimated if we assume a simple power-law luminosity distribution (e.g., Pestalozzi et al. 2007) above the sensitivity limit of the MMB (0.7 Jy; Green et al. 2009b): at 15 kpc heliocentric distance only the brightest sources would be detected, while at 1 kpc heliocentric distance very faint sources would be. If the far 3 kpc arm sample of sources was significantly biased by distant sources, we would expect a shallow distribution of peak flux densities, while if it was biased by nearby sources, we would expect an asymmetric distribution with a peak at very low peak flux densities. We do not see either, instead finding an approximately Gaussian distribution with a median of 2.4 Jy, implying a population dominated by intermediate distances. Furthermore, the far spiral arms are not well traced by H i or CO at these longitudes, so their location is less precise. Regions of high-mass star formation are comparatively rare, so without either of the spiral arms being tangential, we would not expect there to be a significant population present in either. These factors combine to give us confidence that the dense region identified by Caswell et al. (2010) and Green et al. (2010) is a product of far 3 kpc arm sources interacting with the bar.
3.1.2. Density Enhancement at the Near End of the Bar: Implications for Length and Orientation
Expanding on the analysis of Green et al. (2010), we assume a bar orientation of 45° (e.g., Benjamin et al. 2005), with the semi-major axis left as a free parameter. The density enhancement at the far end of the bar (between longitudes −9° and −15°) thus implies a semi-major axis of the bar between 2.2 and 4.3 kpc. This indicates that the near end of the bar lies between longitudes 13° and 30°. We see from Table 1 and Figure 3 that there are three higher density regions of masers within this range: between 10° and 14° longitude (one bin above 5σpoisson); between 18° and 22° longitude (one bin above 5σpoisson); and between 24° and 28° longitude (one bin above 5σpoisson); these correspond to semi-major axes of 1.8–2.4 kpc, 2.9–3.4 kpc, and 3.7–4.1 kpc, respectively. In dynamical simulations, bars with short semi-major axes (or the assumption of such a mass distribution) are almost exclusively associated with small bar orientation angles (e.g., Binney et al. 1991; Freudenreich 1998; Babusiaux & Gilmore 2005) and a short bar with an acute orientation angle would produce densities in the far 3 kpc arm at longitudes smaller than is observed (Green et al. 2010). Additionally, a shorter bar of this type is associated with the Galactic bulge, but the 6.7 GHz methanol maser population has a narrow latitude distribution unassociated with the bulge (Caswell et al. 2010). Hence, the semi-major axis is unlikely to be in the range 1.8–2.4 kpc. The estimate of a radius of corotation resonance at ∼4 kpc implies that a semi-major axis of 3.7–4.1 kpc is also unlikely.
If, on the other hand, we assume the semi-major axis of the bar is fixed at 3.5 kpc (the estimate of Gerhard 2002, and references therein, scaled to 8.4 kpc) and the bar orientation is instead left as a free parameter, the density enhancement at the far end of the bar implies a bar orientation between 35° and 53°. This range of orientation angles would locate the near end of the bar between longitudes 20° and 24°, which overlaps with the high density of masers seen at velocities close to +50 km s−1 (one bin above 5σpoisson as shown in Figure 3).
In summary, we believe that the maser population traces the influence of a long thin bar with a semi-major axis of ∼3.4 kpc and an orientation of ∼45°. This implies that, if both a long and short bar exist within our Galaxy, it is the long component which is primarily traceable by (high-mass) star formation and is younger. The short boxy/bulge bar was primarily identified in the IR observations of evolved stars and lacks 6.7 GHz methanol maser emission, thereby indicating that it traces an older, more evolved population. Hence, our observations agree with the implied age dichotomy in the bars (e.g., López-Corredoira et al. 2001).
3.2. The 3 kpc Arms
The (near) 3 kpc arm was originally discovered by van Woerden et al. (1957) as an absorption feature with a radial velocity of approximately −50 km s−1 at 0° longitude. It was named by Oort et al. (1958) based on the perceived H i tangent point at longitude −22° corresponding to a Galactocentric radius of 3 kpc (when the solar distance is 8.2 kpc). At this longitude, the distinct feature blends with spiral arm emission. Subsequently, the negative longitude tangent has also been inferred as the cause for peaks in the longitudinal brightness profile of radio continuum at low frequencies (e.g., Beuermann et al. 1985 analysis of Haslam et al. 1981, 1982; 408 MHz data), 2.4 μm emission (e.g., Hayakawa et al. 1981), OH/IR star kinematics (e.g., Sevenster 1999), and IR star counts (e.g., Churchwell et al. 2009). However, the work of Hayakawa et al. (1981) showed that the peak was not evident in higher frequency radio continuum emission, such as at 1.4 GHz (e.g., Mathewson et al. 1962) and 5 GHz (e.g., Lockman 1979). A positive longitude tangent has never been clearly observed. Bania (1980) inferred a tangent at 236 (with a velocity of ∼110 km s−1) by assuming a ring-like structure, based on the ring fit of Cohen & Davies (1976) for the H i data across the longitude range 355°–6°. They found CO emission at ⩽110 km s−1, but it was not distinct from the rest of the Galactic emission. The question remains as to why we do not see a clear positive longitude tangent. One possible explanation is that it could be due to greater obscuration along the line of sight, with a larger length of the Carina–Sagittarius and Crux–Scutum arms present, compared with the negative tangent (where the spiral arms have an orientation almost perpendicular to the line of sight).
Recently, Dame & Thaddeus (2008) discovered the long speculated far 3 kpc arm counterpart in CO emission, tracing both arms between ±15° longitude. Forty-five 6.7 GHz methanol masers were associated with these parallel l, v structures (Green et al. 2009a; Caswell et al. 2010) and one of these, the brightest known methanol maser 9.621+0.196, has a distance of 5.2 ± 0.6 kpc determined by astrometric parallax (Sanna et al. 2009). This places the maser at a Galactocentric distance of 3.4 kpc, concurring with our expectations (see the previous section) for the Galactocentric radius of the 3 kpc arms. The astrometric observations also showed the source to have a velocity component in a radial direction from the Galactic center (41 km s−1) and a velocity component counter to the authors chosen model of Galactic rotation (−60 km s−1 relative to a flat rotation curve with circular velocity of 254 km s−1).
3.2.1. A 3 kpc Arm Tangent
The methanol maser distribution demonstrates a large region with a high density of sources between l = −18° and −28° (Figure 3). This region comprises a dense ridge (in velocity) of sources near l = −22° and a further clump of sources (with a smaller range of velocities) near l = −27° (see Figures 1 and 4). The clump of sources around l = −27° is dominated by the G333 GMC and is coincident with both the Norma arm (close to its tangent) and the Crux–Scutum arm and thus is excluded from the present analysis. The dense ridge near l = −22° however, extends over almost 80 km s−1 of velocity, most of which does not align with common logarithmic spiral arm model loci. The Crux–Scutum arm lies at velocities less negative than −50 km s−1, while the Norma arm lies at velocities more negative than −100 km s−1 and less negative than −50 km s−1, leaving masers in the velocity range of −60 to −85 km s−1 unaccounted for. The only arm in conventional spiral arm models which could be extended into this region is the Perseus arm (see the next section), but by itself this cannot account for the high density and range of velocities observed. The implication is hence that the ridge feature is a signature of the 3 kpc arm tangent. The prominent ridge in the maser distribution also has (less obvious) counterparts in the l, v distributions of CO and H i emission (as originally suggested by Oort et al. 1958), H ii regions (e.g., Georgelin & Georgelin 1976; Downes & Genzel 1980; Caswell & Haynes 1987), pre-ultra compact H ii region massive young stellar objects (e.g., Urquhart et al. 2007), and ammonia emission (Walsh et al. 2008; A. Walsh 2010, private communication).
3.2.2. Fitting an Overall Structure
Combining the density enhancement of masers near longitude −22° with the masers already assigned to the 3 kpc arms, we have a distribution of two parallel structures between ±15°, which join at longitudes between −15° and −25°, over a range of ∼100 km s−1. Although the ridge is a strong signature for a tangent at negative longitudes, the positive longitude tangent is less obvious. There are three regions of enhanced densities at positive longitudes (at approximately +12°, +20°, and +26°, Figure 3), but they are all confused by spiral arm loci: the region at +12° is coincident with loci of every spiral arm; the region at +20° is overlapped by the loci of the Perseus, Carina–Sagittarius, and Crux–Scutum arms; and the region at +26° is largely coincident with the Crux–Scutum arm (and will be discussed in the next section). The region at +20°, which may be influenced by the Galactic bar (Section 3.1), includes a couple of sources outside the spiral arm parameter space and potentially extends to a broad velocity range of 15 km s−1–80 km s−1.
The two original interpretations for the 3 kpc arm structure were that of an expanding ring (Rougoor 1964; van der Kruit 1971; Cohen & Davies 1976) or a non-expanding oval shaped resonance feature or elliptical streamlines (de Vaucouleurs 1970; Peters 1975). Simple examples of these two structures are shown in relation to the Galactic bars in Figure 5 and loci are shown in the l, v domain for an example of each from the literature in Figure 6. Development of both these interpretations was hindered at the time by the lack of a far-side counterpart and the inability to clearly trace structure at velocities less than the terminal. The CO detection of Dame & Thaddeus (2008) and the maser distribution allow us to re-examine these structures. The maser distribution of the MMB again suggests an oval structure in the l, v domain (Green et al. 2010). Although readily accounted for by a ring with an apparent expanding velocity, modeling and theoretical interpretation favor elliptical orbits/streamlines. Here, we investigate this by first fitting the 3 kpc arm maser distribution with an elliptical model with constant angular momentum and, second, a circular ring model incorporating a component of radial velocity outward from the Galactic center. We fit only to the 3 kpc arm maser population as the individual sources toward the tangent points are dependent on the spiral arm model and rotation curve (as discussed in the Appendix).

Figure 6. Elliptical streamlines corresponding to the 3 kpc arm (top) from Peters (1975) and the expanding ring (bottom) from Cohen & Davies (1976). The top is based on two streamlines, one with a semi-major axis of 4.9 kpc with an ellipticity of 0.69 and a fixed angular momentum of 770 km s−1 kpc−1, the other with a semi-major axis of 4.6 kpc with an ellipticity of 0.68 and a fixed angular momentum of 680 km s−1 kpc−1. The bottom is based on a radius of 4.0 kpc and a rotational velocity of 210 km s−1 with an expanding velocity of 53 km s−1.
Download figure:
Standard image High-resolution imageWe first consider the case of an ellipse, with a ratio of semi-minor to semi-major axes of 0.50–0.80 (Peters 1975; Sevenster et al. 1999), an orientation between 25° and 50°, and a constant angular momentum of between 300 and 700 km s−1 kpc−1. We assume that the tangential velocity at any given point on the ellipse is given by the angular momentum divided by the Galactocentric radius of that point. The best fit is found for a semi-major axis of 4.1 kpc, an axis ratio of 0.54 (a semi-minor axis of 2.2 kpc), an orientation of 38°, and a rotational velocity of 320 km s−1 (a mean circular velocity of 106 km s−1). This accounts for 96% of the 3 kpc arm sources and is shown (with a radial thickness of 0.5 kpc) overlaid on the maser distribution in Figure 7. The ellipse can approximate the parallel sections of the 3 kpc arms well, but does not associate the masers at positive longitudes (>15°) with high velocities.

Figure 7. Longitude–velocity plot with a 3 kpc ellipse and ring. Symbols are the same as Figure 1. The ellipse is 0.5 kpc thick in the radial direction and has a semi-major axis of 4.1 kpc, semi-minor axis of 2.2 kpc, orientation of 38°, and an angular momentum of 320 km s−1 kpc−1. The ring is 0.5 kpc thick in the radial direction and has an outward Galactocentric radial velocity between 40 km s−1 and 60 km s−1.
Download figure:
Standard image High-resolution imageThe effect on the level of association with varying parameters of the elliptical ring model is shown in the left panels of Figure 8. In this figure, each pixel within a panel represents an ellipse model for a given set of parameters (semi-major and semi-minor axes, orientation, and angular momentum) and the color scale represents the fraction of masers associated with the model. Extending the allowed range of angular momenta does not improve the fit, with the best fits confined within a limited range of ∼100 km s−1 kpc−1 about 300–400 km s−1 kpc−1, dependent on the orientation of the ellipse. Extending the length range of the axes gives much poorer fits below 3.5 kpc, but has comparable association at longer radii (although as noted radii larger than 4.5 kpc are increasingly unrealistic as they result in tangential velocities exceeding the H i terminal velocities). Varying the orientation of the ellipse below 20° produces poorer fits. The effect of changing the orientation and the angular momentum is somewhat linked in the l, v domain, with a smaller orientation but larger angular momentum producing similar results to a larger orientation but smaller angular momentum. Decreasing the ratio of semi-minor to semi-major axes below 0.5 (i.e., increasing the level of ellipticity) produces a much poorer fit and increasing the ratio of axes much beyond 0.8 (making the ring increasingly circular) introduces the need for the radial motion of the circular ring scenario. If the unassociated sources described at the start of Section 2 are included in the fitting, then the best fit to the combined source sample is for a semi-major axis of 4.2 kpc, an axis ratio of 0.53 (a semi-minor axis of 2.2 kpc), an orientation of 28°, and a rotational velocity of 370 km s−1 (a mean circular velocity of 121 km s−1). This accounts for 91% of the sources. The variation in the fraction of sources associated with the ring models when including the unassociated sources is shown in the right panels of Figure 8.

Figure 8. Fraction of maser sources consistent with the 3 kpc ring model for different parameters of the ellipse. Color scale represents 10%–100% source association. Left figures are for the association of 3 kpc arm sources only, right figures are for association with both the 3 kpc arm sources and the unassociated sources described in the text (with equal weighting to both). The top figures are for fixed semi-major and semi-minor axes, 4.1 kpc and 2.2 kpc, respectively. The middle figures are for fixed semi-minor axis of 2.2 kpc and fixed angular momentum of 320 km s−1 kpc−1. The bottom figures are for a fixed orientation of 38° and angular momentum of 320 km s−1 kpc−1.
Download figure:
Standard image High-resolution imageFor the second case of the circular ring, we take radius, radial velocity from the Galactic center, and rotational velocity as free parameters. We assume that the ring will start near the end of the bar, so allow the radius to range between 2.5 and 4.5 kpc. We vary the Galactocentric radial velocity between 40 and 60 km s−1 in accord with the range of velocities seen in the CO emission of the 3 kpc arms (Dame & Thaddeus 2008). In accordance with the proper motion of 9.621+0.196 (Sanna et al. 2009) and our expectation of a lower rotational velocity toward the inner Galaxy (e.g., Caswell et al. 2010), we adopt a circular velocity between 40 and 60 km s−1 lower than the Galactic rotation (246 km s−1). The highest level of source association is found for a radius of 3.4 kpc, a Galactocentric radial velocity of 48 km s−1, and a circular rotational velocity of 201 km s−1. This also accounts for 96% of the 3 kpc arm sources and is shown (with a radial thickness of 0.5 kpc) overlaid on the maser distribution in Figure 7.
The effect on the level of association with varying parameters of the circular ring model is shown in the left panels of Figure 9. As per Figure 8, each pixel within a panel represents a ring model for a given set of parameters (Galactocentric radius of the ring, outward Galactocentric radial velocity, and circular velocity) and the color scale represents the fraction of masers associated with the model. Extending the allowed range of radial velocities does not alter the best fit. Extending the range of radii gives a better fit for a larger radius (5.5 kpc), but this is too long physically (H i terminal velocities limit the possible length to ∼4.5 kpc). Varying the circular rotational velocity by a wider range gives marginally better fits (a few percent) for higher circular velocities at a given radius. Although not formally part of the fit, the ring model also accounts for the tangent sources (Section 3.2.1), the extreme negative sources between −15° and −24° longitude and the extreme positive sources between longitudes +15 and +24°. If the unassociated sources described at the start of Section 2 are included in the fitting, then the best fit to the combined source sample is for a radius of 3.8 kpc, a radial velocity from the Galactic center of 47 km s−1, and a circular velocity of 204 km s−1. However, this is a poorer fit to the 3 kpc arm sources between ±15°. The variation in the fraction of sources associated with the ring models when including the unassociated sources is shown in the right panels of Figure 9.

Figure 9. Fraction of maser sources consistent with the 3 kpc ring model for different parameters of the ring. Color scale represents 10%–100% source association. Left figures are for the association of 3 kpc arm sources only, right figures are for association with both the 3 kpc arm sources and the unassociated sources described in the text (with equal weighting to both). The top figures are for a fixed outward Galactocentric radial velocity of 48 km s−1, the middle figures are for a fixed circular velocity of 201 km s−1, and the bottom figures are for a fixed radius of 3.4 kpc. Black lines delineate likely boundaries for parameters from models and observations (see the text for details).
Download figure:
Standard image High-resolution image3.2.3. Previous Models of the Structure
Numerous alternative structure models have been previously explored. Through an N-body model and comparison with OH/IR stars, Sevenster et al. (1999) proposed an alternative elliptical ring. Although this correlated with the near 3 kpc arm known at the time, it is not a good match to the far 3 kpc arm or the −22° tangent. This model, which has a constant circular velocity rather than constant angular momentum, struggles to produce the parallel nature of the near and far 3 kpc arms, requiring much longer radii than are reasonable to fit the distribution. If, instead of a continuous structure, the 3 kpc arms are considered to be two separate "lateral" arms, can the maser population be accounted for? Several authors have explored two lateral arms, recent examples being Bissantz et al. (2003) and Rodriguez-Fernandez & Combes (2008) (the first a smoothed particle hydrodynamics model based on near infrared luminosities of the Diffuse Infrared Background Experiment (DIRBE) in comparison with the CO l, v distribution and the second a sticky particle model based on star counts from the Two Micron All Sky Survey), but neither of these models account for more than about 30% of the 3 kpc arm maser population (a third of the level of association of either the expanding ring or the ellipse). More complex asymmetric models which incorporate several arm-like features emanating from the bar fare no better: the models of Mulder & Liem (1986; a two-dimensional quasi-steady state model with near and far inner Lindblad radius arms and inner ultra-harmonic arms), Englmaier & Gerhard (1999; a quasi-equilibrium flow model based on COBE/DIRBE near infrared luminosities), and Fux (1999; a three-dimensional N-body model based on COBE/DIRBE near-infrared luminosities incorporating the 135 km s−1 arm and connecting arms), each associates no more than 30% of the 3 kpc arm masers.
The details of all the models discussed above are summarized in Table 2 and their loci are shown in Figures 10 and 11. The models presented are as published, incorporating the authors' chosen best parameters (e.g., pattern speeds, bar orientations, solar distances) and also including a 10 km s−1 error margin in the loci of the structures. A direct comparison between the types of models is complicated by the simple fact that the four-arm models cover more of the l, v domain, increasing their likelihood of associating sources. However, within the elliptical/lateral two-arm models, the model of Rodriguez-Fernandez & Combes (2008) provides the best fit to the sources. This model has a large corotation radius of 5–7 kpc, as a result of a slow bar (where that bar is made up of both a bulge and a longer component). The inclusion of a long bar component, clearly influential on high-mass star formation (Section 3.1.2), may be responsible for this higher association. Within the more complex multi-arm models, the resonance features of Mulder & Liem (1986) provide the highest level of association. The lack of significant 6.7 GHz methanol maser emission toward the 135 km s−1 and "connecting" arms in these models suggests that these may be primarily gas features, not undergoing high-mass star formation. This may be due to the broad range of velocities, which both features exhibit, indicating highly turbulent material. We similarly do not see 6.7 GHz methanol maser emission toward the broad range of velocities of material toward the Galactic center (the methanol velocity range is ∼200 km s−1 compared with the CO and H i spanning ∼500 km s−1) and no emission is seen toward Bania's "Clump 2" (Bania 1977), a feature with a high range of velocities, but it is seen toward the smaller velocity range of Bania's "Clump 1" (Green et al. 2010).

Figure 10. Comparison of the 6.7 GHz methanol masers with model inner Galaxy structures. Symbols are the same as Figure 1. The blue lines delineate the region identified in CO emission as the 3 kpc arms by Dame & Thaddeus (2008). Top: Sevenster et al. (1999) elliptical ring with a bar orientation of 44° and a corotation radius of 4.5 kpc. Middle: Bissantz et al. (2003) combination of elliptically orbiting gas with a bar orientation of 20° and a corotation radius of 3.4 kpc. Bottom: Rodriguez-Fernandez & Combes (2008) lateral arms with a combination bar of orientations of 20° and 75° and a corotation radius of 5–7 kpc.
Download figure:
Standard image High-resolution image
Figure 11. Comparison of the 6.7 GHz methanol masers with model inner Galaxy structures continued. Symbols are the same as Figure 1. The blue lines delineate the region identified in CO emission as the 3 kpc arms by Dame & Thaddeus (2008). Top: Mulder & Liem (1986) four inner arm-like features: near and far inner Lindblad radius arms and inner ultra-harmonic arms. This model has a 20° bar orientation and corotation radius of 4 kpc. Middle: Englmaier & Gerhard (1999) four inner arm-like features from the bar ends with a bar orientation of 20° and a corotation radius of 3.4 kpc. Bottom: Fux (1999) four inner arm-like features: the 3 kpc arm, the 135 km s−1 arm, and the near and far connecting arms. This model has a bar orientation of 25° and a corotation radius of 4–4.5 kpc.
Download figure:
Standard image High-resolution image
Table 2. Summary of Comparison of Maser Distribution with Models of the Inner Galaxy
| Model | References | Galactic Bar | Radius | Level of | |
|---|---|---|---|---|---|
| Description | Orientation | Semi-major Axis | of CR | Association | |
| (°) | (kpc) | (kpc) | (%) | ||
| Two lateral arms | R08 | 20 and 75 | 1.0 and 0.2 | 5.0–7.0 | 33 |
| Four inner arms | M86 | 20 | 4.0 | 8.4 | 31 |
| Elliptical ring | S99 | 44 | 2.5 | 4.5 | 25 |
| Four inner arms | E99 | 20 | 3.0 | 3.4 | 20 |
| Two lateral arms | B03 | 20 | 1.8 | 3.4 | 16 |
| Four inner arms | F99 | 25 | 3.5 | 4.0–4.5 | 9 |
Notes. Details are given for the six models together with percentage association with the 3 kpc arm maser distribution. CR is the corotation resonance. References: M86: Mulder & Liem 1986; E99: Englmaier & Gerhard 1999; F99: Fux 1999; S99: Sevenster et al. 1999; B03: Bissantz et al. 2003; R08: Rodriguez-Fernandez & Combes 2008.
Download table as: ASCIITypeset image
3.2.4. Summary of the 3 kpc Arm Structure
In addition to the near and far 3 kpc arm population, we find that the maser l, v distribution demonstrates a prominent feature near −22° longitude which we interpret as the approximate tangent of the 3 kpc arms. Given the association of 6.7 GHz methanol masers with the parallel sections of the 3 kpc arms and the tangent, we can expect the entire structure to exhibit methanol maser emission and form an approximately oval structure in the l, v domain. When this structure is combined with the spiral arms and other features, essentially all the maser emission is accounted for. This oval structure can either relate physically to an elliptical ring or a circular ring with radial motion ("expansion"). The average surface density of sources in the Galactic plane, assuming an annulus of 0.5 kpc centered on 3.5 kpc, is 6 and 7 sources kpc−2 for the near and far portions of the arms (±15° longitude), respectively. This is comparable to the expected "smeared" density of sources in the spiral arms (Caswell et al. 2010). The average density along the tangent (excluding sources associated with other structural features, i.e., limiting the velocity range to −60 km s−1 to −85 km s−1) is 22 sources kpc−2. This higher density can be accounted for by the presence of a spiral arm origin, which we examine in Section 3.3.
The existing models of the dynamics on the inner Galaxy account for ⩽34% of the 3 kpc arm sources. In comparison, a simple elliptical ring or an "expanding" circular ring account for of the order of 95%. Although there are several models for an "expanding" circular ring close to the center of our Galaxy (within a Galactocentric radius of <1 kpc; e.g., Scoville 1972; Kaifu et al. 1972, 1974; Bally et al. 1987), and numerous examples of barred external galaxies with rings (e.g., Buta 1986, 1996; Treuthardt et al. 2009), dynamical models of the Milky Way since the early examples in the 1970s do not favor such a feature. Some radial motion may be a result of the influence of the radius of corotation resonance: a product of the transition between the elliptical orbits which follow the bar inside the radius of corotation resonance and the circular orbits which exist outside, with the 3 kpc ring the interface region between the two, pulling elliptically orbiting material into a circular orbit (an early example is that of Shane 1972). The more favored picture (in terms of dynamical modeling) of the elliptical ring or stream lines can account for the parallel sections and to some degree the negative tangent, but cannot readily account for the positive longitude masers with large velocities. The 6.7 GHz masers, as tracers of the structure, have the potential to fully define the spatial and kinematic structure of the 3 kpc ring, since further astrometric measurements will allow parallax distances (thus a direct measure of the ellipticity of the ring) and the full three-dimensional velocity behavior.
The spiral arms are believed to originate at approximately the radius of corotation resonance of the Galactic bar (e.g., López-Corredoira et al. 1999; Englmaier & Gerhard 1999), where the Galactic material is rotating at the same speed as the pattern speed of the bar, and radial oscillation is zero (Lindblad 1974). Highly elliptical orbits exist within the radius of corotation resonance, in contrast to circular orbits outside (Englmaier & Gerhard 2006). This requires that the 3 kpc arms should be either a more elliptical structure interior to the radius of corotation resonance, with orbits following the bar (e.g., Contopoulos & Papayannopoulos 1980; Englmaier 2000) or a more circular structure close to the radius of corotation resonance, similar to resonance rings seen in external galaxies, such as NGC2523 and NGC4245 (e.g., Buta 1999; Treuthardt et al. 2009). As discussed in Sections 3.2.1 and 3.2.2, the maser distribution leads us to believe the long thin bar is the most influential on star formation, with a bar semi-major axis of ∼3.4 kpc and orientation of ∼45°, and the 3 kpc arms appear to be well approximated by an elliptical ring (or circular with radial velocity components resulting from the resonance). This indicates a radius of corotation resonance of ∼4.0 kpc and a possible location for the origins of the spiral arms.
3.3. The Spiral Arm Origins
Although the tangents of all the spiral arms have been recognized in CO, H i, and other tracers such as CS (e.g., Bronfman 1992) and IR star counts (e.g., Benjamin et al. 2005), identification of the arm origins, which fall within the terminal velocity envelope rather than at its boundary where the tangent points lie, has been elusive. This has meant models generally incorporate arbitrary or inferred arm origins within the l, v domain: the two "major" arms (Perseus and Crux–Scutum) originate at opposite ends of the Galactic bar and the two "minor" arms (Norma and Carina–Sagittarius) are anywhere between a few degrees and 90° offset, either starting from the radius of corotation resonance directly or branching from the two main arms. However, studies of other Galaxies and dynamical models show that the major arms do not necessarily start directly at the bar end, but can be seen offset by several degrees of Galactic azimuth (e.g., Sandage & Bedke 1994; Russeil 2003).
3.3.1. Spiral Arm-induced Density Enhancements
As a product of interstellar material undergoing the influence of density waves, spiral arms are regions of dense material and star formation. External galaxies show the spiral arms start close to the end of the bar or a ring surrounding a bar and, as already mentioned, dynamical models place the arms starting at the radius of corotation resonance (∼4 kpc). These regions are likely to experience significant compression of material such that star formation, induced by density changes in the ISM, is likely to be enhanced. The remaining high density regions of masers within ±28° may thus be explained by the origins of the spiral arms. The exception is between longitudes +6° and −6° where all the spiral arms pass and there are sources on the solar circle (zero line-of-sight velocities) together with sources associated with the Galactic center zone. In this region, an overabundance is to be expected even in the absence of spiral arm origins.
High positive velocities at longitudes 25°–35° have been considered the approximate start of the Crux–Scutum arm, with a region of massive star formation inferred from a sequence of IR observations (Hammersley et al. 1994, 2000; Garzon et al. 1997; López-Corredoira et al. 1999; Cabrera-Lavers et al. 2008) and a massive young cluster of red supergiants (Davies et al. 2007; Clark et al. 2009; Negueruela et al. 2010). We see a high density of methanol masers in this region (one bin in excess of 5σpoisson as shown in Figure 3). The Crux–Scutum arm is the only arm with velocities above 60 km s−1 at these longitudes, it is known to have a tangent at ∼35°, and originates at longitudes smaller than this. The lower estimate of the radius of corotation resonance is 3.5 kpc, which is tangential at 24°. Hence, the arm theoretically originates between 24° and 35° and we interpret the dense cluster of masers at ∼26° as observational evidence of the start of this arm. Assuming the longitudes 24° and 35° mark the boundary of this region and that it is a portion of an annulus with a thickness of 1 kpc centered at the corotation resonance radius of 4 kpc, the origin has a density of 11 sources kpc−2. The discovery of the massive young red supergiant cluster in this region (Figer et al. 2006) implied substantial starburst activity 10–20 Myr ago (Davies et al. 2007), but the significant presence of 6.7 GHz methanol masers indicates that there is still substantial ongoing star formation.
As mentioned in Section 3.2.1, the methanol maser distribution demonstrates a dense ridge of sources near l= −22° which is coincident with the negative longitude tangent of a ∼3.5 kpc ring. The density of masers within this region is 22 sources kpc−2 (Section 3.2.2) compared to the average of both the 3 kpc ring and spiral arms which is 6 or 7 sources kpc−2. This leaves 15 or 16 sources kpc−2 which could be accounted for with the origin of a spiral arm. The Perseus arm is the only spiral arm in conventional models extendable to this region and is likely to correspond to the most negative velocities of the ridge.
We now turn to the minor arms, Carina–Sagittarius and Norma. From fitting a logarithmic spiral to objects associated with the Carina–Sagittarius arm, and extrapolating toward the Galactic center, the origin of this arm is often located within the fourth Galactic quadrant within about 10° of the Galactic center (e.g., Russeil 2003). We observe a high density clump near longitude of −8° (one bin above 5σpoisson in Figure 3). This is either a very dense and active region of high-mass star formation within the Norma arm (at non-tangential longitudes and more negative velocities than expected) or it is more likely the indication of the start of the Carina–Sagittarius arm and the overlapping of the l, v parameters of this arm with those of the Norma arm (with the further implication that the Norma arm branches from the Perseus arm). The starting point of the Norma arm is less clear. It is often speculated to originate in the first Galactic quadrant, approximately opposite to the other minor spiral arm Carina–Sagittarius (e.g., Ortiz & Lepine 1993). We see a dense cluster of sources from longitudes +10° to +12° extending to positive velocities beyond the Carina–Sagittarius and Crux–Scutum arms, which could be interpreted as the start of the Norma arm. If the Norma and Carina–Sagittarius arms branch from the major arms outside the radius of corotation resonance, rather than starting near the ring at the radius of corotation resonance, the conditions of the ISM may be less compressed and the level of star formation will not be as high as the origins of the major arms (the branching scenario is a more logical scenario geometrically if the ring is elliptical).
The associations of the density enhancements are summarized in Table 1 together with an approximation of the density of sources kpc−2. We identify the high density regions of masers not associated with the bar or the 3 kpc arms as enhanced star formation at the starting points of the spiral arms: Crux–Scutum at approximately +26° (velocities ca. 100 km s−1), Norma at approximately +12° (velocities ca. 50 km s−1), Carina–Sagittarius at approximately −8° (velocities ca. −55 km s−1), and Perseus at approximately −22° (velocities ca. −55 km s−1). We find the Crux–Scutum and Carina–Sagittarius arm origins to have densities of 10–15 sources kpc−2, similar to the densities seen at the ends of the Galactic bar. The densities of the Norma and Perseus arms are confused by additional arms lying on the line of sight and the 3 kpc arm tangent. The masers contained within the spiral arm origins have a median latitude of 00 ± 01, are typically contained within a range of about 30 km s−1, and have median fluxes in the range 6–10 Jy.
4. CONCLUSION
We have examined the distribution and density of 6.7 GHz methanol masers in the longitude–velocity domain. Both the longitude–velocity distribution and its structure function demonstrate the presence of structures on small (<003) and large (>3°) scales. Through smoothing the density distribution on the small scales and binning on the large scales, we identify statistically significant dense regions of masers indicative of enhanced high-mass star formation within Galactic scale structures. The maser distribution supports the presence of a long thin bar inclined at angle of ∼45° to the Sun–Galactic center line of sight. The lack of methanol emission from a short, bulge-associated bar implies the two Galactic bars represent different ages: the short boxy/bulge bar an older structure and the long thin bar a younger structure, undergoing current high-mass star formation. We identify a prominent tangent of the 3 kpc arms near −22° and find the maser distribution of the 3 kpc arms is readily associated with a continuous ring structure in the longitude–velocity domain. High densities of masers identify the approximate starting points of the spiral arms: the major arms, Crux–Scutum at +26° and Perseus at −22°, slightly offset from the bar ends; the minor arms, Norma at 12° and Carina-Sagittarius at −8°, possibly branching from the major arms. The 3 kpc arm ring and spiral arm origins, combined with the spiral arms themselves, account for essentially all the 6.7 GHz methanol masers and their density enhancements within longitudes ±28°. 6.7 GHz methanol masers clearly delineate many of the important structures of our Galaxy and provide a new observational basis to constrain dynamical models. Multi-wavelength studies and astrometric distances through very long baseline interferometry (VLBI) will further enhance the importance of this species of maser as a tool in understanding the structure of our Galaxy.
The authors thank the anonymous referee for insightful comments. The Parkes Observatory is part of the Australia Telescope, which is funded by the Commonwealth of Australia for operation as a National Facility managed by CSIRO.
Facility: Parkes (Methanol Multibeam) - Parkes Radio Telescope
APPENDIX: MINOR IMPLICATIONS OF UNCERTAINTIES IN SPIRAL ARM SHAPE AND ROTATION PARAMETERS
As noted in Section 2, we adopt the Taylor & Cordes (1993) spiral arms and the Brand & Blitz (1993) rotation curve, together with a Galactocentric solar distance (R☉) of 8.4 kpc and a circular rotation of the Sun (Θ☉) of 246 km s−1. We now discuss the potential implications of uncertainties in our assumptions regarding the shape of the spiral arms and the rotational parameters of the Galaxy.
A.1. Choice of Spiral Arm Shape
Our knowledge of the Galactic location and spatial properties of the spiral arms has been limited by the accuracy of the distances of objects tracing the spiral arms, such as Hii regions and GMCs. The often cited model of Georgelin & Georgelin (1976) is based on interpretation of star-forming regions with assigned distances, many of which are kinematic distances, known to suffer significant error margins (see for example Gómez 2006; Reid et al. 2009b). Models are often made to fit the observed tangential velocities of atomic (H i) and molecular (CO) emission, interpolating the structure between these extremes to approximate what is seen observationally (e.g., Baba et al. 2010). As such, widely used models of the spiral arms, such as Taylor & Cordes (1993), have changed minimally in the past 44 years since Georgelin & Georgelin (1976), so suffer the same uncertainties and some caution should therefore be taken with the location of the spiral arm loci. Statistical arguments summarizing the models suggest that there is a favored picture of a logarithmic four-arm spiral with a pitch angle of ∼12° (Vallée 1995, 2002, 2005, 2008). The recent studies of Russeil (2003) and Hou et al. (2009), with logarithmic and polynomial fits respectively, favor a four-arm model and specifically one which has two "major" and two "minor" arms. Levine et al. (2006) found concurring evidence for a four-arm structure in the H i emission in the outer Galaxy. Additionally, although the Galaxy appears to have an overall grand structure, spurs, such as the local "Orion arm," exist.
It is the combination of observations at multiple wavelengths and the "piggybacking" of distances through associations of these (e.g., Urquhart et al. 2011), that is helping to improve our current understanding and models. Ultimately however, the thousands of stellar distances of the upcoming NASA Gaia mission together with astrometric parallaxes of masers through VLBI (identifying the optically obscured star-forming regions) will have the potential to truly delineate the spiral arms. Unfortunately, both of these are several years away, making the loci of models our current best estimate: until then the likely overall structure, number of arms, and continuity of the arm loci will remain helpful in recognizing potential spiral arm association of maser sources.
A.2. Choice of Rotation Curve
As the Taylor & Cordes (1993) arms are largely based on those of Georgelin & Georgelin (1976) and these were based on kinematic distances using a rotation curve, it is pertinent to adopt a similar rotation curve to convert the arm shapes to the l, v domain. Georgelin & Georgelin (1976) used a rotation curve with a Θ☉ of ∼250 km s−1 and an R☉ of 10 kpc. When scaled to 8.5 kpc this equates to a Θ☉ of ∼220 km s−1, for which the Brand & Blitz (1993) rotation curve is a good approximation. However, we also tested the association of masers with the rotation curves of Clemens (1985), Fich et al. (1989), McClure-Griffiths & Dickey (2007), and Reid et al. (2009b). With 1 kpc thick spiral arms and a 7 km s−1 velocity tolerance in association we find: Clemens (1985) accounts for 77% of the sources with the spiral arms: Fich et al. (1989) linear curve 78%, Fich et al. (1989) power-law curve 79%, McClure-Griffiths & Dickey (2007) 80%, and the flat rotation of Reid et al. (2009b) accounts for 76% of the sources. Although individual examples of associated sources change between the rotation curves, the total remains in the range 76%–80%, mirroring the conclusions of the previous section and emphasizing that the inferred total number of spiral arm sources is largely unaffected by rotation curve choice.
A.2.1. Solar Parameters
In addition to the choice of rotation curve, Galactic kinematics are dependent on the parameters of solar motion and the local standard of rest. For the solar distance, R☉, the consensus appears to be 8.4 kpc, based on orbits of S0-2 stars implying 8.4 ± 0.4 kpc (Ghez et al. 2008) and 8.33 ± 0.35 kpc (Gillessen et al. 2009). This is consistent with the parallax observations of water masers in Sgr B2 indicating 7.8 ± 0.8 kpc (Reid et al. 2009a) and the parallaxes of methanol masers indicating 8.4 ± 0.6 kpc (Reid et al. 2009b).
The IAU standards of solar motion are implicitly incorporated in our maser LSR velocities. However, recent maser astrometric observations have prompted revision. Two of the parameters, solar motion toward the Galactic center, U☉, and solar motion toward the north Galactic pole, W☉, have remained largely unchanged (10.3 km s−1 and 7.7 km s−1, respectively), but the solar motion in the direction of Galactic rotation, V☉, has not. Originally V☉ was chosen to be 15.3 km s−1 (the IAU standard), then it was revised to 5.25 ± 0.62 km s−1 based on stellar kinematics of the Hipparcos catalog (Dehnen & Binney 1998). However, the data set was re-examined, resulting in further revision to 12.24 ± 0.47 km s−1 (Schönrich et al. 2010). This higher value of V☉, returning to a value close to the original IAU standard, is in line with the suggestions of Reid et al. (2009b) and McMillan & Binney (2010) based on maser proper motions. The revision to a higher value may account for the apparent motion of star-forming regions counter to Galactic rotation (Bobylev & Bajkova 2010).
Galactic circular rotation of the Sun, Θ☉ has also been subject to recent revision. The IAU standard of Θ☉, 220 km s−1, has been revised to a higher value based on the results of proper motions deduced from maser astrometry observations. The revised values are 254 ± 16 km s−1 as estimated by Reid et al. (2009b) or either 246 ± 30 km s−1 or 244 ± 13 km s−1 as estimated by Bovy et al. (2009).
Therefore, the current best estimates of the parameters are as follows: U☉ = 11.1 km s−1, W☉ = 7.25 km s−1, V☉ = 12.2 km s−1, Θ☉ = 246 km s−1, and R☉ = 8.4 kpc. The most significant difference is the increase in Θ☉. We adopt the R☉ of 8.4 kpc throughout, but explored the impact of the other variations on our conclusions, and the effect is minimal. The adjustment of Θ☉ has a reasonable impact on kinematic distance estimates, but as we are working in the l, v domain, it does not influence our maser parameters. It does affect the location of the spiral arm loci if we transfer them with this value rather than the IAU standard, but this only serves to shift the loci in velocity by ∼5–10 km s−1.