


ABSTRACT
We report electron impact ionization cross section measurements for electron impact single ionization of Fe12 + forming Fe13 + and electron impact double ionization of Fe12 + forming Fe14 +. These are the first electron impact ionization data for any Si-like ion uncontaminated by an unknown metastable fraction. Recent distorted wave calculations agree with our single ionization results to within ∼15%. Double ionization is dominated by inner shell ionization of a 2l electron resulting in autoionization of a second electron as the inner shell hole is filled.
Export citation and abstract BibTeX RIS
1. INTRODUCTION
Accurate data for electron impact ionization (EII) cross sections are needed in order to interpret the spectra of collisionally ionized plasmas. Such plasmas are formed in a wide range of astrophysical objects including stellar coronae, galaxies, supernova remnants, and the intracluster medium in clusters of galaxies. Under conditions of collisional ionization equilibrium (CIE), the balance of electron–ion recombination and electron impact single ionization (EISI) determines the charge state distribution (CSD). In equilibrium, the ionization and recombination rates are the same. Thus, nenqαqI = nenq + 1αq + 1R, where ne is the electron density, nq is the density of ions with charge q for a given element, αqI is the rate coefficient for ionization from q to q + 1, and αq + 1R is the rate coefficient for recombination from q + 1 to q. This can be rewritten to show nq + 1/nq = αqI/αq + 1R, which demonstrates the direct relation between the rate coefficients and fractional abundances in CIE. In dynamic systems where the electron temperature changes rapidly, multiple-electron ionization, such as electron impact double ionization (EIDI), also needs to be considered to model the CSD (Müller 1986). Spectroscopic diagnostics for electron temperature, electron density, and elemental abundances rely on accurate calculations of the CSD (Brickhouse 1996; Landi & Landini 1999; Bryans et al. 2009), and therefore their accuracy depends on the underlying EII data.
EII cross sections are needed for every astrophysically relevant ion, which are typically defined as all non-bare charge states for the elements H to Zn (Dere 2007). As it is impractical to measure every ion, we have begun a series of experiments to provide benchmark measurements for at least one ion in as many isoelectronic sequences as possible. These results can then be used to improve theoretical calculations, which can then fill in the missing EII data for the measured isoelectronic sequences.
We are performing these measurements using an ion storage ring. This has the advantage over crossed electron–ion beam methods of allowing the ions to be stored long enough for essentially all metastable levels in the ion beam to radiatively relax to the ground state before data are collected. Thus, the results provide unambiguous data for ground state ions. Here we report cross section results for Si-like Fe12 +.
EISI measurements of Si-like Fe12 + forming Al-like Fe13 + were carried out for an electron–ion collision energy range of 300–2300 eV. In this energy range direct ionization is possible through the channels
The ionization threshold for a 3p electron is 361.04 eV and for a 3s electron is 388.95 eV (Ralchenko et al. 2010). Excitation–autoionization (EA) is possible for energies above the ionization threshold of 361.04 eV via collisional excitation of a 3s electron to an autoionizing state. EA due to excitation of an n = 2 electron is theoretically predicted to be important at energies above about 700 eV (Arnaud & Raymond 1992; Dere 2007). Resonant ionization can also occur in this energy range. The resonances are due to dielectronic capture forming an excited state that decays by ejecting two electrons (Müller 2008).
Direct ionization of 2p or 2s electrons is possible at higher energies. The theoretical energy thresholds are approximately 1110 eV and 1234 eV, respectively (Kaastra & Mewe 1993). However, the Los Alamos National Laboratory (LANL) Atomic Physics Code (Magee et al. 1995) gives the energy thresholds as 1086 eV and 1221 eV, which implies an uncertainty of around 20 eV for the energy thresholds. Neither 2p nor 2s ionization is expected to contribute much to the single ionization cross section. Ionization from the 2p subshell is predicted to radiatively stabilize with a probability of only ≈5% and from the 2s subshell with a probability of ≈7% (Kaastra & Mewe 1993). The rest of the time the intermediate state is predicted to autoionize, resulting in a net double ionization forming Fe14 +.
We also measured EIDI of Fe12 + forming Mg-like Fe14 +. The threshold energy for direct double ionization is 753.2 eV (Ralchenko et al. 2010). Direct ionization of an inner-shell electron can also lead to double ionization via autoionization as the resulting hole is filled in.
2. EXPERIMENTAL SETUP
The work here was carried out using the TSR heavy-ion storage ring of the Max-Planck-Institut für Kernphysik in Heidelberg, Germany. The experimental procedure has been described in detail in Hahn et al. (2010, 2011) and the present experiment follows particularly closely the method developed in Hahn et al. (2011). Here we give only a brief description, focusing on details relevant to the present work.
A beam of 148 MeV 56Fe12 + ions was injected into TSR and merged with two separate electron beams, known as the "Cooler" (Steck et al. 1990; Pastuszka 1996) and the "Target" (Sprenger et al. 2004). Each electron beam was collinear with the ion beam and could be operated at tunable electron energies. Initially, both beams were set to the space-charge-corrected cooling energy of 1438 eV. At this energy, the average relative velocity between the electrons and ions was zero and electron–ion collisions reduced the energy spread of the ion beam. The energy resolution of the experiment is limited by the Cooler electron beam energy distribution, which is described by a flattened Maxwellian with temperatures in the perpendicular and parallel directions typically of kBT⊥ = 13.5 meV and kBT∥ = 180 μeV (Kilgus et al. 1992; Schippers et al. 2001). For E ≫ T⊥ the experimental energy spread is  . Thus, in our experiment at the single ionization threshold of 361 eV, ΔE = 0.85 eV, and at the maximum measured collision energy of 2300 eV, ΔE = 2.1 eV.
After injection, the initial cooling cycle lasted 8 s. During this time any metastable levels in the ion beam could radiatively relax to the ground state. We used the radiative decay rates of Ralchenko et al. (2010) to estimate the metastable fraction during measurement by modeling the level populations as a function of storage time starting from an initial Boltzmann distribution. This estimate showed that the metastable fraction was zero to within the numerical precision of the calculation of about 10−11. The metastable fraction was also estimated using the lifetimes given by Fischer et al. (2006). They reported the longest metastable lifetime for Fe12 + to be 106.8 ms for the 3s23p2 3P2 level. The corresponding metastable fraction, after the 8 s delay, is then 10−33. For a typical beam current of 5 μA there are only ∼107 stored ions. Therefore, we expect no metastable ions in the beam during measurement.
During measurement, the Cooler electron beam energy was varied to provide tunable relative electron–ion collision energies, while the Target electron energy was fixed at cooling. Products of ionization and recombination formed in the cooler were magnetically separated from the Fe12 + parent beam and counted using detectors positioned to intercept the product beams (Rinn et al. 1982; Linkemann et al. 1995).
Measurements were performed by scanning the Cooler electron beam energy in about 400 pairs of steps, with one step at the measurement energy and the other at a fixed reference energy. Each step lasted for 20–30 ms. During this phase of the experiment the lifetime of the stored ion beam was about 13 s and the average stored ion current was 1–5 μA. Scans were repeated for about one hour to build statistical accuracy. Energy ranges for each scan were chosen to maintain at least 50% overlap with other scans in order to identify and correct for run-to-run fluctuations.
The background count rate was measured at a fixed reference energy after each measurement step. For single ionization measurements with scan energies up to 900 eV, the reference energy was set to 270 eV. This was well below the single ionization threshold for either ground state or metastable ions. Thus, only single electron stripping of the residual gas contributed to the reference count rate. For double ionization measurements, the reference was set below the EIDI threshold for scan energies up to 1420 eV so that only double electron stripping contributed to the reference count rate. For higher energies in either EISI or EIDI, the reference energy was set above threshold and lower energy scans were used to set the cross section at reference.
3. DATA ANALYSIS
The data analysis is discussed in detail in Hahn et al. (2010, 2011) and is essentially the same here, so we provide only a brief discussion. Ionization count rates RmI(Em) and RrI(Er) are recorded at the measurement energy Em and the reference energy Er, respectively. The background ionization count rate due to stripping RbI is proportional to the reference rate and calculated by applying some small corrections to account for pressure fluctuations and the slight decay of the ion beam current between the measurement and reference steps (Hahn et al. 2010). In the present work, the magnitude of this correction was at most 3%. The correction could not be applied to EISI data above 900 eV or EIDI data above 1420 eV, and the cross section at those energies therefore has an estimated additional systematic uncertainty of about 3%.
The rate coefficient averaged over the relative energy spread of the experiment <σIvrel > is obtained by normalizing the background-subtracted count rate by the electron density at measurement nme and the number of stored ions in the interaction region NmiL. Here, Nmi is the number of stored ions per unit length and L is the length of the interaction region. For cases where the reference energy is above the ionization threshold, the reference count rate is not due solely to stripping and the EII portion of the total rate coefficient at reference <σIvrel > (Er) must be added back in, with a correction factor nre/nem to account for the different densities at the measurement versus reference energy. Finally, because the velocity spread of the experiment is very small compared to the relative collision energy, the cross section can be found by dividing <σIvrel > by vrel. Thus, the cross section is given by
Here the factors (1 − βiβe) are relativistic corrections where βi and βe are the ion and electron velocities normalized by the speed of light, vi/c and ve/c, respectively. It is also necessary to correct for the interaction of the electron and ion beams in the merging and demerging sections on either side of the straight section in which the electron probe and ion beams co-propagate (Lampert et al. 1996).
4. UNCERTAINTIES
The EISI data were binned using 1 eV bin widths for collision energies below 1400 eV, where the cross section has a lot of structure, and 15 eV bin widths for higher energies, where the cross section varies smoothly and fewer energy scans were performed. The 1σ statistical uncertainty of the cross section is about 10% at 400 eV, but drops rapidly to 1% at 700 eV as the cross section increases. The statistical uncertainty of the data above 1400 eV is better than 4%. For the EIDI data, only low-resolution runs were performed and these were combined using a 15 eV bin width resulting in a statistical uncertainty of about 6% between 1100 eV and 2300 eV with larger uncertainties at lower collision energies where the cross section is small. All uncertainties here and throughout the paper are given at the 1σ level.
The ion current measurement is the largest source of systematic uncertainty. We used a beam profile monitor (BPM; Hochadel et al. 1994) to measure the stored ion current non-destructively. The calibration of this instrument depends on the residual gas pressure and any electronic drifts and tends to vary on a timescale of one to several hours. To deal with the calibration drift we used the approach of Hahn et al. (2011) and immediately before performing a long-range energy scan covering 265–900 eV we calibrated the BPM, as is described below. This scan then provided an accurate measurement for the energy dependence of the cross section. The BPM calibration for the other runs could be inferred by adjusting the calibration parameters to produce agreement with this long-energy range scan. We confirmed the accuracy of this approach by performing several more BPM calibrations over several days, which were found to be in excellent agreement with calibrations inferred by normalizing to the long-energy range scan.
The systematic uncertainty in the magnitude of the cross section from the ion current normalization is given by the uncertainty in the initial BPM calibration. This calibration was performed by comparing the BPM to the signal from a DC transformer (Unser 1981), which has a very stable proportionality between the output signal and the stored ion current. However, the DC transformer is insensitive to currents of only a few microamperes so it could not be used directly in the data analysis. For the calibration of the BPM, large ion currents of up to 44 μA could be stored and measured. These large ion currents allowed the BPM to be compared to the DC transformer over a large dynamic range, producing a highly accurate ion current calibration with an estimated 1σ uncertainty of about 4%. Such large currents were not present during the measurement due to the 8 s long initial cooling time after which the ion current had decayed to only a few microamperes.
There were several additional sources of systematic uncertainty. There is a 3% uncertainty due to the detector efficiency (Rinn et al. 1982). The uncertainty on the electron density has been estimated to be about 3% (Lestinsky et al. 2009). The resulting total systematic uncertainty is 6%. Table 1 summarizes the uncertainties.
Table 1. Sources of Uncertainty
| Source | Estimated 1σ Uncertainty(%) |
|---|---|
| Counting statistics | 1–10 |
| Ion current measurement | 4 |
| Electron density | 3 |
| Detection efficiency | 3 |
| Pressure fluctuationsa | 0–3 |
| Quadrature sum | 6–12 |
Note. aThe 3% uncertainty applies to data for E > 900 eV for single ionization and E > 1400 eV for double ionization where the correction for pressure fluctuations could not be applied.
Download table as: ASCIITypeset image
5. RESULTS FOR SINGLE IONIZATION
Figure 1 shows our single ionization cross section for Fe12 + forming Fe13 +. The 1σ statistical uncertainties are illustrated by error bars on selected points. The 1σ systematic uncertainty is indicated by the dotted curves. The figure also illustrates the cross section used in the CIE calculations of Arnaud & Raymond (1992), based on the theoretical cross sections of Younger (1983) and Pindzola et al. (1987), which is about 20% larger than our result. Additionally shown in Figure 1 is the Flexible Atomic Code (FAC) distorted wave calculation of Dere (2007) used in the CIE calculations of Bryans et al. (2009). The cross section from Dere (2007) is, on average, about 15% smaller than the experimental cross section below the EA threshold of ∼680 eV and about 15% larger than the experimental result above 1000 eV.
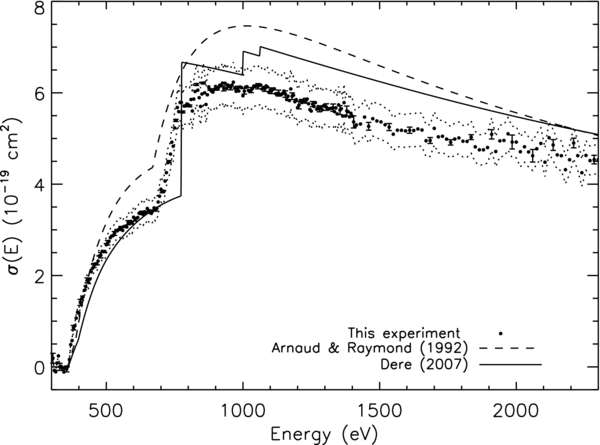
Figure 1. Single ionization cross section for Fe12 + forming Fe13 +. The filled circles indicate the experimental values, error bars at selected points illustrate the 1σ statistical uncertainty, and dotted curves show the 1σ systematic uncertainty. Also shown are the cross section used in the CIE calculations of Arnaud & Raymond (1992; dashed line) and the distorted wave calculation of Dere (2007; solid curve).
Download figure:
Standard image High-resolution imageFor energies below about 680 eV, the cross section is mainly due to direct ionization but rises faster above the threshold than is predicted by theory. Similar behavior was observed for Fe11 + (Hahn et al. 2011). The faster than expected increase could be due to excitation of a 3s electron to an autoionizing state, or excitation of either a 3s or 3p electron followed by field ionization by the motional electric fields experienced by the ions as they pass through the magnetic fields in TSR. These processes cannot be distinguished experimentally. Hahn et al. (2011) argued that since the excitation cross section falls off rapidly as n−3, EA seems more likely to be the more important contribution. However, the relative contribution of EA versus field ionization also depends on the branching ratios for autoionization versus radiative stabilization, and detailed calculations are needed to resolve this issue.
EA of an n = 2 electron begins at about 680 eV. Based on the threshold behavior of the cross section at that energy, we infer that at high energies EA makes up about 40% of the total cross section. The FAC calculation of Dere (2007) predicts significant additional EA contributions near 1000 eV, which we do not observe. Similar behavior was found for Fe11 + by Hahn et al. (2011), which suggests that this is a general issue with these calculations. One possible explanation for this is that the calculation overestimates the branching ratio for autoionization versus radiative stabilization for the relevant states. It is also possible that the intermediate states decay through double autoionization rather than single autoionization.
We calculated the plasma ionization rate coefficient αI(Te) by multiplying the EISI cross section with the relative electron–ion velocity and integrating over a Maxwellian. Following Fogle et al. (2008), the integral was performed up to an energy of E0 + 6kBTe, where E0 = 361.04 eV is the ionization threshold for Fe12 +, Te is the electron temperature, and kB is the Boltzmann constant. Since the cross section was measured to E = 2300 eV, the rate coefficient could be calculated from the data for Te < 3.7 × 10⁶ K. For higher temperatures, we assumed that the cross section given by Dere (2007) has the correct high energy behavior, and scaled theory to match the experiment at 2300 eV in order to extrapolate the experimental cross section to higher energies. The uncertainty in αI(Te) is about ±6% due to the systematic uncertainty. Random statistical uncertainties are smoothed over by the integration.
The plasma rate coefficient from the present measurement is compared in Figure 2 to those given by Arnaud & Raymond (1992) and Dere (2007). The CIE calculations of Bryans et al. (2009) show that Fe12 + is over 1% abundant in the temperature range from 1.1 × 10⁶ K to 2.9 × 10⁶ K, with a peak at 1.8 × 10⁶ K. At these temperatures the rate coefficient from Arnaud & Raymond (1992) is 10%–20% larger than the experimental results. The rate coefficient from the FAC calculation is in better agreement, being about 8% smaller than our results at the peak formation temperature.
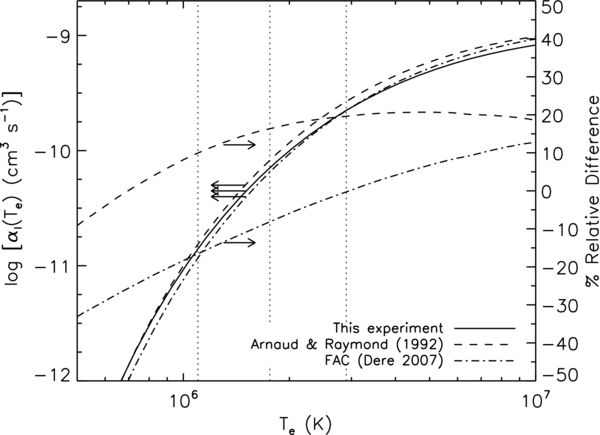
Figure 2. Single ionization rate coefficient for Fe12 + forming Fe13 +. Our results derived from the experimental data are given by the solid line. Also shown are the rate coefficients from Arnaud & Raymond (1992; dashed line) and Dere (2007; dash-dotted line). The relative differences between these and our experimental rate coefficients are also illustrated, with arrows next to the curves to clarify the relevant axis. The vertical dotted lines show the temperature range where the equilibrium ion abundance of Fe12 + is >1% with the center line denoting the temperature of maximum ion abundance (Bryans et al. 2009).
Download figure:
Standard image High-resolution imageWe used the Burgess–Tully-type formula from Dere (2007) to scale the experimental rate coefficient. The scaled rate coefficient ρ as a function of the scaled temperature x was then fit with a fifth-order polynomial. The coefficients for the fit are given in Table 2. The scaled values can be inverted to reproduce αI(Te) using
and

where E0 = 361.04 eV is the ionization threshold, t = kBTe/E0, and E1(1/t) is the first exponential integral. The experimental rate coefficient is reproduced to better than 1% over the temperature range Te = 1 × 10⁵–1 × 10⁸ K.
Table 2. Fifth-order Polynomial Fitting Parameters to Reproduce the Scaled Ionization Rate Coefficient ρ(x)
| i | ai |
|---|---|
| 0 | 15.2688 |
| 1 | −84.5935 |
| 2 | 491.954 |
| 3 | −1156.69 |
| 4 | 1238.60 |
| 5 | −505.654 |
Note.  . See Equations (3) and (4).
Download table as: ASCIITypeset image
6. RESULTS FOR DOUBLE IONIZATION
Figure 3 shows the double ionization cross section for Fe12 + forming Fe14 +. The cross section is dominated by direct ionization of an n = 2 electron followed by autoionization of the resulting intermediate state for a net double ionization. The solid line in the figure illustrates the theoretical cross section for this process. To estimate the theoretical cross section we used the LANL Atomic Physics Code (Magee et al. 1995) to calculate the cross section for direct ionization of an n = 2 electron and scaled it by the Auger yields given by Kaastra & Mewe (1993).

Figure 3. Double ionization cross section for Fe12 + forming Fe14 +. The 1σ statistical uncertainties are indicated by the error bars. The systematic uncertainty of about 6% is smaller than the statistical error bars and is not shown. The solid line shows an estimate for the double ionization cross section due to single ionization from an L-shell electron followed by autoionization. The theoretical energy threshold for direct ionization is 753.2 eV. The threshold for ionization–autoionization is predicted to be about ∼1100 eV (see the text for details).
Download figure:
Standard image High-resolution image
The experimental threshold for double ionization occurs at about 1060 eV, which is below the L-shell ionization thresholds of 1086 eV and 1110 eV predicted by the LANL code and Kaastra & Mewe (1993), respectively. This difference seems to be on the order of the uncertainties in the theoretical predictions. However, it is also possible that the cross section below the L-shell ionization threshold could be due to excitation double autoionization. For example, Dere (2007) shows EA due to n = 2 excitations to n = 5 at an energy of about ≈1060 eV in the single ionization cross section. Because this is greater than the double ionization threshold of 753.2 eV, it is energetically possible for those excited states to decay by double autoionization.
7. SUMMARY
The electron impact single and double ionization cross sections of Fe12 + have been presented here. The single ionization cross section differs from the cross section used by Arnaud & Raymond (1992) by about 20% and from that of Dere (2007) by about 15%. Similar differences are seen in the Maxwellian rate coefficients. This suggests that 15%–20% uncertainties are present in the abundance of Fe12 + relative to neighboring charge states in the existing CIE data. For double ionization, the cross section is mainly due to single ionization of an L-shell electron followed by autoionization.
We appreciate the efficient support by the MPIK accelerator and TSR groups during the beam time. This work was supported in part by the NASA Astronomy and Physics Research and Analysis program and the NASA Solar Heliospheric Physics program. We also acknowledge financial support by the Max Planck Society, Germany.