


ABSTRACT
We have carried out a survey of the north and south ecliptic poles, EP-N and EP-S, respectively, with the Spitzer Space Telescope and the Wide-field Infrared Survey Explorer (WISE). The primary objective was to cross-calibrate WISE with the Spitzer and Midcourse Space Experiment (MSX) photometric systems by developing a set of calibration stars that are common to these infrared missions. The ecliptic poles were continuous viewing zones for WISE due to its polar-crossing orbit, making these areas ideal for both absolute and internal calibrations. The Spitzer IRAC and MIPS imaging survey covers a complete area of 0.40 deg2 for the EP-N and 1.28 deg2 for the EP-S. WISE observed the whole sky in four mid-infrared bands, 3.4, 4.6, 12, and 22 μm, during its eight-month cryogenic mission, including several hundred ecliptic polar passages; here we report on the highest coverage depths achieved by WISE, an area of ∼1.5 deg2 for both poles. Located close to the center of the EP-N, the Sy-2 galaxy NGC 6552 conveniently functions as a standard calibrator to measure the red response of the 22 μm channel of WISE. Observations from Spitzer-IRAC/MIPS/IRS-LL and WISE show that the galaxy has a strong red color in the mid-infrared due to star-formation and the presence of an active galactic nucleus (AGN), while over a baseline >1 year the mid-IR photometry of NGC 6552 is shown to vary at a level less than 2%. Combining NGC 6552 with the standard calibrator stars, the achieved photometric accuracy of the WISE calibration, relative to the Spitzer and MSX systems, is 2.4%, 2.8%, 4.5%, and 5.7% for W1 (3.4 μm), W2 (4.6 μm), W3 (12 μm), and W4 (22 μm), respectively. The WISE photometry is internally stable to better than 0.1% over the cryogenic lifetime of the mission. The secondary objective of the Spitzer–WISE Survey was to explore the poles at greater flux-level depths, exploiting the higher angular resolution Spitzer observations and the exceptionally deep (in total coverage) WISE observations that potentially reach down to the confusion limit of the survey. The rich Spitzer and WISE data sets were used to study the Galactic and extragalactic populations through source counts, color–magnitude and color–color diagrams. As an example of what the data sets facilitate, we have separated stars from galaxies, delineated normal galaxies from power-law-dominated AGNs, and reported on the different fractions of extragalactic populations. In the EP-N, we find an AGN source density of ∼260 deg−2 to a 12 μm depth of 115 μJy, representing 15% of the total extragalactic population to this depth, similar to what has been observed for low-luminosity AGNs in other fields.
Export citation and abstract BibTeX RIS
1. INTRODUCTION
Launched in 2009 December into a Sun-synchronous polar orbit, over a time span of eight months the Wide-field Infrared Survey Explorer (WISE) completed its primary mission to survey the entire sky in the mid-infrared bands at 3.4, 4.6, 12, and 22 μm (Wright et al. 2010). The polar trajectory guaranteed that WISE observed one of the ecliptic poles every 1/2 orbit (43 minutes) throughout the survey, making these continuous viewing zones (CVZs) ideal calibration fields for both absolute and relative measurements. Preceding WISE, both the Infrared Astronomical Satellite (IRAS) and AKARI used the north ecliptic pole as a continuous view zone to conduct calibration measurements and deeper observations relative to the typical depths that these surveys achieved (Hacking & Houck 1987; Matsuhara et al. 2006; Wada et al. 2008). Multiple polar passages are also unique in that they facilitate the study of variability over time scales ranging from minutes to months. Combining all of the WISE polar observations, the resulting mosaics will represent the deepest observations that WISE produces, enabling study of the early universe at mid-infrared (mid-IR) wavelengths.
WISE is calibrated on the same absolute basis as that established for the Spitzer Space Telescope. Networks of calibration stars support Spitzer observations with the Infrared Array Camera (IRAC), Multiband Imaging Photometer (MIPS), and Infrared Spectrograph (IRS), further providing cross-calibration between all three instruments. IRAC's primary suite of standard calibration stars lies in the north ecliptic pole CVZ (Reach et al. 2005). Their stellar energy distributions were constructed by Cohen et al. (2003) to tie directly to the absolute mid-infrared calibrations by the Midcourse Space Experiment (MSX; Price et al. 2004). Japan's AKARI mission uses identical techniques and is tied to Spitzer by having absolute calibrators in common, drawn from the same networks (Ishihara et al. 2006). It is natural that WISE should adopt the same approach to absolute and relative calibration so that data from all these infrared missions can be simply merged.
Accordingly the WISE team, in collaboration with the Spitzer Science Center (SSC), carried out a survey of the ecliptic CVZs using the full complement of Spitzer instrumentation: IRAC and MIPS broadband mapping of a 47' × 47' (0.6 deg2) region for each CVZ, and IRS spectroscopy of either previously identified calibrator stars or newly developed standard calibrators. The surveys are referred to as EP-N (ecliptic north) and EP-S (ecliptic south). The imaging and spectroscopic observations include the galaxy NGC 6552, used to cross-calibrate the long-wavelength band of WISE with the Spitzer IRS-LL and MIPS 24 μm channel (hereafter referred to as MIPS-24). The polar surveys are used to (1) provide consistent calibrators in both of the WISE CVZs, (2) develop new calibrators in the EP-S, (3) establish the photospheric character of all candidate calibrators, (4) assess the long-term stability for secondary standards, (5) identify objects that will saturate the WISE arrays, (6) identify galaxies that are resolved by IRAC, and measure their properties using methods appropriate to extended sources, and (7) study the stellar and extragalactic populations using the full suite of IR imaging.
This paper presents the WISE photometric calibration strategy, Spitzer and WISE observations and measurement results of the polar regions, and explores the imaging data sets catalogued for both point and resolved sources. The organization of this paper is as follows: Section 2 presents the WISE imaging and photometric system, Section 3 presents the strategy for producing calibration standards, Section 4 overviews the Spitzer and WISE observations of the ecliptic poles, and Section 5 presents the photometric results for the polar standards, the source counts and colors for the complete catalog of sources in the region. The fundamental results are summarized in Section 6, followed by an Appendix that lists the WISE calibration stars, IRS spectroscopy, and their spectral energy distributions (SEDs).
All reported magnitudes are in the Vega System. Conversions to the AB System are given in Section 2.2 and Table 1.
Table 1. WISE Zero Magnitude Attributes
| Band | In-Band | Bw | Fλ(iso) | λ(iso) | Bw | ν(iso) | Fν(iso) | F*ν(iso) | AB mag |
|---|---|---|---|---|---|---|---|---|---|
| W cm−2 | μm | W cm−2μm−1 | μm | Hz | Hz | Jy | Jy | ||
| Unc(InBd) | Unc(Bw) | Unc(Fλ) | Unc(λ) | Unc(Bw) | Unc(ν) | Unc(Fν) | Unc(Fν) | ||
| W cm−2 | μm | W cm−2μm−1 | μm | Hz | Hz | Jy | Jy | ||
| W1 | 5.4188E−15 | 6.6256E−01 | 8.1787E−15 | 3.3526 | 1.7506E+13 | 8.8560E+13 | 309.540 | 306.682 | 2.699 |
| 7.9666E−17 | 1.2168E−03 | 1.2118E−16 | 0.0132 | 3.0407E+10 | 7.2306E+11 | 4.582 | 4.600 | ||
| W2 | 2.5172E−15 | 1.0423E+00 | 2.4150E−15 | 4.6028 | 1.4653E+13 | 6.4451E+13 | 171.787 | 170.663 | 3.339 |
| 3.6858E−17 | 1.0982E−03 | 3.5454E−17 | 0.0168 | 1.1759E+10 | 5.0629E+11 | 2.516 | 2.600 | ||
| W3 | 3.5878E−16 | 5.5069E+00 | 6.5151E−17 | 11.5608 | 1.1327E+13 | 2.6753E+13 | 31.674 | 29.045 | 5.174 |
| 5.3306E−18 | 1.6942E−02 | 9.8851E−19 | 0.0446 | 8.5791E+09 | 1.9731E+11 | 0.450 | 0.436 | ||
| W4 | 2.0876E−17 | 4.1013E+00 | 5.0901E−18 | 22.0883 | 2.4961E+12 | 1.3456E+13 | 8.363 | 8.284 | 6.620 |
| 3.7888E−19 | 4.4812E−02 | 1.0783E−19 | 0.1184 | 4.0207E+09 | 1.0049E+11 | 0.293f | 0.290 |
Notes. The "idealized" Vega in-band flux is measured by spectrally integrating over the peak-normalized WISE photon-counting RSRs (see Figure 1). Dividing by the RSR bandwidth, Bw(λ), the resultant passband mean flux density, Fλ(Vega), represents the λ(iso) monochromatic or isophotal flux density, Fλ(iso). Likewise, Fν(iso) is the constant Fν that gives the same response as Vega: Fν(Vega) = Fν(iso); it is derived from the WISE photon-counting RSRs cast in frequency terms. It can also be computed as F*ν(iso)/f0 where F*ν(iso) and the flux correction factor, f0, are given in Wright et al. (2010). For example, for a source with spectrum Fν = constant, the correction factors are 0.991, 0.994, 0.917 and 0.991, for W1, W2, W3, and W4, respectively. The monochromatic AB magnitudes are computed from −2.5×log10[Fν(iso)] + 8.926 (Tokunaga & Vacca 2005).
Download table as: ASCIITypeset image
2. WISE SPECIFICATIONS
2.1. Mission Overview
WISE is a NASA-funded Medium-Class Explorer mission, consisting of a 40 cm space-based infrared telescope whose science payload consists of mega-pixel cameras, cooled with a two-stage solid hydrogen cryostat. The near-IR channels, 3.4 and 4.6 μm are comprised of HAWAII 1-RG 1024 × 1024 HgCdTe arrays with a pixel scale of 2.75 arcsec pixel−1, operating at temperatures of 30–34 K. The WISE mid-IR channels, 12 and 22 μm, are comprised of DRS Si:As 1024 × 1024 Blocked Impurity Band detectors operating at 7.8 K (the optics are cooled to 17 K). A more detailed description of the science payload and detector arrays is given in Mainzer et al. (2005), Liu et al. (2008), and Wright et al. (2010).
Dichroic beam splitters allow simultaneous images in the four WISE bands, each covering a 47' × 47' field of view.
For each frame snapshot, 11 s exposures are achieved using a scan mirror that stabilizes the line of sight while the spacecraft scans the sky, achieving an angular resolution of ∼6'' in the short bandpasses and ∼12'' in the longest bandpass. Multiple, overlapping frames are combined to form deeper co-added images. After ∼8 months of continuous observations from a Sun-synchronous, circular, 525 km polar orbit, WISE mapped the entire sky at 3.4 μm (W1), 4.6 μm (W2), 12 μm (W3), and 22 μm (W4) with minimum 5σ sensitivities of 0.08, 0.11, 0.8, and 6 mJy, respectively. The imaging swept up objects ranging from cool asteroids (Masiero et al. 2010), brown dwarfs (Mainzer et al. 2011), planetary nebulae (Ressler et al. 2010), to the most luminous galaxies in the universe (P. Eisenhardt et al. 2011, in preparation), widely spanning the solar system, Milky Way, and the extragalactic universe: for median coverage, WISE detects L* galaxies to a redshift of ∼0.5. The primary data products will be a co-added Image Atlas and a Source Catalogue, available through the Infrared Science Archive. A detailed description of the WISE mission is given in Wright et al. (2010).
2.2. WISE Zero Magnitude Attributes
The fundamental components that are used to derive the WISE zero magnitude attributes are the WISE relative system response curves (RSRs) and an "ideal" Vega photospheric spectrum in which the effective temperature is uniform across the stellar surface (described in Cohen et al. 1992). The attributes include the system wavelengths, bandwidths, and monochromatic flux densities, described below.
The WISE relative spectral response throughput was measured with end-to-end lab measurements prior to launch (Latvakoski et al. 2010). Wright et al. (2010) describe in detail how the RSRs were constructed from a combination of the measured, component data and design values. The final form they take, R(λ), is in electrons per photon (see Figure 6 of Wright et al. 2010). Following the prescription of Bessell (2000), we convert the QE-based Wright et al. (2010) RSRs from electrons per photon to photon-counting (electrons per erg) response curves, λR(λ), by multiplying by λ and renormalizing each to a peak of unity. The WISE photon-counting RSRs, see Figure 1, may be accessed through the WISE Preliminary Release Source Catalog (Cutri et al. 2011).11 As can be seen, both W1 and W2 passbands have close correspondence with those of IRAC-1 and IRAC-2, although the W1 passband is slightly "blue" compared to IRAC-1 and W2 is slightly "red" compared to IRAC-2. The reddest channel of WISE, W4 at 22 μm, compares well with MIPS-24, although it is slightly bluer in response. Compared to Spitzer imaging, the only unique band of WISE is that of W3 (12 μm) which has only small overlap with that of IRAC-4 (8 μm), but is comparable to the IRAS 12 μm channel. One consequence of this band-to-band difference is demonstrated in Figure 1; the spectrum of ultra-luminous infrared galaxy Arp 220 has strong polycyclic aromatic hydrocarbon (PAH) emission bands, notably at 11.3 μm compared to the bands at 6.2 and 7.7 μm. WISE W3 compared to IRAC-4 will be more sensitive to both PAH emission and amorphous silicate absorption (10 μm) in nearby star-forming galaxies. Moreover, because W3 is a longer-wavelength channel than IRAC-4, it is more sensitive to higher-redshift galaxies in which strong near-IR continuum and mid-IR emission features redshift into the band.
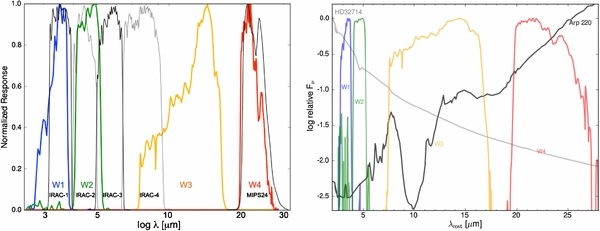
Figure 1. WISE photon-counting relative system response (RSR) curves, λR(λ), normalized to unity. (Left) The WISE RSRs of W1 (3.4 μm; blue), W2 (4.6 μm; green), W3 (12 μm; orange), and W4 (22 μm; red) are compared to the Spitzer IRAC-1 (3.6 μm), IRAC-2 (4.5 μm), IRAC-3 (5.8 μm), IRAC-4 (8.0 μm), and MIPS-24 (24 μm) array-averaged response curves (all shown with black and gray lines). (Right) Contrasting spectra, the starburst galaxy Arp 220 (Armus et al. 2007) and the K2III calibration star HD32174 spectra are shown in relation to the WISE RSRs.
Download figure:
Standard image High-resolution imageThe monochromatic or isophotal flux density, Fλ(iso) = Fλ(Vega), was derived by computing the mean flux in the passband: integrating the modified Vega spectrum across the photon-counting WISE RSRs, thus computing the in-band flux (units of W cm−2), and normalizing by the RSR bandwidth (units of μm). The corresponding isophotal system wavelengths are 3.35, 4.60, 11.56, and 22.08 μm. For the frequency equivalent flux density, Fν(iso) = Fν(Vega), we applied the method described in Cohen et al. (1999) and Tokunaga & Vacca (2005), recasting each WISE RSR in frequency terms (bandwidth in Hz units), used to normalize the Vega in-band flux. Wright et al. (2010) use a different treatment to calculate the monochromatic Fν(iso) values that is based on Fλ = constant and the direct conversion of Fλ(iso) to Fν(iso) using the formulation F*ν(iso) equals (λ2(iso)/c)Fλ(iso). Since this method is an approximation for wide passbands, notably W3, Wright et al. (2010) provide a set of color corrections, f0, in the sense that F*ν(iso)/f0 transforms to Fν(iso). For example, a source with a spectrum that is constant with Fν has correction factors of 0.991, 0.994, 0.917 and 0.991, for W1, W2, W3, and W4, respectively, such that zero magnitude follows from F*ν(iso)/correction factor.
Absolute measurements of stars and comparisons of stellar irradiances with those of emissive reference spheres were made by MSX. This "ideal" Vega spectrum was absolutely validated by photometry on the MSX (Price et al. 2004) and provided the basis for defining the zero magnitude for the Infrared Space Observatory (ISO; Schaeidt et al. 1996; Cohen et al. 1996; Schulz et al. 2002), MSX (Cohen et al. 1992; Cohen et al. 1999), Spitzer (Cohen et al. 2003), and AKARI (Tanabe et al. 2008; Ishihara et al. 2010) infrared space telescopes. This validated zero magnitude system is traceable to measurements using K (primary) and M giant (secondary) calibrators and has an absolute precision of ±1.10%. This basis now serves the same purpose for the four WISE bands, ensuring that their photometric calibrations have been computed in the same manner as for these previous missions.
The in-band fluxes of the Vega spectrum were adopted to define zero magnitude for WISE bands W1, W2, and W3. Data for W4 incorporate the 2.7% upward offset from the Vega basis model that was established absolutely by MSX at 21.3 μm (Price et al. 2004: Table 4, Column 7, and Table 9, Column 2), and applied by Cohen (2009) in the validation of the diffuse calibration of Spitzer MIPS-24 by comparison with the MSX 21.3-μm band. This Vega basis has an overall systematic uncertainty of ∼1.45%.
Given the flux density in Jy units, the Vega-system magnitude is computed using −2.5 × log10 [Sν/Fν(iso)] with the isophotal fluxes. Conversion to the monochromatic AB system entails an additional 2.699, 3.339, 5.174, and 6.620 added to the Vega magnitudes for W1, W2, W3, and W4, respectively, derived from −2.5 ×log10[Fν(iso)] + 8.926 (Tokunaga & Vacca 2005).
The resultant in-band fluxes and isophotal quantities and their estimated uncertainties are given in Table 1 for both wavelength-based and frequency-based RSRs.
3. STANDARD STAR CALIBRATION: STRATEGY AND SELECTION
The WISE photometric calibration is achieved through a network of standard stars, tied to the MSX and Spitzer systems, that are located in close proximity to the ecliptic poles and the WISE CVZs. Because WISE often interrupted science operations over the heavily surveyed poles to perform engineering activities such as Tracking and Data Relay Satellite System (TDRSS) downlinks, momentum dumps, and detector anneals, but not generally at both poles in succession; it is important to have calibrators at both poles to minimize the time between calibrations in case there is photometric drift between polar passages (note: as presented in the following sections, the WISE detector response turns out to be very stable and non-varying throughout the mission). Moreover, the additional calibrators bolster the statistics, notably for the sparse availability of W3 and W4 sources at the poles.
The IRAC and MIPS-24 EP-N survey recover all calibrators and cross calibrators built for Spitzer (Cohen et al. 2003) within the WISE northern CVZs, including a set of calibrators that were developed to support IRAC (Reach et al. 2005). For the south, however, the Spitzer–SAGE Legacy (Meixner et al. 2006) calibrators do not extend into the WISE southern CVZ. Consequently, we developed a set of candidate standard stars, located in the EP-S, using optical spectroscopy and photometry (described in Section 4.2.2) and infrared spectroscopy (Section 4.1.4).
From these sets, the WISE primary polar calibrators were selected to be non-variable A0-A5 dwarfs or K0-M0 giants without IR excesses, within a 23 5 radius of either pole, and be at least 50σ but not saturating for WISE in a single 11s frame. These stars also need to be isolated from close neighbors and any extended emission. To ensure sufficient EP-S calibrators on each orbit we accepted four F or G dwarfs in addition to the A-dwarfs and K-M giants. A total of ten calibrators are located in the EP-N, and a total of eight calibrators are located in the EP-S (note: one the EP-S sources was later removed from WISE photometric calibration process due to unacceptable confusion from a nearby source). In addition to the standard stars in the CVZ, we have also developed the EP-N galaxy, NGC 6552, as photometric calibrator to test the "red" response of the WISE system.
These sets of normal stars calibrate WISE's three shorter wavelength bands, covering a relatively large dynamic range. Every calibrator has a flux-calibrated optical+near-IR+mid-IR spectrum that accommodates the IRAC, WISE, and MIPS-24 RSRs. Integrating the spectrum (or normalized model template) over the RSRs, the resulting in-band flux normalized by the bandwidth represents the predicted flux density of the calibration star.
The MIPS 24 μm polar surveys directly test magnitudes of existing standards predicted by integrating the 24 μm RSR over the calibrated stellar photospheres, and across the spectrum of EP-N galaxy NGC 6552. The objective of the low-resolution IRS spectra of existing IRAC (EP-N) calibrators was to confirm the photospheric behavior of these stars between 8 μm and 32 μm, so that they could be used as fiducials for WISE. Stars with no indications of thermal dust emission or other spectral anomalies within the 12 and 22-μm WISE bands and that are well-predicted in MIPS-24, are suitable calibrators for WISE. Unfortunately for the CVZs, the stellar calibrators are generally too faint in the longest wavelength band, W4, and only NGC 6552 is a suitable calibrator for this band. Consequently, a set of bright MIPS-24 calibrators located just outside of the ecliptic poles (Engelbracht et al. 2007), some of which were designated originally as Spitzer cross-calibrators and/or SAGE standards, were also used to calibrate the WISE 22 μm band.
Candidate calibration sources that turned out to be too faint, too bright (saturated) or confused with other nearby sources in the WISE measurements were dropped from the calibration process for the band in question. The final sample numbers are summarized in Table 2, providing the totals per band in the primary CVZs (EP-N and EP-S) and just outside of the CVZs, the secondary "off-pole" sources. In the following sections, the actual sources and their photometric attributes will be presented.
Table 2. Summary of Standard Stars used for WISE Photometric Calibration
| Region | W1 | W2 | W3 | W4 | |
|---|---|---|---|---|---|
| EP-N | 10 | 10 | 2 | 1a | |
| Off-pole | ⋅⋅⋅ | ⋅⋅⋅ | 1 | 14 | |
| Total | 10 | 10 | 3 | 15 | |
| EP-S | 7 | 7 | 4 | ⋅⋅⋅ | |
| Off-pole | ⋅⋅⋅ | ⋅⋅⋅ | 6 | 16 | |
| Total | 7 | 7 | 10 | 16 |
Note. aGalaxy NGC 6552. Off-pole sources refer to calibration stars that are within 5 deg of the pole but outside of the WISE CVZs.
Download table as: ASCIITypeset image
WISE raw photometric measurements, in data units (DN), are transformed to calibrated magnitudes by an instrumental zero point magnitude, statistically derived from the photometric measurements of the calibration stars and their predicted flux densities (Jy units) that are converted to their equivalent magnitude form using the WISE Fν(iso) values (Table 1). In Section 5 we show the steps from the fundamental measurements, DN and Jy, to calibrated WISE magnitudes.
4. OBSERVATIONS, DATA AND REDUCTIONS
4.1. Spitzer
Spitzer observations of the ecliptic poles were carried out in support of photometric calibration of the WISE point source photometry. The imaging cameras were used to map the poles, and the spectrometer targeted individual stars for mid-infrared spectroscopy. The data are contained in four Spitzer programs, with PID numbers 464, 472, 482 and 1302. Additionally, the EP-S observations are supplemented by the Spitzer legacy survey of the Large Magellanic Cloud (SAGE; Meixner et al. 2006), which covers more than half of the WISE SEP-CVZ.
4.1.1. IRAC
The EP-N data are comprised of two separate AORs: Key = 23820800 (2007 August 16) and 23821056 (2007 September 13), whose separation in time was chosen to optimize the spacecraft rotation between epochs. The region was mapped with 12s high dynamic range imaging using an 18 × 18 exposure grid with one-half frame overlaps, covering a total area of approximately 0.4–0.5 deg2 with a coverage depth of eight individual exposures (four from each epoch). The 8 × redundancy scheme improves sensitivity, artifact removal and mitigation of focal-plane non-uniformities. The individual basic calibrated data (BCD) frames were combined to form deep mosaic images using the WISE Astronomical Image Co-adder (AWAIC; Masci & Fowler 2009), which includes removal of temporal outliers (e.g., cosmic rays), background matching, and astrometric and photometric calibration. The total integration time is 96s (8 × 12s), achieving 5σ point-source limits of 10, 12, 27, and 45 μJy (18.6, 17.9, 16.6, and 15.4 mag), in IRAC-1, 2, 3, and 4, respectively. The EP-N mosaic is shown in Figure 2; note the bright sources near the center of the field: NGC 6543, the "Cat's Eye" Nebula and the Seyfert Type-II galaxy NGC 6552 (Figure 3). The non-standard orientation of the EP images reflects the native orientation of the spacecraft as it mapped the poles, thereby producing the best spatial resolution mosaics.
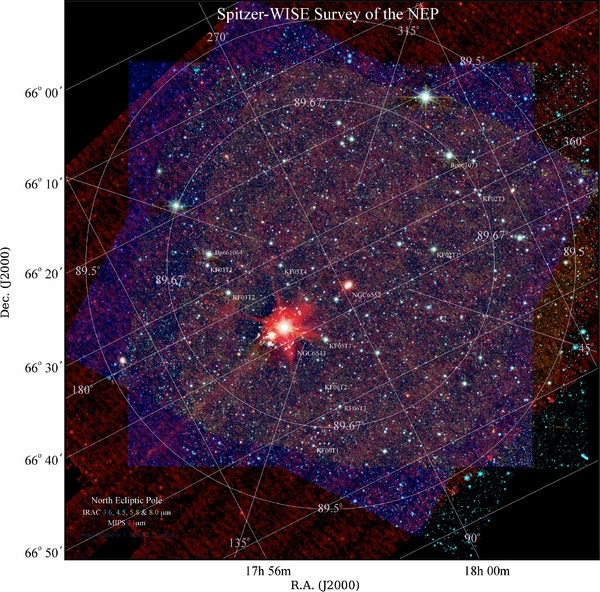
Figure 2. Spitzer view of the EP-N. The survey is centered on the north ecliptic pole (R.A. = 18h00m00s, decl. = +66d33m38 552 J2000; l = 96
 384, b = 29812) with a coverage of about 1 deg in diameter. The colors correspond to: 3.6 μm (blue), 4.5 μm (green), 5.8 μm (yellow), 8.0 μm (orange), and 24 μm (red). Standard calibrators are labeled; the two bright red objects at center are the "Cat's Eye" planetary nebula (NGC 6543) and the Sy-2 galaxy NGC 6552 (see also Figure 3). Note the string of MIPS-24 latent images extending to the lower left (at a 45°angle) of the "Cat's Eye". Both equatorial (white) and ecliptic (magenta) coordinate grids are overlaid; the orientation corresponds to the native spacecraft orientation during the mapping of the first epoch observations.
Download figure:
Standard image High-resolution image
Figure 3. Mid-IR view of the "Cat's Eye" Nebula and NGC 6552 in the EP-N. (left) IRAC + MIPS bands: 3.6 μm (blue), 4.5 μm (green), 8.0 μm (orange), and 24 μm (red). (right) WISE bands: 3.4 μm (blue), 4.6 μm (green), 12 μm (orange), and 22 μm (red).
Download figure:
Standard image High-resolution imageThe EP-S data are comprised of two separate AORs: Key = 24321024 (2007 October 19) and 24320512 (2008 January 5). As with the EP-N, the epoch separation in time was chosen to optimize the spacecraft rotation. A smaller region of the area was mapped, with grid size 15 × 17, also with half-image overlaps and 8× redundancy. For these dedicated and relatively small area observations the depth is comparable to the EP-N survey and roughly twice the depth of the SAGE imaging of the LMC (Meixner et al. 2006). To construct a larger area field, we combine our data with that of SAGE, creating an area of 1.28 deg2, thus fully covering the WISE CVZ in the south (Figure 4). The SAGE region has 5σ limits of 20, 25, 65, and 85 μJy (17.9, 17.1, 15.6, and 14.7 mag) in IRAC-1, 2, 3, and 4, respectively; bear in mind that the EP-S coverage is not uniform throughout but 2× deeper in the northwest section compared to the southeast section that is comprised of SAGE imaging (see Figure 4).
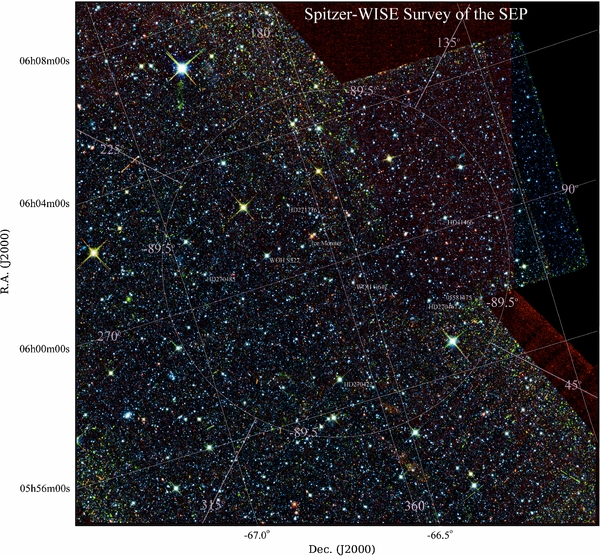
Figure 4. Spitzer view of the EP-S. The survey center is on the south ecliptic pole (R.A. = 06h00m0000, decl. =  J2000; l = 276384, b = −29811) with a coverage of about 1.5 deg in diameter. The heart of the Large Magellanic Clouds is located 4.7 deg to the southeast. The colors correspond to: 3.6 μm (blue), 4.5 μm (green), 5.8 μm (yellow), 8.0 μm (orange), and 24 μm (red). Standard calibrators are labeled, where the "ice" monitor corresponds to planetary nebula AKARI 060059-663615. Both equatorial (white) and ecliptic (magenta) coordinate grids are overlaid; the orientation corresponds to the native spacecraft orientation during the mapping observations.
Download figure:
Standard image High-resolution image4.1.2. MIPS
The EP-N data are collected in AOR Key = 24320768 (2008 January 6), and the EP-S data in AOR Key = 24320512 (2008 January 5). Both polar regions were mapped using a fast scanning mode, 12 legs of one degree length and 5' width. Only the MIPS-24 imaging is reported here, but the MIPS-70 imaging exists in the Spitzer archive. The individual BCD frames were combined to form deep mosaic images using WISE-AWAIC, with the pixel scale and orientation matched to that of the IRAC mosaics, thus oversampling the native pixel scale while maintaining the photometric calibration and spatial resolution integrity of the original data. Additionally, MIPS photometry-mode observations of four candidate calibration stars were conducted. The basic Spitzer Science Center pipeline products were used to extract photometry from these four sources. The achieved 5σ point-source sensitivity is 325 μJy (10.90 mag) for both the EP-N and EP-S.
4.1.3. Source Detection and Extraction from Spitzer Imaging
Source detection and characterization were carried out using software tools adapted from the WISE data processing pipeline developed by the WISE Science Data Center (WSDC) of the Infrared Processing and Analysis Center (IPAC). The distinguishing characteristic of the system is that it uses all (five) IRAC+MIPS-24 bands simultaneously detect sources. The detection is based on the thresholding of a "detection" image derived from a set of matched filter images in the relevant bands. The algorithm and performance are presented in Marsh & Jarrett (2011); key algorithmic details include calculating the optimal matched filter at each wavelength and combining the resulting single-band images in quadrature to produce a detection image in units of sigma (the local standard deviation of noise), which is then searched for local maxima.
The advantages of doing the detection simultaneously at multiple bands are as follows.
- 1.Increased sensitivity to weak sources due to the fact that detection is based on the stack of images at all bands.
- 2.No separate bandmerging step is required, thus avoiding the ambiguities which can occur when trying to associate sources in different bands in the presence of confusion.
- 3.The higher-resolution IRAC data at the shorter wavelengths can guide the extraction at the longer wavelengths (MIPS-24) where the resolution is poorer.
Using the source detection list as an input table of sources to investigate, all measurements are carried out on the combined, mosaic images, and as with the detection step, the extraction is carried out on all bands simultaneously. Integrated fluxes are derived from optimal, inverse-variance weighting point-spread function (PSF) fits to all bands simultaneously. PSF-fitting represents a maximum likelihood estimate of the source position and the set of fluxes at the five Spitzer wavelengths for each source candidate identified by the detection step. The candidate source and its neighbors (i.e., adjacent candidates whose PSF responses overlap significantly with the primary candidate) are grouped into blends, and their parameters estimated simultaneously. Extracted measurements include the equatorial positions and corresponding uncertainties, integrated fluxes from both PSF-fitting and aperture measurements, χ2 fit metrics, band-to-band colors and photometric quality flags.
Resolved sources require a separate characterization due to complex shapes and extended emission arising beyond the PSF. Galaxies are identified through visual inspection; their position, shape and size are determined using interactive tools that were designed specifically for 2MASS resolved galaxy characterization (Jarrett et al. 2000, 2003). The integrated flux is extracted from the 1σ elliptical isophote, an adequate proxy for the total flux at the ∼10% level. Extracted measurements include the equatorial positions, elliptical shape parameters of size, axis ratio and position angle, integrated fluxes, mean surface brightness and band-to-band colors.
4.1.4. IRS Spectroscopy
Low-resolution observations, both IRS-SL and IRS-LL modes, were obtained for both EP-N and EP-S calibration stars to establish the absence of any mid-IR excess above their photosphere fluxes (see Figure 29). The basic SSC pipeline reductions were used to produce a calibrated spectrum for each source, presented in Figure 29 in the Appendix. Although most of these sources have low signal-to-noise ratio (S/N) in the IRS-LL module, they have adequate S/N in the IRS-SL modules (λ< 14 μm) to assess the spectral shape across the W1 and W2 bands of WISE.
In Figure 30 in the Appendix, the IRS spectroscopy of calibrators that are common to both WISE and SAGE is presented, including bright off-pole sources used to calibrate the W3 and W4 bands. Since these sources are significantly brighter than the CVZ calibrators, the spectra have better S/N, especially for the IRS-LL modules. As presented in λ4Fλ units, the flat profiles demonstrate the characteristic Rayleigh–Jeans photospheric emission of K–M giants.
Finally, the galaxy NGC 6552 in the EP-N was observed with IRS-LL in two separate AORs (AOR Keys = 27304192 and 27304448) in order to develop this source—unresolved by MIPS and IRS—as a WISE W4 calibrator in the northern CVZ. The LL data were carefully cleaned of bad pixels and combined using the SSC software CUBISM (Smith et al 2007). The spectrum is discussed in detail in the following sections.
4.2. WISE
In this work, we report on the WISE observations of the ecliptic poles consisting of several hundred total passes that cross or touch the CVZs, combined into a single, deep mosaic per band. Because of hardware memory limitations with processing the WISE data, this is not the complete set of polar observations that WISE acquired over the lifetime of the cryogenic mission; however, it does represent a significant fraction of the total and is likely reaching the confusion limit capabilities of the imaging in the W1 and W2 bands. The coverage depth ranges from 60 passes (providing a total of 60 frames per band) at the edges to 250 (frames) in the central 0.5 deg2 pole region. For the analysis to follow, we will avoid the lower coverage boundary and focus on the region that is within 0.7 deg of the pole, consisting of an area 1.54 deg2, ranging in coverage depth from 125 to 250 passes.
The sensitivity depth that these combined mosaics attain is much deeper than the typical WISE field, which has depth of coverage from ∼10–15 passes, depending on the ecliptic latitude of the field.12 For both the EP-N and EP-S WISE surveys, the 5σ point-source limits, as given by the photometric error model, are 18, 23, 139, and 800 μJy (18.1, 17.2, 13.4 and 10.1 mag) in W1, W2, W3, and W4, respectively, using the Fν(iso) conversion in Table 1. These sensitivities are well below the expected confusion noise limits for WISE W1 and W2, and so the actual completeness at these depths is relatively low. In Section 5.2.2 the differential source counts and 90% completeness estimates reveal limits that are much brighter.
4.2.1. Source Detection and Extraction from WISE Imaging
As with the Spitzer imaging data reductions (see above), source detection and characterization were carried out using tools developed specifically for the WISE mission by the WSDC. The detection step is similar: both use the deep combined mosaics to identify local maxima, representing candidate point sources, that are further deblended and characterized in the profile-fitting operation.
For source characterization, however, there is one important difference between the respective data reductions. For Spitzer, the photometric measurements were carried out on the combined, deep mosaic images. For WISE, the extraction (profile-fitting) is instead carried out on each individual frame for all bands simultaneously. It thus utilizes an optimal combination of the multi-band imaging data for source photometry, mitigating unruly pixels, artifacts, cosmic radiation hits, source saturation, and angular resolution differences.
The multi-frame, multi-band estimation process represents a departure from the traditional procedure, employed in such software packages as DAOPHOT (Stetson 1987) and SExtractor (Bertin & Arnouts 1996), in which detection and characterization are carried out one band at a time. Another motivation for developing new source extraction algorithms is that currently available packages operate on a single regularly sampled image rather than a set of dithered images. The procedures employed in WISE are optimized for the latter case, correcting for optical distortions and outlier (radiation event) rejection in the individual frames that WISE acquires in orbit.
4.2.2. Ancillary Calibrations
The EP-S calibrators were supported by an extensive ground-based program of optical classification for objects lacking types from the Michigan Spectral Survey (Houk & Smith-Moore 1988). Ground-based optical spectroscopy of all eight EP-S stars was kindly provided by Dr. M. Bessell of the Australian National University during 2007 November 23–26, using the Double Beam Spectrograph of the Australian National University's 2.3 m telescope. The useful wavelength range was from 3200 to 9000 Å.
Spectral features were compared with the empirical spectra in the MILES database (Sanchez-Blazquez et al. 2006; Cenarro et al. 2007) to estimate stellar parameters. Synthetic Kurucz model spectra were generated with the best-fit parameters for each star and those spectra were treated as stellar templates to be normalized by optical and infrared data (Cohen et al. 1999, 2003).
Optical photometry of our EP-S candidate stars was kindly brokered for us by Dr. D. Kilkenny and was undertaken between 2007 December and 2009 January by Drs. R. Sefako, R. F. van Wyk, and D. Kilkenny, using the 20 inch telescope of the South African Astronomical Observatory (SAAO). The observations were reduced at the SAAO by D. Cooper.
Optical photometry, 2MASS photometry from the 2MASS Point Source Catalog (Skrutskie et al. 2006; Cutri et al. 2003) and mid-infrared photometry from IRAS, MSX, and Spitzer were used to construct SEDs and compared with the model spectra integrated over the RSRs from the various instruments. Ratios of observed in-band fluxes to synthetic in-band fluxes and their associated uncertainties are the central theme of the normalization process. The resulting SEDs with the normalized model spectra are presented in the Appendix (Figures 31 and 32).
5. RESULTS AND ANALYSIS
In this section we present photometry of the calibration standards and all sources extracted in both polar fields, source counts and color diagrams. In combination with the WISE RSRs and spectral information for each source, the IRAC and MIPS-24 measurements are used to establish the instrumental zero point magnitude of the WISE measurements.
5.1. Calibration Measurements
5.1.1. EP-N Stars
The central region of the NEP (R.A. = 18h00m00s, Decl. = + J2000; l = 96384, b = 29812) contains ten standard calibration stars that are used to cross-calibrate WISE with Spitzer IRAC and MIPS-24 measurements; see Figure 2.
Near the pole center lies the Sy-2 galaxy NGC 6552, which is used to calibrate the red response of WISE (details below). At infrared wavelengths, the brightest source in the EP-N is the planetary nebula NGC 6543 ("Cat's Eye" Nebula)—Figure 3, saturating the signal in the long wavelength bands of Spitzer and WISE. For the Spitzer survey that overlaps with WISE (Figure 2), about 15,000 sources were extracted down to 5σ in at least two bands, including ∼400 galaxies that are resolved by Spitzer-IRAC.
IRAC and MIPS-24 photometry of the EP-N Spitzer–WISE cross-calibration standard stars is presented in Table 3 and their IRS spectroscopy in Figure 29. All of the sources are bright, S/N > 100 for the IRAC measurements, and ranging in S/N between 10 and 50 for the MIPS-24 measurements. For the short-wavelength WISE bands, the EP-N stars are all relatively bright, generally exceeding S/N > 50, while for W4 the stars are too faint. The standards KF06T1, KF06T2, KF06T3, KF03T1, KF03T2, KF03T4, and KF02T3 were removed as W3 standards because of their faintness; KF05T1 was removed in W3 due to potential contamination from a nearby bright star. As discussed in Section 3, due to the paucity of W3 and W4 calibrators in the EP-N, a set of bright K/M giant stars, with known IRAC and MIPS-24 photometry (Engelbracht et al. 2007; Cohen et al. 2003), that are located just outside of both polar CVZs were developed, including optical-infrared spectroscopy and spectral classification (see Figure 30) to augment the photometric calibration of WISE. A summary of the total number of sources per band used for WISE photometric calibration is given in Table 2.
Table 3. Spitzer Photometry of EP-N Standard Calibration Stars
| Name | SpT | Designation | R.A. | Decl. | [3.6] | [4.5] | [5.8] | [8.0] | [24] |
|---|---|---|---|---|---|---|---|---|---|
| (deg) | (deg) | (mag) | (mag) | (mag) | (mag) | (mag) | |||
| KF03T1 | K0III | 17574393+6626549 | 269.4330750 | 66.4486008 | 9.857 ± 0.006 | 9.946 ± 0.006 | 9.882 ± 0.006 | 9.874 ± 0.006 | 10.042 ± 0.078 |
| KF03T2 | K1.5III | 17575145+6631030 | 269.4644165 | 66.5175171 | 9.028 ± 0.006 | 9.003 ± 0.006 | 8.943 ± 0.006 | 8.916 ± 0.006 | 8.936 ± 0.051 |
| KF06T1 | K1.5III | 17575847+6652290 | 269.4936523 | 66.8747482 | 10.830 ± 0.006 | 10.867 ± 0.006 | 10.853 ± 0.006 | 10.910 ± 0.008 | ⋅⋅⋅ |
| KF06T2 | K1.5III | 17583799+6646518 | 269.6583252 | 66.7810669 | 11.078± 0.006 | 11.163 ± 0.006 | 11.121 ± 0.007 | 11.056 ± 0.008 | ⋅⋅⋅ |
| KF06T3 | K1III | 17585021+6649401 | 269.7092285 | 66.8278198 | 10.294 ± 0.006 | 10.377 ± 0.006 | 10.337 ± 0.006 | 10.307 ± 0.006 | 10.049 ± 0.102 |
| KF03T4 | K1III | 17590396+6630591 | 269.7665100 | 66.5164413 | 10.008 ± 0.006 | 10.118 ± 0.006 | 10.025 ± 0.006 | 10.024 ± 0.006 | 10.256 ± 0.100 |
| KF05T1 | K1III | 17591218+6641359 | 269.8007507 | 66.6933136 | 8.895 ± 0.006 | 8.880 ± 0.006 | 8.781 ± 0.006 | 8.829 ± 0.006 | 8.827 ± 0.051 |
| KF02T1 | K0III | 18020173+6637390 | 270.5072327 | 66.6275177 | 8.964 ± 0.006 | 8.913 ± 0.006 | 8.853 ± 0.006 | 8.846 ± 0.006 | 8.920 ± 0.031 |
| Bp661073 | K1III | 18030962+6628115 | 270.7901001 | 66.4698715 | 7.90a | 7.79a | 7.48a | 7.485 ± 0.006 | 7.888 ± 0.013 |
| KF02T3 | K0III | 18032185+6634085 | 270.8410645 | 66.5690384 | 10.211 ± 0.006 | 10.304 ± 0.006 | 10.243 ±0.006 | 10.225 ± 0.006 | 10.032 ± 0.077 |
Note. aSubject to saturation effects.
Download table as: ASCIITypeset image
5.1.2. NGC 6552
ROSAT, XMM, and Very Large Array observations of the barred disk galaxy NGC 6552 (z = 0.02649) reveal a central strong X-ray and radio source, exhibiting both Sy-1 and Sy-2 emission lines, with the type-2 designation the usual adoption (Condon et al. 1998, 2002; Gioia et al. 2003; Henry et al. 2006; Veron-Cetty & Veron 2006; Shu et al. 2007). For both MIPS-24 and W4, as well as IRS-LL, the host disk is unresolved, best characterized by a point source profile and thus making it a viable photometric calibrator at these wavelengths. Its mid-IR spectrum, Figure 5, is characterized by a steeply rising continuum (due to warm dust grain emission) and a few relatively weak (compared to the continuum) high-excitation lines that arise from the central active galactic nucleus (AGN), none of which is located in the MIPS-24 or W4 bands. To test for variability, multiple-epoch measurements of the galaxy were carried out with both Spitzer and WISE (W4 light curve shown in Figure 6), proving that the photometry is stable at the ∼2% level, at least over the period that the measurements were acquired, nearly eight months for WISE measurements. Interestingly, between day 20 and 40 there is a trend of bright measurements relative to the baseline mean, indicating either real variability or, more likely, the photometry is suffering from artifact contamination due to the close proximity of the infrared-bright NGC 6543 "Cat's Eye" planetary nebula. It is not, however, related to any variation in the WISE spectral response since sources measured in all bands show no variations over time beyond the 1% level (as demonstrated in Figure 10, below).
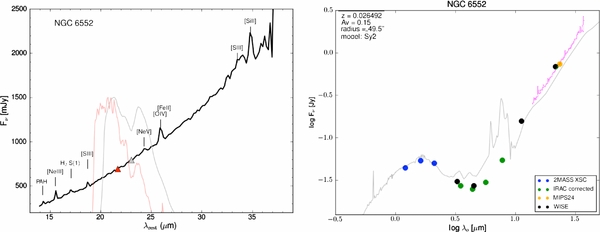
Figure 5. (Left) Rest-frame Spitzer IRS-LL spectrum of galaxy NGC 6552 in the EP-N, showing its rising (warm dust) continuum and nebular emission lines; note the high-excitation, AGN indicators: [NeV]24.3 μm and [O iv] 25.9 μm. The W4 bandpass is shown in red and the MIPS-24 in gray. Integrating the spectrum over the bandpasses, the resulting fluxes are shown with red (W4) and gray (MIPS-24) triangles. (Right) Spectral energy distribution of NGC 6552. The IRAC photometry has been aperture corrected for extended source emission (with an associated uncertainty of 2 to 3% for IRAC 1/2, and 10% for IRAC 3/4). A 4% color correction has been made to the MIPS-24. The magenta line is the IRS-LL spectrum, unresolved at these mid-IR wavelengths; the gray line corresponds to a Sy-2 model derived from the GRASIL code (Silva et al. 1998; Berta et al. 2003) normalized to the near-infrared.
Download figure:
Standard image High-resolution image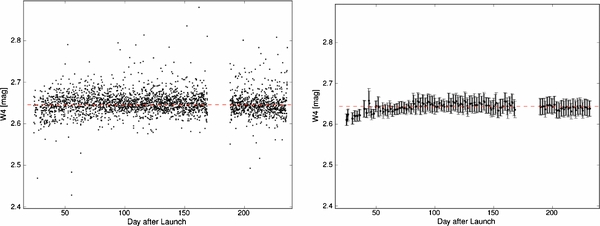
Figure 6. WISE W4 (22 μm) photometry of the galaxy NGC 6552 over the lifetime of the cryogenic mission. Day 1 corresponds to JD 2455180.5, or 2009 December 15. The gap in data between day 170 and 185 is due to optical "ghost" artifacts arising from the nearby bright "Cat's Eye" nebula which impacted the source during this period of time (note: the orientation of the north ecliptic pole rotates over time because of the precessing orbit of WISE; consequently the galaxy NGC 6552 is subject to orientation-dependent artifacts from NGC 6543 during long periods of time, and notably, day 170–185 the galaxy is contaminated by bright artifact features). The left panel shows the individual (frame) measurements, and the right panel shows the multi-frame (co-added) measurements. The error bars reflect the 1σ scatter (repeatability) in the co-added measurements. The overall rms scatter for the individual measurements is 2.1%, and 1.0% for the co-added measurements. Between day 20 and 40, there appears to be a systematic ∼few percent brightening trend in the photometry which may be real variation in the galaxy or contamination from low surface brightness artifact light arising from NGC 6543.
Download figure:
Standard image High-resolution imageSpitzer photometry of NGC 6543 and NGC 6552 is presented in Table 4, with measurements acquired using a large, ∼100'' elliptical aperture (major axis, diameter) to capture the total flux for each object, particularly necessary in the shorter wavelength bands in which the source is well resolved. Since the "Cat's Eye" imaging was saturated in the long wavelength bands (IRAC-4 and MIPS-24), the cores were recovered using tools developed by the SSC to rectify bright star saturation. The resultant MIPS-24 photometry, 150 ± 15 Jy, is slightly brighter compared to the IRAS 25 μm flux density, "fnu_z" = 135 ± 12 Jy, extracted using the IRAS Scan Processing and Integration (SCANPI) utility. For both NGC objects, the IRAC measurements have been aperture corrected with factors 0.92, 0.95, 0.82 & 0.78 (IRAC-1, 2, 3, and 4, respectively), to account for the calibration differences between point and extended sources observed by IRAC.13
Table 4. Spitzer Photometry of NGC 6543 and NGC 6552
| Name | Designation | R.A. | Decl. | R1σ | Axis Ratio | p.a. | [3.6] | [4.5] | [5.8] | [8.0] | [24] |
|---|---|---|---|---|---|---|---|---|---|---|---|
| (deg) | (deg) | (arcsec) | – | (deg) | (mag) | (mag) | (mag) | (mag) | (mag) | ||
| NGC 6543 | 17583339+6637586 | 269.639160 | 66.632957 | 52.29 | 0.850 | 14.2 | 7.611 ± 0.020 | 6.538 ± 0.020 | 6.535 ± 0.020 | 4.105 ± 0.020 | −3.28 ± 0.10 |
| NGC 6552 | 18000735+6636545 | 270.030640 | 66.615143 | 49.43 | 0.615 | −78.4 | 9.956 ± 0.021 | 9.597 ± 0.021 | 8.756 ± 0.023 | 7.412 ± 0.021 | 2.43 ± 0.05 |
Notes. The semimajor axis is derived from an ellipse fit to the 1σ isophote. The axis ratio is the minor to major axis ratio. The position angle (p.a.) is standard E of N orientation. The formal errors quoted for NGC 6552 do not include the uncertainty due to the IRAC aperture corrections required for this extended object, which can be has high as 10% for IRAC-3 and IRAC-4. The BCD frames for NGC 6543 are all heavily saturated; hence, the photometry (150 ± 15 Jy) was estimated using saturation recovery developed by the SSC and T. Jarrett. For comparison, the IRAS 25 μm photometry extracted using SCANPI is 130 Jy.
Download table as: ASCIITypeset image
WISE integrated flux measurements of NGC 6552 are presented in Table 5, also using a large aperture to capture both the point source and extended emission in the shorter wavelength bands. (No attempt is made to extract the integrated flux of NGC 6543 due to its complexity and the pixel saturation.) Unlike the IRAC extended source measurements, no additional aperture correction is needed for WISE measurements. The photometric results are graphically displayed in the NGC 6552 spectral energy distribution, Figure 5. With the addition of near-IR measurements from the 2MASS Extended Source Catalog (XSC; Jarrett et al 2003), the SED shape shows the characteristic stellar bump in the near-IR window and the steeply rising continuum at mid-IR wavelengths. The broad-band measurements are consistent with the spectral measurements of IRS-LL (Figure 5), but compared to a Sy-2 model, NGC 6552 appears to have a paucity of PAH emission at 7.7 and 11.3 μm, instead resembling more high-luminosity systems in which the PAH have been depleted or destroyed by the powerful radiation field of the central accretion disk.
Table 5. WISE Photometry of NGC 6552
| Name | Designation | R.A. | Decl. | R | [3.4] | [4.6] | [12] | [22] |
|---|---|---|---|---|---|---|---|---|
| (deg) | (deg) | (arcsec) | (mag) | (mag) | (mag) | (mag) | ||
| NGC 6552 | 18000719+6636539 | 270.02995 | 66.61498 | 50.0 | 10.01 ± 0.02 | 9.51 ± 0.02 | 5.68 ± 0.01 | 2.64 ± 0.01 |
Download table as: ASCIITypeset image
5.1.3. EP-S Stars
The central region of the SEP (R.A. =  , decl. =
  J2000; l = 276384, b = − 29811) contains eight standard calibration stars (Table 7), of which seven are used to cross-calibrate WISE with Spitzer IRAC and MIPS-24 measurements; see Figure 4.
In addition to the flux calibrators, the EP-S also contains a source that is used to monitor any ice accumulation on the WISE filter assembly. The "ice monitor" is the source AKARI 060059-663615 (S. Oyabu et al. 2011, in preparation), a probable planetary nebula located in the Large Magellanic Cloud and near the center of the EP-S. AKARI IRC spectroscopic observations were secured by Oyabu et al. on 2006 July 21. The spectrum of particular interest for WISE was taken with the 2.5–5.0 μm grism with a spectral resolution of 120 at 3.6 μm. Oyabu et al. present these data from 3.04 to 3.42 μm, and we have used AKARI photometric measurements to complete a near-IR spectrum that covers the WISE W1 band. Shown in Figure 7 (left), it features the strong PAH emission band at 3.3 μm, used to monitor any water-ice accumulation on the optics. The signature of which would be absorption in the W1 band and a subsequent decrease in signal. The photometry results are also shown in Figure 7 (right), presenting the WISE light-curve photometry for each polar passage over the lifetime of the mission. W1 is stable with a statistical variation of less than 3.0%, and likewise the other bands have an rms scatter of less than 2%–3%. The variation we would expect if this PAH band were to degrade (e.g., with τ > 0.25) is more than twice as large as the actual observed rms. Moreover, as we show below, the W1 instrumental zero point offsets shows no variation or change at the ≪1% level over time (see Figure 10). Hence we conclude that the WISE optics were likely free of any water-ice accumulation throughout the cryogenic mission lifetime.

Figure 7. (left) Near-infrared spectrum of AKARI 06005918-6636154 (shown in black), a probable LMC PN in the EP-S, used to monitor the potential build up of water-ice on the WISE optics. The 3.3 μm PAH band is clearly present and located within the WISE W1 relative system response curve (shown in red). Water-ice absorbs broadly across the band, stretching from 2.85 μm to 3.5 μm, illustrated (blue) with ice spectra at increasingly large optical depths of absorption. (right) WISE W1 photometry of the 'ice monitor over the lifetime of the mission. The rms scatter is 3%. Day 1 corresponds to JD 2455180.5, or 2009 December 15.
Download figure:
Standard image High-resolution imageFor the Spitzer EP-S survey that overlaps with WISE (Figure 4), about 65,000 total sources were extracted down to 5σ in at least two bands, including ∼500 galaxies that are resolved by Spitzer-IRAC. The total number of sources in the EP-S is significantly larger than that of the EP-N survey for two primary reasons: (1) the EP-S survey is slightly larger in area, and (2) the close proximity of the Large Magellanic Cloud more than doubles the total number of stars along the line of sight.
Photometry of the EP-S Spitzer–WISE cross-calibration standard stars, as well as the "ice monitor" is presented in Table 6. As with the EP-N calibrators, the selected standards are bright, S/N > 100 for the IRAC measurements, and range in S/N between 30 and 100 for the MIPS-24 measurements, but are typically too faint for the WISE W3 and W4 observations. The star 05581475 was removed in all WISE bands due to contamination by a close companion. The standards WOHG642, HD271776, HD270485 were removed as W3/W4 standards because of their faintness. A summary of the total number of sources per band used for WISE photometric calibration is given in Table 2.
Table 6. Spitzer Photometry of EP-S Standard Calibration Stars
| Name | SpT | Designation | R.A. | Decl. | [3.6] | [4.5] | [5.8] | [8.0] | [24] |
|---|---|---|---|---|---|---|---|---|---|
| (deg) | (deg) | (mag) | (mag) | (mag) | (mag) | (mag) | |||
| HD270422 | G0V | 05564775-6639050 | 89.1989746 | −66.6514130 | 9.311 ± 0.006 | 8.369 ± 0.006 | 7.352 ± 0.007 | 7.296 ± 0.006 | 7.399 ± 0.017 |
| HD270467 | F5V | 05581223-6620237 | 89.5509644 | −66.3399200 | 8.926 ± 0.006 | 8.818 ± 0.006 | 8.793 ± 0.006 | 8.802 ± 0.006 | 8.844 ± 0.042 |
| 05581475 | A0V | 05581476-6619273 | 89.5615234 | −66.3242645 | 12.131 ± 0.041 | 12.088 ± 0.038 | 12.071 ± 0.021 | 12.122 ± 0.027 | ⋅⋅⋅ |
| WOH_G642 | K4III | 05592094-6631559 | 89.8372726 | −66.5321960 | 9.333 ± 0.007 | 9.317 ± 0.006 | 9.298 ± 0.008 | 9.235 ± 0.007 | 9.379 ± 0.073 |
| HD41466 | F5V | 06001861-6613276 | 90.0775604 | −66.2243500 | 8.444 ± 0.006 | 8.416 ± 0.006 | 8.348 ± 0.006 | 8.362 ± 0.006 | 8.437 ± 0.055 |
| WOH_S527 | M0III | 06005106-6644397 | 90.2127838 | −66.7443619 | 8.724 ± 0.007 | 8.323 ± 0.006 | 7.518 ± 0.006 | 7.494 ± 0.006 | 7.467 ± 0.019 |
| HD270485 | F8V | 06005314-6655480 | 90.2214355 | −66.9300156 | 9.478 ± 0.007 | 9.199 ± 0.006 | 9.242 ± 0.008 | 9.301 ± 0.008 | 9.312 ± 0.048 |
| HD271776 | A5V | 06013748-6635201 | 90.4061813 | −66.5889359 | 9.660 ± 0.006 | 9.672 ± 0.006 | 9.633 ± 0.007 | 9.663 ± 0.008 | 9.677 ± 0.097 |
| aAKARI060-6636 | 06005918-6636154 | 90.2465973 | −66.6042862 | 11.936 ± 0.030 | 11.186 ± 0.009 | 9.733 ± 0.011 | 7.558 ± 0.007 | 3.975 ± 0.012 |
Note. aAKARI 060059-663615 is a LMC-PNe star used to monitor potential water-ice buildup on the filter and optical surfaces, it has a very strong PAH emission line in the IRAC-1 and W1 bands; see Figure 7.
Download table as: ASCIITypeset image
5.1.4. Combined Results
Employing calibration standards from both ecliptic polar regions, the photometric performance is graphically shown in Figures 8–10. The first figure, Figure 8, demonstrates how the native raw photometric measurements (DN units) of the calibration stars are related to their predicted flux densities. The predicted flux is derived from the in-band flux of the calibrator spectrum (Figures 31 and 32) measured within the WISE photon-counting RSRs. Tables 7 and 8 list the predicted WISE mags for the Spitzer–WISE cross-calibration sources in the CVZs and off-pole locations, respectively. The ratio DN per mJy shows a flat linear trend across the dynamic range spanned by the calibrator brightnesses. The rms scatter about the mean DN/mJy value is 2.4, 2.7, 4.0 and 6.2% for W1, W2, W3, and W4, respectively, dominated by the uncertainty in the predicted flux density (see below).
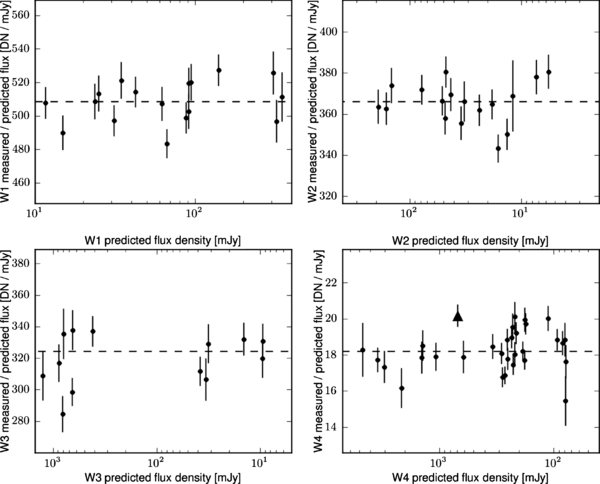
Figure 8. Standard star photometry: relating the calibration star flux density (mJy) to the raw measured flux in data units (DN). The flux density corresponds to the predicted spectral in-band WISE value for the Spitzer–WISE cross-calibration stars. The dashed line denotes the distribution median value. The rms scatter about the mean DN/mJy value is 2.4, 2.7, 4.0 and 6.2% for W1, W2, W3, and W4, respectively. NGC 6552 is denoted with a triangle for the W4 measurements.
Download figure:
Standard image High-resolution image
Figure 9. WISE photometry of the Spitzer–WISE cross-calibration stars. Similar to Figure 8, except that the measured flux (DN units) has been converted to magnitudes using the instrumental zero point, and the flux density (mJy) has been converted to magnitudes using Fν(iso) of Table 1. The residual magnitude is the difference between the predicted spectral in-band WISE value and the actual WISE measurement (with error bars). The rms scatter about the zero level is 2.4%, 2.8%, 4.5%, and 5.7% for W1, W2, W3, and W4, respectively. NGC 6552 is denoted with a triangle for the W4 measurements.
Download figure:
Standard image High-resolution image
Figure 10. WISE instrumental zero point offset magnitude time history. The binned average residual flux (mag units) for the ensemble of calibration stars is plotted over the lifetime of the cryogenic mission, where the residual flux is the difference between the calibration (predicted) value and the WISE measurement. The ensemble mean and standard deviation of the mean are (mag units) −0.003 ± 0.001, −0.001 ± 0.001, 0.022 ± 0.002, and −0.007 ± 0.005 for W1, W2, W3, and W4, respectively. NGC 6552, denoted with a triangle for the W4 measurements, is offset from the mean by 6.1% with a small scatter of 0.1% about its mean. See Figure 9 for the individual calibrator results.
Download figure:
Standard image High-resolution imageThe DN versus Jy plot is transformed to the more the familiar magnitude units by first converting the flux density to magnitude units using Fν(iso) (Table 1), and the measured integrated flux to magnitude units using the zero point magnitude.14 The zero point magnitude (per band) corresponds to the value that produces the statistically zero mean difference between the predicted magnitudes and the measured magnitudes of the calibration stars, as demonstrated in Figure 9.
For first-pass WISE processing, the instrumental zero point magnitudes were defined using the first two months of on-orbit data. As a consequence, there is a slight bias in the zero level (i.e., mag0 is slightly off) as revealed by the full 7 month complement of data; the ensemble inverse variance-weighted mean and rms in Figure 9 is 0.007 ± 0.025 mag for both W1 and W2, 0.017 ± 0.045 mag for W3, and −0.021 ± 0.057 mag for W4. A small adjustment to the WISE instrumental zero point will be made for the final processing data release (scheduled for mid-2012). The standard star ensemble results suggest that the WISE absolute calibration, tied to that of Spitzer, has rms scatter in the standard calibration stars at the 2.4%, 2.8%, 4.5%, and 5.7% levels for W1, W2, W3, and W4, respectively, and similar to the scatter in Figure 8. The observed scatter arises chiefly from the uncertainty in the predicted WISE flux values, reflecting the inherent errors associated with model fitting to the broad-band SED measurements, as well as the uncertainty in the WISE RSRs. These errors are inflated at the longer mid-IR wavelengths, notably in the W4 window; the red calibrator NGC 6552 has a W4 residual of ∼6% (Figure 10), a difference that appears to be systematic for very red sources as measured using Spitzer–IRS spectra from ultra-luminous infrared galaxies (ULIRGS; see the spectrum of Arp 220 relative to the WISE RSRs, Figure 1). Wright et al. (2010) quote −17% and 9% systematic offsets in the fluxes for W3 and W4 measurements of ULIRGS relative to the standard stars, with the red sources appearing too faint in W3 and too bright in W4, respectively.
Expanding Figure 9 along the time axis, Figure 10 shows the residual flux history for the ensemble of calibration stars. Over the lifetime of the mission, the instrumental zero point magnitude is stable to better than 0.1%; quantitatively, the unweighted sample distribution mean and standard deviation of the mean are −0.003 ± 0.001, −0.001 ± 0.001, 0.022 ± 0.002, and −0.007 ± 0.005 for W1, W2, W3, and W4, respectively. Moreover, time variability is ruled out with individual measurements over the lifetime of the mission (Figure 10); repeated observations of the individual calibrators reveal an rms scatter, typically better than 1% (note the small error bars in Figure 9).
Finally, comparison of WISE with Spitzer for all sources in the polar fields is presented in Figure 11. For the short-wavelength bands of WISE, which closely match those of IRAC, the agreement is very good, within 2%–3%, while for the longer wavelength bands where the filter response is significantly different (e.g., 12 μm versus 8 μm), there is a 15% offset in the sense that W3 and W4 are brighter than IRAC-4 and MIPS-24, respectively. These differences are consistent with the respective RSRs (Figure 1) and the mid-IR Rayleigh–Jeans spectrum of most field stars. At the faint end, W1 and W2 > 16 mag, departures arise due to flux biases associated with low-S/N detection thresholding and source blending/confusion. In the next section we show the source counts for the Spitzer and WISE surveys, noting that at the short wavelengths the depths are comparable.
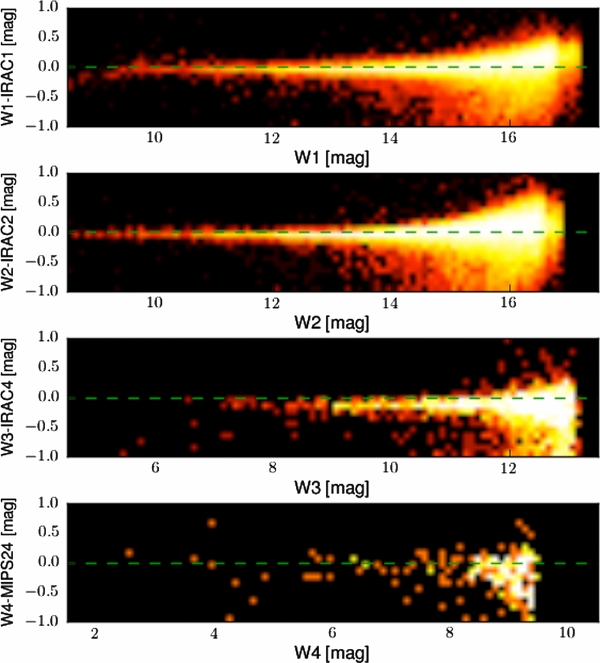
Figure 11. Direct comparison between WISE and IRAC photometry. The systematic offsets arise from the band/filter differences.
Download figure:
Standard image High-resolution image5.2. Source Counts for the Ecliptic Poles
5.2.1. Spitzer Source Counts
Differential source counts for the Spitzer surveys of the poles are presented in Figure 12. The counts correspond to the area in which full coverage across all Spitzer bands was attained, roughly 0.40 deg2 and 1.28 deg2 for the EP-N and EP-S, respectively. To improve reliability and avoid spurious detections at the faint end, only sources with at least two-band detections (S/N > 4) are counted. Additionally, the resolved planetary nebula NGC 6543 and its associated emission knots have been carefully removed from the EP-N catalog. The expected Galactic star-counts (adapted from Jarrett et al. 1994) in the L-band (3.5 μm) can be directly compared with the IRAC-1 counts. For the extragalactic contribution, we show the K-band galaxy counts from the 2MASS XSC (Jarrett 2004), extending to K = 14th mag, and the combined Glazebrook et al. (1994) and Cowie et al. (1990) counts that extend to 22nd mag. The K-band magnitude has been adjusted by 0.1 mag (fainter) to predict the L-band galaxy counts, taking into account the typical K−L colors of galaxies with a redshift that is less than one. At the bright end, the EP-N source counts are comprised of Milky Way stars and resolved galaxies, while at the faint end (IRAC-1 > 14 mag) the deep extragalactic sky dominates the counts.
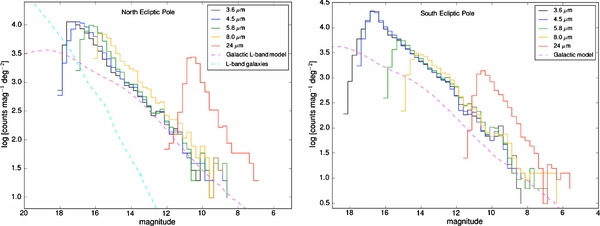
Figure 12. Spitzer source counts for EP-N (left) and EP-S (right) in which the coverage is complete for all IRAC bands and MIPS-24, corresponding to 0.40 deg2 and 1.28 deg2, respectively. The counts include both point sources and resolved galaxies. The expected Galactic star-counts, as given by the L-band (3.5 μm) counts from a Galactic star-count model (adapted from Jarrett et al. 1994), denoted with the dashed magenta line, and the K-band galaxy counts from the 2MASS XSC (Jarrett 2004) and Glazebrook et al. (1994), both color-corrected to the L-band, can be directly compared with the IRAC-1 counts (black).
Download figure:
Standard image High-resolution imageFor the EP-S, the IRAC-1 source counts are ∼3× larger than the expected Galactic counts, due to the presence of the Large Magellanic Cloud, which dominates the foreground stellar component along the direction of the EP-S.
For the Spitzer EP-N survey, the source counts turn over15 at 17.5, 17.5, 16.1, 15.9, and 10.5 mag, respectively, for IRAC-1, IRAC-2, IRAC-3, IRAC-4, and MIPS-24, equivalent to 28, 18, 42, 28, and 470 μJy. Although the total area is larger, the depth in the EP-S is somewhat shallower due to the lower coverage depth, the source counts reach a ceiling at 16.4, 16.4, 15.3, 14.5, and 10.6 mag, equivalent to 77, 50, 87, 100, and 430 μJy. As noted above, the EP-S counts are dominated by luminous, evolved stars in the LMC. In both polar fields, the IRAC-2 channel is the most sensitive window to the ecliptic poles. Due to the superior resolution and extraction depth, we will use the Spitzer source counts to estimate the extraction completeness of the WISE counts (see below).
Located just 3 deg from the EP-N is the IRAC Dark Field, used to photocalibrate Spitzer during its six year cryogenic mission. Although the total area is relatively small, co-added IRAC imaging of this Dark Field achieves an extraordinary depth that is only limited by the extragalactic confusion noise (Krick et al. 2009). In Figure 13, a comparison between the Polar survey and that of the Dark Field is presented. To the depth of the EP-N IRAC survey (28, 18, 42, and 28 μJy, respectively), the two surveys agree very well, to a level of ∼2%–4%, implying that the EP-N survey is at least 90% complete to these depths. At the bright end, the relatively small Dark Field likely suffers from small number statistics and consequently a slight deviation is seen in IRAC-2 and IRAC-3. The deep IRAC counts demonstrate the slow roll-off of sources in the EP-N survey, particularly for IRAC-3 and IRAC-4 at depths of ∼30 μJy.
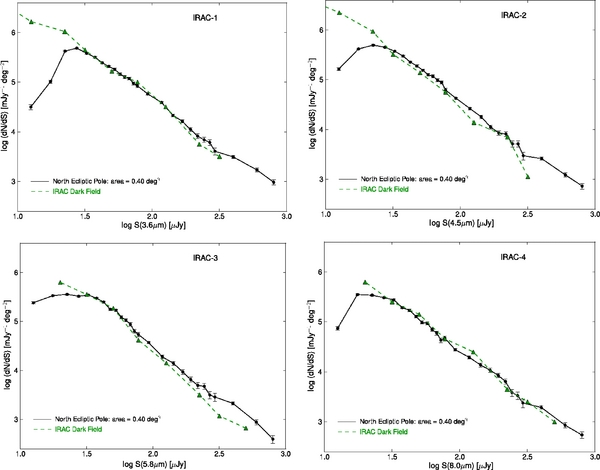
Figure 13. IRAC differential source counts for the EP-N. The error bars represent the sqrt-N Poisson statistics. For comparison, very deep counts from the IRAC Dark Field (Krick et al. 2009), located 3.1 deg from the pole, are shown in green.
Download figure:
Standard image High-resolution imageThe MIPS-24 galaxy counts are compared with those of the Spitzer Wide-area InfraRed Extragalactic (SWIRE) program (Lonsdale et al. 2003, 2004), which covered high-Galactic and ecliptic latitude fields. Following the convention of Shupe et al. (2008), the extragalactic counts are "flattened" by applying a Euclidean scaling: computing the differential counts with each source individually scaled by its flux density to the power of 2.5. For a spatially uniform distribution of sources we would expect a relatively flat trend in log–log space.
The 24 μm counts are shown in Figure 14, where the EP-N is shown in black, the EP-S in gray, and the average-combined SWIRE result in dashed gray. Stars have been removed using color constraints; as shown in the next section, stars separate from galaxies in various combinations of Spitzer colors, as follows (in mag units): [3.6] < 10.5, [3.6] − [5.8] < 0.40 and [4.5] − [8.0] < 1.0, [8.0] − [24] < 2.50 and [4.5] − [8.0] < 0.80.

Figure 14. 24 μm differential galaxy counts for both poles. The counts are Euclidean-normalized (see text for details). The error bars represent the Poisson statistics. Stars have been removed using color–color thresholding. For comparison, the dashed line shows the normalized number counts from the average of all SWIRE fields (Shupe et al. 2008).
Download figure:
Standard image High-resolution imageSuffering from small sample fluctuation, the bright end, S(24 μm) > 6 mJy, shows an excess (relative to SWIRE) that is likely due to foreground Milky Way and LMC stars that have not been removed with the color thresholding. Other than the stellar excess at the bright end, the Euclidean-normalized counts of the EP-N and that of SWIRE are flat between 1 and 6 mJy, then steeply rise at the faint end before incompleteness sets in. The rising counts were first discovered with deep ISOCAM 15 μm source counts, attributed to populations at z ∼ 0.8 (arising from the redshifted 7.7 μm PAH) and extending to z = 2 (Franceschini et al. 2001). However, the full extent of this rise in counts is not easily predicted by subsequent galaxy source count models (e.g., see Figure 6 in Shupe et al. 2008), which may indicate that an extragalactic population is significantly under-counted in the modeling. It has been hypothesized that a dust-obscured population (e.g., Type-2 AGN) has been previously undetected or at least under-counted in optically selected studies, but with deep infrared surveys, such as SWIRE and WISE, they are better revealed (Papovich et al. 2004; Shupe et al 2008).
5.2.2. WISE Source Counts
Differential source counts for the WISE survey are presented in Figure 15, and alternative versions in Figures 16 and 17. The total area used for the source counting statistics is 1.54 deg2 centered on the pole and extending 0.7 deg, largely overlapping with the Spitzer surveys. Consistent with the Spitzer count methodology, only sources with at least two-band extractions (S/N > 4) are counted, and NGC 6543 and its associated distributed emission has been removed from the EP-N catalog. For comparison, the expected Galactic star-counts (adapted from Jarrett et al. 1994) in the infrared L and M-bands (3.5 and 4.7 μm) can be directly compared with the W1 and W2 counts, while the infrared N and Q-band model counts from the SKY simulation (Cohen 1994) are compared with W3 and W4. For illustrative purposes, we also show the K-band galaxy counts from the 2MASS XSC (Jarrett 2004), Glazebrook et al. (1994) and Cowie et al. (1990) adjusted by 0.1 mag to predict the L-band galaxy counts. At the bright end, W1 brighter than 14th mag, or 0.8 mJy, the EP-N counts (Figure 16) are dominated by Galactic stars (with the brightest end comprised of disk giants), and at the faint end by unresolved galaxies, with the stellar-to-galaxy crossing point at ∼17th mag (∼50 μJy). As with the Spitzer southern survey, the WISE EP-S counts, relative to the expected Galactic star counts, have an excess due to the LMC population. For both poles at the longer wavelengths of 12 and 22 μm, the measured counts are dominated by the extragalactic sky.
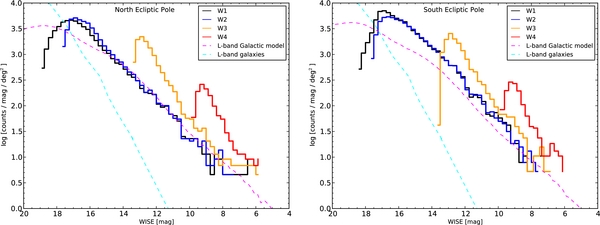
Figure 15. WISE differential source counts for both ecliptic poles. The coverage depth for any given source is about ∼200 passages by WISE.
Download figure:
Standard image High-resolution image
Figure 16. Differential source counts for the EP-N survey, comparing WISE with IRAC and MIPS-24. Also shown are the Galactic star-count model of Jarrett et al. (1994) and the SKY model of Cohen (1994). The source count excess beyond the predicted star counts is due to the extragalactic population.
Download figure:
Standard image High-resolution image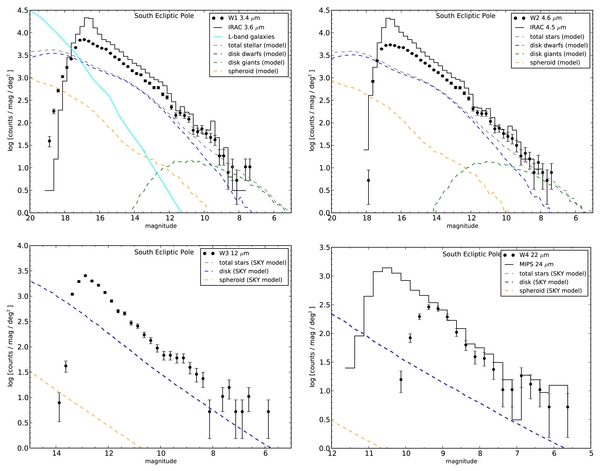
Figure 17. Differential source counts for the EP-S survey, comparing WISE with IRAC and MIPS-24. Also shown are the Galactic star-count model of Jarrett et al. (1994) and the SKY model of Cohen (1994). The source count excess beyond the predicted star counts is due to sources belonging to the Large Magellanic Cloud.
Download figure:
Standard image High-resolution imageThe EP-N counts peak at 17.2, 16.9, 13.2, and 9.5 mag, respectively, for W1, W2, W3, and W4, or equivalent to 41, 30, 166, and 1355 μJy, while the EP-S counts peak somewhat brighter at 16.8, 16.6, 13.1, and 9.4 mag, equivalent to 59, 39, 182, and 1450 μJy. The EP-S has less depth (notably in W1 and W2) due to source crowding from LMC stars; and general, compared to Spitzer detection and extraction, the large beam of WISE ultimately limits the depth for detection and extraction.
To estimate the completeness of the WISE catalogs, the deeper and better spatial resolution Spitzer data are employed by comparing the W1 and IRAC-1, W2 and IRAC-2, and W4 and MIPS-24 extractions for the respective EP data sets. The completeness is defined to be ratio of the number of matching WISE-to-Spitzer sources to the total number of Spitzer sources in a given flux bin. A match consists of a spatial association using a 2 arcsec matching radius. Since there is close correspondence between W1:IRAC-1, W2:IRAC-2 and W4:MIPS-24 photometry for S/N > 5 WISE extractions (see Figure 11), the differential completeness with relatively large 0.5 magnitude bins should be accurately tracking WISE relative to Spitzer. Since W3 does not have a close-matching Spitzer equivalent (see Figure 1), it is not as straightforward to estimate the W3 completeness; however, since W3 does not suffer from confusion or blending, it is likely that the completeness is better than 90% where the counts turn over (see W4 results, below).
The differential completeness for both poles is presented in Figure 18. It is immediately apparent that the EP-N is reaching greater depths than the EP-S, a direct outcome of the greater source density in the EP-S increasing source crowding and thereby limiting source detection/extraction. The 90% completeness limits for the EP-N are 16.3, 16.3, and 10.1 mag, respectively, for W1, W2, and W4, or equivalent to 94, 52, and 763 μJy. The EP-N counts peak at lower completeness for the short wavelength bands where confusion is at a maximum; 80%, 78%, and >95% for W1, W2, and W4, respectively. Source blending and confusion effects are the primary reason why the WISE and Spitzer source counts do not match at lower S/N; see Figures 16 and 17, notably seen in the south ecliptic pole. The 90% completeness limits for the EP-S are 14.8, 14.8, and 10.1 mag, respectively, for W1, W2, and W4, or equivalent to 370, 207, and 763 μJy. At the peak in EP-S counts, the completeness has fallen to 65%, 65%, and >95% for W1, W2, and W4, respectively. Note that the long wavelength band, W4, is not suffering from confusion or source blending relative to MIPS-24 because the band is most sensitive to the extragalactic population. Similarly, we believe the interstellar medium (ISM)-sensitive band W3 is also complete to its S/N = 5 limit.
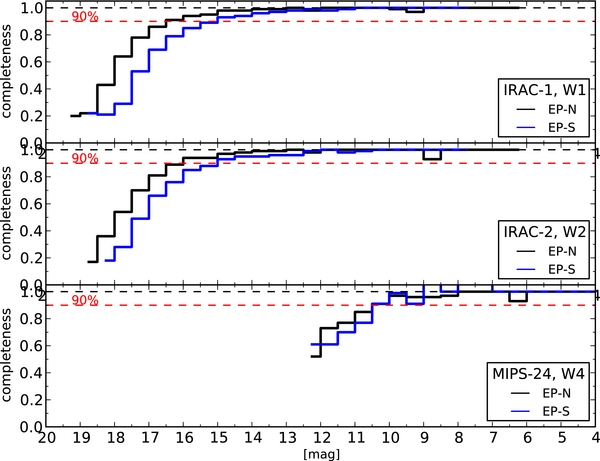
Figure 18. Completeness of WISE source extraction relative to Spitzer source extraction. The upper panel presents W1 vs. IRAC-1 completeness, the middle panel W2 vs. IRAC-2 and the bottom panel W4 vs. MIPS-24.
Download figure:
Standard image High-resolution imageWISE provides a unique opportunity to study the 12 μm extragalactic sky at high spatial resolution (compared to IRAS, for example). Using the same convention to study the 24 μm counts (Figure 14), the W3 galaxy counts have been Euclidean-normalized, presented in Figure 19. Stars have been removed using color constraints; as shown in the next section, stars separate from galaxies in various combinations of WISE colors, as follows: [3.4] < 10.5 mag, [4.6]-[12] < 1.2 mag, and [3.5]-[4.6] < 0.50 mag.
Figure 19. 12 μm differential Euclidean-normalized galaxy counts for the ecliptic poles. Foreground stars have been removed using color thresholding. For comparison, the IRAC-4 (8 μm) counts for the EP-N are shown in dashed gray. The error bars represent the Poisson statistics.
Download figure:
Standard image High-resolution imageBetween 0.3 and 3 mJy, the counts are flat, similar to that seen in the 24 μm results, and Hacking & Houck (1987) in their deep IRAS survey of the NEP, find a similar number of sources, 25 deg−2 mag−1 in their faintest flux bin, ∼10 mJy, consisting mostly of foreground stars. WISE extends considerably deeper than IRAS, yet unlike the 24 μm counts at the faint end, there is no sign of a steep rise in the counts, suggesting that the WISE 12 μm channel is not as sensitive to galaxies at higher redshift. Similarly, the shorter-wavelength IRAC-4 (8 μm) is also flat at the faint end. A more detailed analysis of WISE 12 μm counts in the NEP and in the Bootes field direction will be presented in D. Benford et al. (2011, in preparation).
5.3. Colors
In this section we present color–magnitude and color–color diagrams to facilitate separation of stellar and extragalactic populations in the polar fields. Most of the diagrams are derived from the Spitzer imaging since it has superior angular resolution (2'' versus 6''), both resolving nearby galaxies and better delineating close pairs of sources. For WISE, we show the colors derived from W3 (12 μm), the only unique channel between Spitzer and WISE (see Figure 1). In order to reduce scatter, only sources with color accuracy < 0.15 mag (S/N > 7) are displayed for both Spitzer and WISE diagrams. Note also, since the Spitzer EP-N observations are deeper than those of the EP-S, the EP-N diagrams will generally exhibit more extragalactic sources because of the lower stellar confusion in the north ecliptic pole.
5.3.1. Spitzer Colors
Color–magnitude diagrams are presented in Figure 20. Resolved galaxies (green circles) are distinguished from point sources (filled circles), as is the Seyfert galaxy NGC 6552 (blue circle) and planetary nebula AKARI 060059-663615 (magenta square). Stars generally fall near zero color and span a wide-range in flux, with luminous supergiants representing the brightest sources. In the EP-S, LMC stars comprise the bulk of the diagram, separating into evolutionary main-sequence and giant tracks. As detailed in Blum et al. (2006) and Bonanos et al. (2010) study of SAGE colors, red supergiants (RSGs) are the most luminous [3.6] sources, while blue supergiants, sgB[e], have the reddest [3.6]-[8.0] and [8.0]-[24] stellar colors. The coldest Galactic object in the field is the planetary nebula, whose dust-shell color temperature is likely to be ∼160 K based on its mid-IR colors closely matching those of PN NGC 1514 (Ressler et al. 2010).
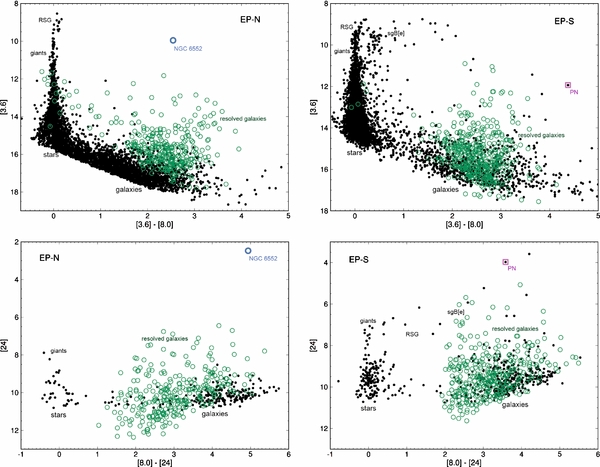
Figure 20. Spitzer mid-IR color–magnitude diagram for the EP-N (left) and EP-S (right) surveys. The filled circles are point sources, the green circles are resolved galaxies. The label "stars" refers to main-sequence giants to the giant-branch population, RSG to the red supergiant branch and sgB to the blue supergiant branch. The blue circle corresponds to NGC 6552 in the EP-N, and the magenta square is probable planetary nebula AKARI 060059-663615 in the EP-S. The maximum uncertainty is 0.15 mag (in all colors and magnitudes).
Download figure:
Standard image High-resolution imageThe faintest (and most distant) sources are extragalactic, which trend toward redder colors due to the primary contribution from stellar (evolved stars), ISM (dust re-emission arising from star formation) and AGNs. However, early-type galaxies, with their stellar-dominated emission, may have overlapping colors with foreground stars. The brightest galaxies are usually resolved by Spitzer, indicative of their relative close proximity. Most notably, NGC 6552 is the brightest source in the EP-N at long wavelengths, owing to its nearby location (z = 0.026) and steeply rising AGN-dominated continuum (Figure 5).
Photometric colors separate not only most stars from galaxies, but also AGN-dominated galaxies from normal and star-forming galaxies, as demonstrated in Figures 21 and 22. Studied in detail by Lacy et al. (2004; 2007) in Figure 21, and Stern et al. (2005) in Figure 22, the red-dashed boxes denote the regions of color–color space that AGNs—both Type-1 and Type-2—tend to occupy. This mid-IR color separation arises from the power-law, Fν ∼ ν−α, dominated emission from the central AGN compared to normal or star-forming galaxies that have a distinctive stellar Rayleigh–Jeans fall-off, followed by strong PAH emission and rising continuum due to warm dust re-emission associated with star formation. Moreover, the AGN-dominated galaxies tend to be at higher redshift (z ∼1–3) compared to field galaxies (z < 0.6; Stern et al. 2005). Note that NGC 6552, a nearby, low-luminosity Type-2 AGN, falls just blueward ([3.6]-[4.5]) of the Stern et al. (2005) box, not uncommon with obscured, low-luminosity AGNs and emission line galaxies (see also Eckart et al. 2010; Donley et al. 2008; Seymour et al. 2007); it does, however, fall within the Lacy et al. (2004) box. In Figure 22, low-redshift star-forming galaxies tend to have red [5.8]-[8.0] and blue [3.6]-[4.5] colors, occupying the lower right portion of the diagram, while ellipticals and early-type spirals migrate with redshift from the central locus to the upper-left side of the diagram (see Eckart et al. 2010).
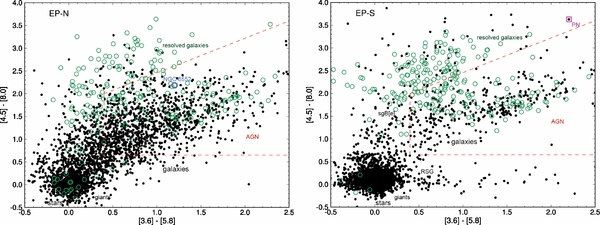
Figure 21. Spitzer IRAC color–color diagram for the EP-N (left) and EP-S (right) surveys. The red-dashed line bounded area indicates the color selection criteria for AGNs from Lacy et al. (2004; see also 2007). Symbols are defined in Figure 20.
Download figure:
Standard image High-resolution image
Figure 22. Spitzer IRAC color–color diagram for the EP-N (left) and EP-S (right) surveys. The red-dashed line bounded area indicates the color selection criteria for AGNs from Stern et al. (2005). Symbols are defined in Figure 20.
Download figure:
Standard image High-resolution imageBoth Type-1 and 2 AGNs represent a relatively large fraction of the total extragalactic population comprising the Spitzer study of the ecliptic poles. After removing foreground stars (see Section 5.3.2 below), and limiting IRAC-4 to a flux limit of 75 μJy, the ecliptic pole AGN box incorporates a source density of 318 deg−2 in the EP-N, and 230 deg−2 in the EP-S, which is comparable to the IRAC Shallow Survey density of AGNs, 275 deg−2 (Stern et al. 2005) to the same depth. The observed lower density in the EP-S is a consequence of the relatively incomplete (across the field) depth of the EP-S IRAC observations compared to the uniform EP-N and the IRAC Shallow Survey (Eisenhardt et al. 2004).
Finally, the longest wavelength colors are presented in Figures 23–25. The first two are similar to the colors that WISE produces (see below), while the last highlights the coldest colors that the Spitzer mid-IR survey provides (note however, we are not presenting any 70 or 160 μm colors). Stars tend to cluster in the lower left side of the diagram with their relatively blue (hot) colors, early-type galaxies with their luminous evolved population overlap with stars at the redder end of the stellar locus, while star-forming galaxies cluster in the upper right, fully spanning the red (cool) regions of the diagram.

Figure 23. Spitzer IRAC color–color diagram for the EP-N (left) and EP-S (right) surveys. Symbols are defined in Figure 20.
Download figure:
Standard image High-resolution image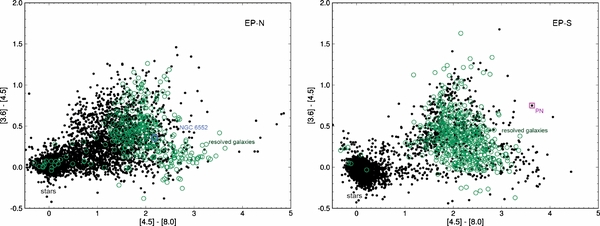
Figure 24. Spitzer IRAC color–color diagram for the EP-N (left) and EP-S (right) surveys. Symbols are defined in Figure 20.
Download figure:
Standard image High-resolution image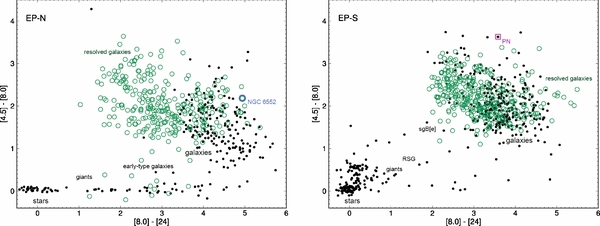
Figure 25. Spitzer IRAC+MIPS-24 color–color diagram for the EP-N (left) and EP-S (right) surveys. Symbols are defined in Figure 20.
Download figure:
Standard image High-resolution imageAn interesting feature of the EP-N diagram is the clear separation of resolved galaxies with the more distant unresolved extragalactic population, whose colors tend to be redder in [8.0]-[24] color due to enhanced mid-IR continuum arising from star formation, the presence of AGNs and emission features shifting into the long wavelength channel (e.g., the strong 11.3 μm PAH band observed in starburst galaxies shifts into the 24 μm window at z ∼ 1). This distant population is not as pronounced in the EP-S because of the shallower depth, sensitive to only lower-redshift galaxies. Moreover, the EP-S has more unresolved sources with redder [4.5]-[8.0] colors, presumably from the LMC population of supergiants, planetary nebulae (H2 and/or PAH emission dominates the broad 8 μm band) and young stellar objects (YSOs).
5.3.2. Separating Stars from Galaxies
Combining the color–magnitude and color–color diagrams for both EP surveys, stars reliably separate from galaxies using the following Spitzer IRAC/MIPS apparent brightness and color criteria:
[3.6] < 10 mag; [24] < 5 mag; [3.6]-[8.0] < 0.80 mag; [8.0]-[24] < 1.0 mag; [3.6]-[5.8] < 0.4 and [4.5]-[8.0] < 1.0 mag; [8.0]-[24] < 2.5; and [4.5]-[8.0] < 0.80 mag.
These thresholds are used to remove stars from the Spitzer catalog in order to construct the extragalactic 24 μm counts (see Figure 14).
5.3.3. WISE Colors
WISE color diagrams have interesting and subtle differences from those of Spitzer due to the W3 (12 μm) band. The W3 bandpass is sensitive to PAH (11.3 μm) emission from nearby galaxies and shorter wavelength PAH (6.2 and 7.7 μm) emission from redshifted galaxies, as well as warm continuum from AGNs at both low and high redshift (see Figure 1 (right)). Showcasing the WISE band at 12 μm, the EP survey colors (S/N > 5) are presented in Figure 26. For illustrative and interpretation purposes, the predicted WISE colors for extragalactic populations based on templates from SWIRE augmented by GRASIL models (Polletta et al. 2006, 2007; Silva et al. 1998; see also Wright et al. 2010) are depicted as follows: the shaded regions of different galaxy types denote where the synthesized photometry of redshifted sample galaxies, using simulated SEDs, drops out from the WISE detection (where we have adopted a modest WISE sky coverage of ∼12 passes). For example, Type-1 luminous QSOs occupy a region of color–color space denoted in light blue; their colors range with redshift out to z ∼ 2 where they become too faint for WISE to detect. Normal ellipticals and spirals are seen out to z ∼ 0.5, while luminous infrared galaxies (LIRGs) and low-ionization nuclear emission-line regions (LINERs) are seen to z ∼ 0.8 and Seyferts to z ∼ 1, respectively.

Figure 26. WISE color–color diagram for the ecliptic poles, EP-N on the left and EP-S on the right. The blue diamond corresponds to the nearby galaxy NGC 6552 in the EP-N, and the magenta diamond to the planetary nebula AKARI 060059-663615 in the EP-S. The background illustrates the locations of interesting classes of objects at different redshifts; stars and early-type galaxies have colors near zero, QSOs have relatively blue colors in the short bands, while ULIRGs have the reddest overall colors. WISE "AGNs" are encompassed within the dashed, gray box.
Download figure:
Standard image High-resolution imageA key feature of these color–color diagrams is that galaxies clearly separate from field stars owing to their redder colors; nonetheless, a wide variety of galaxy colors belies the rich and diverse extragalactic sky. Stars have colors near zero magnitude, trending slightly redward in [4.6]-[12] color with the more luminous, evolved populations. Early-type field galaxies occupy the "green" zone, extending toward redder colors and disks that are actively forming stars. The most extreme star-forming galaxies, LIRGs (tan/brown), starbursts (yellow) and ULIRGs (orange) are relatively rare; only a small fraction of the total are evident in the EP diagram. For the EP-S, YSOs forming in the LMC have colors that are similar to those of obscured galaxies and are likely to be confused as such. Finally, AGNs are clearly present in the WISE survey, extending from the field spirals toward redder colors in [3.4]-[4.6] due to their power-law mid-IR spectrum, occupying the QSO (blue), Seyferts (cyan), and obscured AGN (green) regions of the diagram. In the following analysis, we attempt to quantify the number of AGNs observed by WISE in the EP surveys using the model-delineated diagram, Figure 26, comparing with color–color methods developed for IRAC photometry of extragalactic fields (see Section 5.3.1).
We first define a general "AGN" region, encompassing QSOs and Seyfert galaxies. To avoid degeneracy with field galaxies that set in near the blue end of the [3.4]-[4.6] AGN color, we restrict the AGN "box" to lie above where most of the field galaxies occupy in the [3.4]-[4.6] color of Figure 26. The empirical criteria are thus defined to be (see dashed gray box Figure 26):
It is inevitable that some normal galaxies will scatter into the AGN box, and conversely some AGNs will scatter out of the box, in addition to the bluer (i.e., host-dominated) AGNs that lie outside of the defined region (e.g., NGC 6552).
The next step towards estimating the number of AGNs in the WISE EP surveys is to consider the contaminating contribution from stars, with the goal of removing as many foreground and LMC stars from the diagram and subsequent analysis as possible given the information at hand. For this task, we not only use the WISE color–mag and color–color information presented thus far, but also the color that the longest wavelength band provides: the [12]-[22] color (Figure 27), cleanly isolates the foreground stars from the extragalactic population, similar to what is observed with the IRAC-MIPS-24 colors (Figure 25). Combining the various diagrams, stars separate from galaxies with the following empirical WISE-only criteria: [3.4] < 10.5 mag, [4.6]-[12] < 1.5 and [3.4]-[4.6] < 0.4 mag. For [12]-[22] color, galaxies are redder than 1.2 magnitude and stars bluer than this limit. Galactic objects with extreme colors (e.g., blue supergiants, planetary nebulae, and YSOs) may lie outside of these limits, mixing with the extragalactic population; however, beyond the Galactic plane and the LMC (EP-S) they are relatively rare and will be statistically insignificant, as is the case for the EP-N.
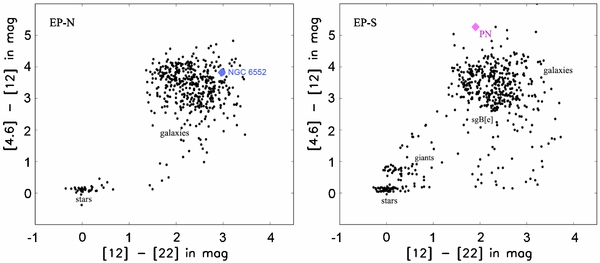
Figure 27. WISE [4.6]-[12] vs. [12]-[22] color–color diagram for the ecliptic poles, EP-N on the left and EP-S on the right. The blue diamond corresponds to the nearby galaxy NGC 6552 in the EP-N, and the magenta diamond to the planetary nebula AKARI 060059-663615 in the EP-S.
Download figure:
Standard image High-resolution imageAfter removing stars from the EP sample using these WISE color limits, the WISE AGN box now encompasses a source density of ∼260 deg−2 in the EP-N and 160 deg−2 in the EP-S down to a W3 limit of 115 μJy, which is roughly 15% of the total number of extragalactic sources, comparable to the AGN fraction seen in low luminosity systems (e.g., Goto et al. 2011). The lower fraction observed in the EP-S is likely due to confusion (and corresponding loss in completeness, see Figure 18) from the higher stellar density arising from the foreground LMC.
Mapping the AGN-selected WISE sources back to the corresponding Spitzer measurements, the resulting diagram (Figure 28) reveals where WISE-selected AGNs are located in the Spitzer color–color plot. WISE AGNs are denoted with filled, blue points: for the most part, WISE AGNs are located within the Stern et al. (2005) box, thus validating the WISE-determined AGN box. For those outside of the box, the colors tend to be slightly blue in [5.8]-[8.0] color, the region of the diagram where higher redshift early-type galaxies (which tend to have active nuclei) tend to occupy, which suggests that the Stern et al. (2005) AGN box may be expanded to a value of ∼0.4 mag in that color. A more detailed analysis of WISE colors and AGNs in the Cosmological Evolution Survey (COSMOS) field is presented in D. Stern et al. (2011, in preparation), and in L. Yan et al. (2011, in preparation) and E. Donoso et al. (2011, in preparation) who are using SDSS data to study galaxy populations.

Figure 28. Spitzer colors of WISE-selected galaxies. All stars have been removed using WISE colors. The blue points are WISE galaxies that have AGN-selected WISE colors. The green circles are galaxies resolved by IRAC. The red-dashed line bounded area indicates the color selection criteria for IRAC-selected AGNs from Stern et al. (2005).
Download figure:
Standard image High-resolution image6. SUMMARY
We have carried out a survey of the ecliptic pole regions using the full complement of Spitzer instrumentation: IRAC, MIPS and IRS, in support of the WISE mission, which recently completed its survey of the entire sky in four mid-IR bands (3.4, 4.6, 12, and 22 μm). The ecliptic poles were CVZs for WISE due to its polar-crossing orbit, making these areas ideal for both absolute and internal calibrations over the lifetime of the mission.
The Spitzer IRAC and MIPS imaging survey covers a complete area 0.40 deg2 in the north and 1.28 deg2 in the south; although the north is smaller in area, it has better sensitivity due to the 2× uniform coverage depth. For WISE, the ecliptic pole regions were covered hundreds of times, an area totaling ∼1.5 deg2, reaching photometric depths that are at the confusion limit of the short wavelength channels of WISE. The Spitzer observations were used to cross-calibrate WISE with MSX and Spitzer, as well as to study the ecliptic poles at higher angular resolution and at a greater depth of sensitivity. The rich Spitzer and WISE data sets were used to study the Galactic and extragalactic populations through source counts, color–magnitude and color–color diagrams. We summarize here the main work and results.
- 1.We present a set of standard calibration stars located in the north (EP-N) and south (EP-S) ecliptic poles that tie the WISE photometric system to that of MSX and Spitzer. To improve statistics, additional sources located just outside of the polar regions were also developed for photometric calibration, consisting of relatively bright A, F and K-MIII stars.
- 2.We developed the EP-N galaxy NGC 6552 as a standard calibrator to measure the red response of the W4 (22 μm) channel of WISE. Observations from IRAC, MIPS, IRS-LL and WISE show that the source has a strong red color in the mid-IR due to star formation and the presence of an AGN; the mid-IR emission is shown to vary at scales less than 2% over a baseline of >1 year. Finally, it is unresolved in the long-wavelength bands of WISE, MIPS-24 and IRS-LL, allowing for more precise integrated flux measurements and hence showing its suitability as a calibration standard.
- 3.We monitored the WISE optics during the first two months of the survey for the possible build up of water-ice using the LMC planetary nebula AKARI 060059-663615 in the EP-S. The source has a strong 3 μm emission band that is sensitive to absorption from water-ice in the same band, coincident with W1 (3.4 μm). At the level of ∼3% we find no change in the photometric behavior of the source over the cryogenic lifetime of the mission, concluding that the optics were free of water condensation.
- 4.The WISE instrumental zero point magnitudes are stable to better than 0.1% over the lifetime of the cryogenic mission. Relative to the Spitzer and MSX systems, the achieved photometric accuracy of the WISE calibrators is 2.4%, 2.8%, 4.5%, and 5.7% for W1 (3.4 μm), W2 (4.6 μm, W3 (12 μm), and W4 (22 μm), respectively.
- 5.Spitzer source counts of the EP-N reach a 5σ sensitivity limit of 17.5, 17.5, 16.1, 15.9, and 10.5 mag (28, 18, 42, 28, and 470 μJy), respectively, for IRAC-1 (3.6 μm), IRAC-2 (4.5 μm), IRAC-3 (5.8 μm), IRAC-4 (8 μm) and MIPS-24 (24 μm). Foreground stars dominate the bright IRAC counts up to 14th mag (0.7 mJy) in IRAC-1, with extragalactic sources comprising the bulk of fainter sources. The IRAC counts are consistent with those observed in the nearby IRAC Dark Field. Nearly all 24 μm sources are extragalactic, with the faintest extractions showing an excess, in Euclidean-normalized units, that is tracing a dust-obscured population at higher redshift, consistent with SWIRE observations of other high-Galactic latitude fields.
- 6.Spitzer source counts of the EP-S reach a 5σ sensitivity limit of 16.4, 16.4, 15.3, 14.5 and 10.6 mag (77, 50, 87, 100 and 430 μJy), respectively, for IRAC-1 (3.6 μ), IRAC-2 (4.5 μm), IRAC-3 (5.8 μm), IRAC-4 (8 μm), and MIPS-24 (24 μm). At the IRAC wavelengths, the counts are completely dominated by the presence of the LMC, exceeding the foreground Milky Way population by a factor of three. At depths fainter than 7.5 mJy, the 24 μm counts become dominated by the extragalactic population.
- 7.The WISE polar surveys reach a peak in source counts for the EP-N at: 17.2, 16.9, 13.2, and 9.5 mag (40, 30, 152, and 1310 μJy), respectively, for W1, W2, W3, and W4; and for the EP-S at: 16.8, 16.6, 13.1, and 9.4 mag (58, 39, 167, and 1440 μJy), respectively, W1, W2, W3, and W4. For these peaks, relative to Spitzer, the completeness has dropped below 80% for W1 and W2 due to source blending and confusion. The estimated 90% completeness limits for the EP-N are 16.3, 16.3 and 10.1 mag, respectively, for W1, W2, and W4, or equivalent to 94, 52, and 763 μJy; for the EP-S, the 90% completeness limits are 14.8, 14.8, and 10.1 mag, respectively, for W1, W2 and W4, or equivalent to 370, 207, and 763 μJy. In the north, stars account for sources brighter than 0.8 mJy in W1 or W2, galaxies for the fainter sources; in the south, the LMC stars dominate the counts in W1 and W2. Extragalactic sources dominate the long-wavelength WISE channels. However, unlike the 22 or 24 μm counts at the faint end, there is no sign of a steep rise in the 12 μm counts, suggesting that the W3 channel is not as sensitive to the higher redshift population of obscured galaxies.
- 8.Spitzer color–magnitude and color–color diagrams separate foreground stars from galaxies, and further separate the various extragalactic populations, including bulge-dominated spirals, normal (disk or spiral) galaxies, AGNs and star-forming galaxies. In the EP-S, evolutionary tracks for LMC sources are delineated into main-sequence, giant and supergiant tracks. The coldest (reddest) stellar objects appear to be LMC planetary nebulae. Resolved galaxies (typically only in the IRAC bands) are brighter and somewhat bluer (notably in [8.0]-[24] color) than unresolved galaxies, reflecting both k-correction (redshifted spectral features) and evolution (population) effects. In IRAC colors, AGNs cleanly separate from normal galaxies; in the EP-N, the AGN source density is found to be ∼320 deg−2 to a depth of 75 μJy in the 8 μm channel, comparable to the number density observed in the IRAC Shallow Survey.
- 9.WISE color diagrams are distinguished from those of IRAC-MIPS due to the unique W3 (12 μm) band. The wide W3 bandpass is sensitive to PAH (11 μm) emission from nearby galaxies and shorter-wavelength PAH (6.2 and 7.7 μm) from redshifted galaxies, as well as warm continuum from AGNs at both low and high redshift. We demonstrate how WISE colors separate stars, spirals, starbursts, (U)LIRGs, Seyferts and AGN, and provide a prescription for separating AGNs from stars and normal galaxies. From this, we compute an AGN source density of ∼260 deg−2 to a 12 μm depth of 115 μJy in the EP-N, representing 15% of the total extragalactic population to this depth, similar to what has been observed for low-luminosity AGNs in other fields.
We thank the SSC instrument teams for guidance in constructing AORs, and are especially grateful to B. T. Soifer for providing Directors Discretionary Time to carry out the bulk of the calibration observations with Spitzer. We thank M. Bessell for providing the optical spectra of the SEP calibrators, D. Kilkenny, R. Sefako, F. van Wyk, and D. Cooper of SAAO for securing and reducing their optical photometry. We thank L. Armus for providing Spitzer IRS spectra of ULIRGs to help disentangle spectral RSR response differences between stars and galaxies. We thank G. Sloan and the SAGE-SPEC team for providing newly reduced IRS spectra of our SEP and off-pole calibrators. We thank J. Krick for providing the IRAC Dark Field catalog. We are grateful to M. Cluver for helpful discussions and review of the manuscript. This work is based (in part) on observations made with Spitzer, which is operated by JPL, Caltech under a contract with NASA. Support for this work was provided by NASA through an award issued by JPL/Caltech. This work is also based (in part) on observations made with 2MASS, a joint collaboration between the University of Massachusetts and the Infrared Processing and Analysis Center (JPL/Caltech), with funding provided primarily by NASA and the NSF. This publication makes use of data products from the Wide-field Infrared Survey Explorer, which is a joint project of the University of California, Los Angeles, and the Jet Propulsion Laboratory/California Institute of Technology, funded by the National Aeronautics and Space Administration.
APPENDIX
This Appendix lists the WISE calibration star photometry (Tables 7 and 8), IRS spectroscopy (Figures 29 and 30), and their spectral energy distributions (Figures 31 and 32).
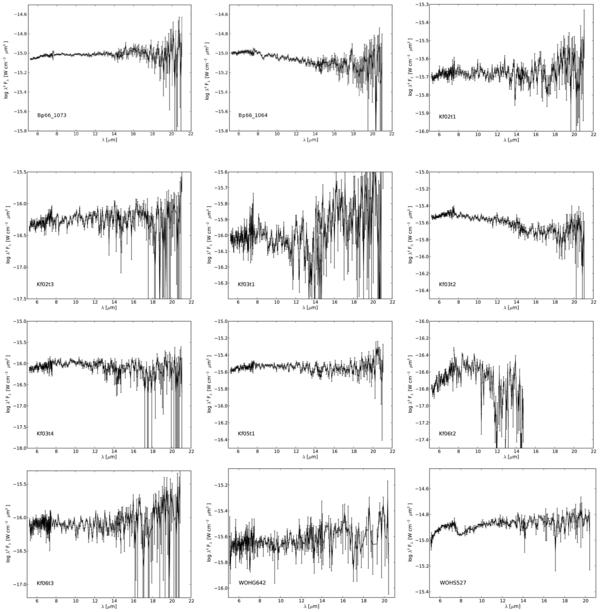
Figure 29. Spitzer IRS-SL/LL spectroscopy for the WISE calibration stars from the EP-N and the EP-S. The spectral energy is plotted as λ4Fλ to create flat profiles for sources with characteristic Rayleigh–Jeans photospheric emission.
Download figure:
Standard image High-resolution image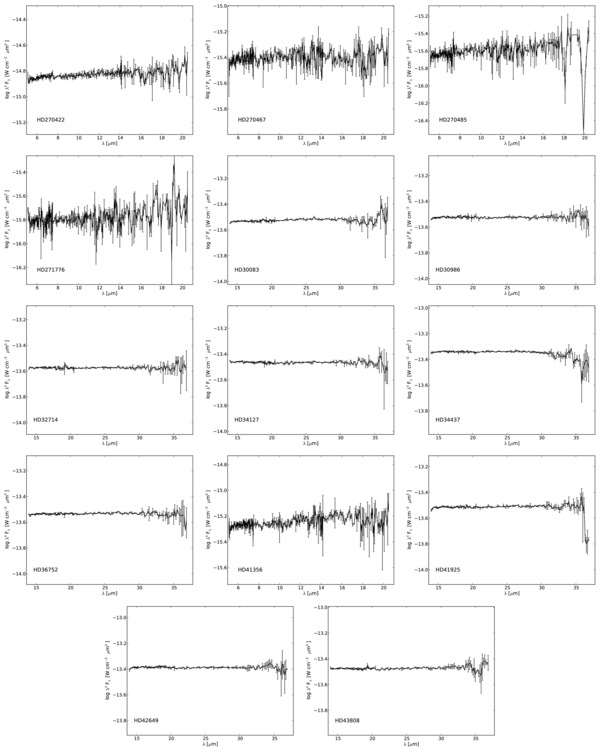
Figure 30. Spitzer IRS-SL/LL spectroscopy for the Spitzer-SAGE and WISE calibration stars from the south ecliptic polar region.
Download figure:
Standard image High-resolution image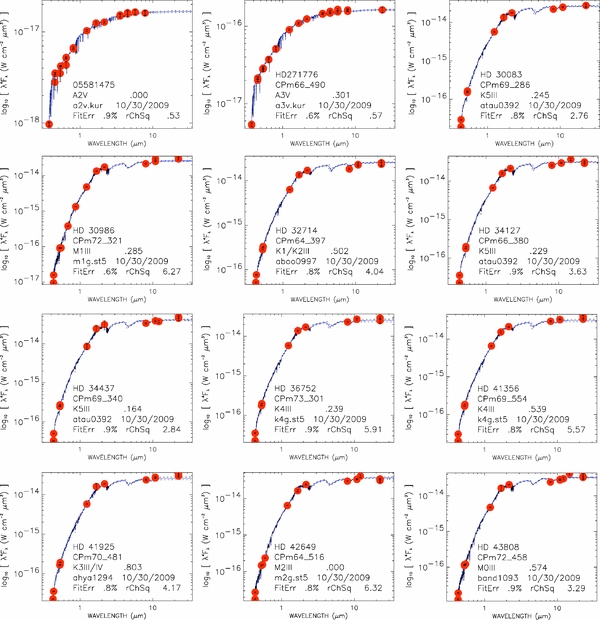
Figure 31. Spectral energy distribution (λ4Fλ) for the WISE calibration stars from both WISE CVZs. The normalizing photometric data points are shown with red circles. The blue line represents the best-fit spectral type and extinction derived from the E(B − V); the archetype unreddened template name is also specified, as is the date on which the absolute stellar spectrum was generated. The final line gives the fit error as the uncertainty in absolute scale factor of the template divided by the mean scale factor, derived from all the photometry, expressed in percent. This line also gives the reduced χ2 of the scaled template to the observed photometry.
Download figure:
Standard image High-resolution image
Figure 32. Spectral energy distribution for the WISE calibration stars from both WISE CVZs. See Figure 31 for additional SEDs and details.
Download figure:
Standard image High-resolution image
Table 7. Predicted WISE mags for NGC 6552 and AV, F, KMIII Calibrators in both Ecliptic Pole CVZs
| Name | SpT | Coordinates | Band | Pole | Mag and Unc | Fλ and Unc | Fν and Unc | %Unc |
|---|---|---|---|---|---|---|---|---|
| deg (J2000) | (W cm−2μm−1) | (mJy) | Fλ, Fν | |||||
| NGC 6552 | Sy-2 | 270.030375 +66.615083 | W4 | N | 2.709 0.017 | 4.236E−19 6.633E−21 | 6.833E+02 1.070E+01 | 5.2 |
| KF03T1 | K0III | 269.4330750 +66.4486008 | W1 | N | 9.880 0.023 | 9.136E−19 1.989E−20 | 3.458E+01 7.527E−01 | 2.18 |
| ⋅⋅⋅ | W2 | N | 9.933 0.042 | 2.568E−19 1.003E−20 | 1.826E+01 7.137E−01 | 3.91 | ||
| ⋅⋅⋅ | W3 | N | 9.860 0.016 | 7.410E−21 1.208E−22 | 3.603E+00 5.874E−02 | 1.63 | ||
| ⋅⋅⋅ | W4 | N | 9.880 0.016 | 5.686E−22 1.165E−23 | 9.343E−01 1.915E−02 | 2.05 | ||
| KF03T2 | K1.5III | 269.4644165 +66.5175171 | W1 | N | 8.865 0.021 | 2.326E−18 4.603E−20 | 8.804E+01 1.742E+00 | 1.98 |
| ⋅⋅⋅ | W2 | N | 9.008 0.024 | 6.021E−19 1.397E−20 | 4.283E+01 9.938E−01 | 2.32 | ||
| ⋅⋅⋅ | W3 | N | 8.854 0.019 | 1.871E−20 3.384E−22 | 9.098E+00 1.645E−01 | 1.81 | ||
| ⋅⋅⋅ | W4 | N | 8.836 0.018 | 1.487E−21 3.191E−23 | 2.443E+00 5.244E−02 | 2.15 | ||
| KF06T1 | K1.5III | 269.4936523 +66.8747482 | W1 | N | 10.791 0.021 | 3.947E−19 8.068E−21 | 1.494E+01 3.053E−01 | 2.04 |
| ⋅⋅⋅ | W2 | N | 10.934 0.025 | 1.021E−19 2.426E−21 | 7.266E+00 1.726E−01 | 2.38 | ||
| ⋅⋅⋅ | W3 | N | 10.781 0.018 | 3.175E−21 5.665E−23 | 1.543E+00 2.754E−02 | 1.78 | ||
| ⋅⋅⋅ | W4 | N | 10.762 0.017 | 2.522E−22 5.347E−24 | 4.144E−01 8.787E−03 | 2.12 | ||
| KF06T2 | K1.5III | 269.6583252 +66.7810669 | W1 | N | 11.061 0.021 | 3.078E−19 6.293E−21 | 1.165E+01 2.382E−01 | 2.04 |
| ⋅⋅⋅ | W2 | N | 11.200 0.025 | 8.000E−20 1.904E−21 | 5.691E+00 1.354E−01 | 2.38 | ||
| . | W3 | N | 11.048 0.018 | 2.482E−21 4.424E−23 | 1.207E+00 2.151E−02 | 1.78 | ||
| ⋅⋅⋅ | W4 | N | 11.022 0.017 | 1.985E−22 4.208E−24 | 3.262E−01 6.914E−03 | 2.12 | ||
| KF06T3 | K1III | 269.7092285 +66.8278198 | W1 | N | 10.292 0.023 | 6.250E−19 1.361E−20 | 2.365E+01 5.151E−01 | 2.18 |
| ⋅⋅⋅ | W2 | N | 10.403 0.029 | 1.667E−19 4.609E−21 | 1.185E+01 3.279E−01 | 2.77 | ||
| ⋅⋅⋅ | W3 | N | 10.279 0.019 | 5.041E−21 9.436E−23 | 2.451E+00 4.588E−02 | 1.87 | ||
| ⋅⋅⋅ | W4 | N | 10.274 0.017 | 3.955E−22 8.389E−24 | 6.500E−01 1.379E−02 | 2.12 | ||
| KF03T4 | K1III | 269.7665100 +66.5164413 | W1 | N | 9.991 0.023 | 8.249E−19 1.820E−20 | 3.122E+01 6.890E−01 | 2.21 |
| ⋅⋅⋅ | W2 | N | 10.074 0.030 | 2.257E−19 6.379E−21 | 1.605E+01 4.538E−01 | 2.83 | ||
| ⋅⋅⋅ | W3 | N | 9.961 0.019 | 6.754E−21 1.263E−22 | 3.284E+00 6.139E−02 | 1.87 | ||
| ⋅⋅⋅ | W4 | N | 9.910 0.017 | 5.530E−22 1.173E−23 | 9.086E−01 1.927E−02 | 2.12 | ||
| KF05T1 | K1III | 269.8007507 +66.6933136 | W1 | N | 8.787 0.022 | 2.500E−18 5.294E−20 | 9.461E+01 2.004E+00 | 2.12 |
| ⋅⋅⋅ | W2 | N | 8.898 0.029 | 6.666E−19 1.812E−20 | 4.742E+01 1.289E+00 | 2.72 | ||
| ⋅⋅⋅ | W3 | N | 8.773 0.020 | 2.016E−20 3.841E−22 | 9.803E+00 1.867E−01 | 1.90 | ||
| ⋅⋅⋅ | W4 | N | 8.769 0.018 | 1.582E−21 3.384E−23 | 2.600E+00 5.560E−02 | 2.14 | ||
| KF02T1 | K0III | 270.5072327 66.6275177 | W1 | N | 8.826 0.023 | 2.411E−18 5.324E−20 | 9.123E+01 2.015E+00 | 2.21 |
| ⋅⋅⋅ | W2 | N | 8.881 0.042 | 6.766E−19 2.653E−20 | 4.813E+01 1.887E+00 | 3.92 | ||
| ⋅⋅⋅ | W3 | N | 8.808 0.018 | 1.954E−20 3.484E−22 | 9.500E+00 1.694E−01 | 1.78 | ||
| ⋅⋅⋅ | W4 | N | 8.829 0.017 | 1.496E−21 3.117E−23 | 2.459E+00 5.122E−02 | 2.08 | ||
| Bp66_1073 | K1III | 270.7901001 +66.4698715 | W1 | N | 7.453 0.022 | 8.542E−18 1.775E−19 | 3.233E+02 6.718E+00 | 2.08 |
| ⋅⋅⋅ | W2 | N | 7.563 0.028 | 2.278E−18 6.122E−20 | 1.620E+02 4.355E+00 | 2.69 | ||
| ⋅⋅⋅ | W3 | N | 7.439 0.019 | 6.890E−20 1.297E−21 | 3.350E+01 6.308E−01 | 1.88 | ||
| ⋅⋅⋅ | W4 | N | 7.435 0.017 | 5.406E−21 1.129E−22 | 8.883E+00 1.855E−01 | 2.09 | ||
| KF02T3 | K0III | 270.8410645 +66.5690384 | W1 | N | 10.231 0.024 | 6.609E−19 1.479E−20 | 2.501E+01 5.598E−01 | 2.24 |
| ⋅⋅⋅ | W2 | N | 10.272 0.043 | 1.879E−19 7.502E−21 | 1.337E+01 5.336E−01 | 3.99 | ||
| ⋅⋅⋅ | W3 | N | 10.204 0.017 | 5.397E−21 9.186E−23 | 2.624E+00 4.466E−02 | 1.70 | ||
| ⋅⋅⋅ | W4 | N | 10.203 0.017 | 4.223E−22 8.896E−24 | 6.939E−01 1.462E−02 | 2.11 | ||
| HD270422 | G0V | n89.1989899 −66.6514206 | W1 | S | 7.367 0.019 | 9.241E−18 1.651E−19 | 3.497E+02 6.250E+00 | 1.79 |
| ⋅⋅⋅ | W2 | S | 7.381 0.019 | 2.694E−18 4.986E−20 | 1.916E+02 3.547E+00 | 1.85 | ||
| ⋅⋅⋅ | W3 | S | 7.302 0.019 | 7.821E−20 1.449E−21 | 3.802E+01 7.043E−01 | 1.85 | ||
| ⋅⋅⋅ | W4 | S | 7.317 0.018 | 6.022E−21 1.281E−22 | 9.895E+00 2.106E−01 | 2.13 | ||
| HD270467 | F5V | 89.5509567 −66.3399124 | W1 | S | 8.824 0.018 | 2.417E−18 4.251E−20 | 9.148E+01 1.609E+00 | 1.76 |
| ⋅⋅⋅ | W2 | S | 8.818 0.019 | 7.172E−19 1.308E−20 | 5.101E+01 9.302E−01 | 1.82 | ||
| ⋅⋅⋅ | W3 | S | 8.814 0.018 | 1.942E−20 3.505E−22 | 9.443E+00 1.704E−01 | 1.80 | ||
| ⋅⋅⋅ | W4 | S | 8.829 0.017 | 1.497E−21 3.149E−23 | 2.459E+00 5.175E−02 | 2.10 | ||
| 05581475 | A0V | 89.5615234 −66.3242569 | W1 | S | 12.114 0.020 | 1.167E−19 2.192E−21 | 4.417E+00 8.297E−02 | 1.88 |
| ⋅⋅⋅ | W2 | S | 12.113 0.020 | 3.450E−20 6.544E−22 | 2.454E+00 4.655E−02 | 1.90 | ||
| ⋅⋅⋅ | W3 | S | 12.117 0.019 | 9.271E−22 1.692E−23 | 4.507E−01 8.227E−03 | 1.83 | ||
| ⋅⋅⋅ | W4 | S | 12.150 0.019 | 7.024E−23 1.550E−24 | 1.154E−01 2.548E−03 | 2.21 | ||
| WOH_G642 | K4III | 89.8372498 -66.5321884 | W1 | S | 9.166 0.021 | 1.762E−18 3.495E−20 | 6.670E+01 1.323E+00 | 1.98 |
| ⋅⋅⋅ | W2 | S | 9.309 0.024 | 4.562E−19 1.060E−20 | 3.245E+01 7.542E−01 | 2.32 | ||
| ⋅⋅⋅ | W3 | S | 9.156 0.018 | 1.418E−20 2.507E−22 | 6.893E+00 1.219E−01 | 1.77 | ||
| ⋅⋅⋅ | W4 | S | 9.138 0.017 | 1.126E−21 2.322E−23 | 1.851E+00 3.815E−02 | 2.06 | ||
| HD41466 | F5V | 90.0775375 −66.2243423 | W1 | S | 8.359 0.018 | 3.709E−18 6.611E−20 | 1.404E+02 2.502E+00 | 1.78 |
| ⋅⋅⋅ | W2 | S | 8.358 0.019 | 1.096E−18 2.024E−20 | 7.798E+01 1.440E+00 | 1.85 | ||
| ⋅⋅⋅ | W3 | S | 8.356 0.019 | 2.962E−20 5.469E−22 | 1.440E+01 2.659E−01 | 1.85 | ||
| ⋅⋅⋅ | W4 | S | 8.374 0.018 | 2.276E−21 4.835E−23 | 3.740E+00 7.945E−02 | 2.12 | ||
| WOH_S527 | M0III | 90.2127762 −66.7443771 | W1 | S | 7.504 0.021 | 8.149E−18 1.631E−19 | 3.084E+02 6.175E+00 | 2.00 |
| ⋅⋅⋅ | W2 | S | 7.678 0.026 | 2.050E−18 5.067E−20 | 1.459E+02 3.605E+00 | 2.47 | ||
| ⋅⋅⋅ | W3 | S | 7.501 0.018 | 6.510E−20 1.156E−21 | 3.165E+01 5.621E−01 | 1.78 | ||
| ⋅⋅⋅ | W4 | S | 7.459 0.021 | 5.288E−21 1.251E−22 | 8.689E+00 2.056E−01 | 2.37 | ||
| HD270485 | F8V | 90.2214279 −66.9300232 | W1 | S | 9.243 0.018 | 1.642E−18 2.916E−20 | 6.214E+01 1.104E+00 | 1.78 |
| ⋅⋅⋅ | W2 | S | 9.239 0.019 | 4.870E−19 8.960E−21 | 3.464E+01 6.374E−01 | 1.84 | ||
| ⋅⋅⋅ | W3 | S | 9.234 0.018 | 1.319E−20 2.316E−22 | 6.412E+00 1.126E−01 | 1.76 | ||
| ⋅⋅⋅ | W4 | S | 9.252 0.017 | 1.014E−21 2.148E−23 | 1.666E+00 3.530E−02 | 2.12 | ||
| HD271776 | A5V | 90.4062119 −66.5889282 | W1 | S | 9.656 0.018 | 1.123E−18 1.979E−20 | 4.249E+01 7.491E−01 | 1.76 |
| ⋅⋅⋅ | W2 | S | 9.648 0.019 | 3.340E−19 6.103E−21 | 2.376E+01 4.341E−01 | 1.83 | ||
| ⋅⋅⋅ | W3 | S | 9.654 0.017 | 8.956E−21 1.525E−22 | 4.355E+00 7.416E−02 | 1.70 | ||
| ⋅⋅⋅ | W4 | S | 9.676 0.017 | 6.863E−22 1.446E−23 | 1.128E+00 2.376E−02 | 2.11 |
Table 8. Predicted WISE mags for AV, KMIII Calibrators in both Ecliptic Pole Regions but outside the CVZs
| Name | SpT | Coords | Band | Pole | Mag and Unc | Fλ and Unc | Fν and Unc | %Unc |
|---|---|---|---|---|---|---|---|---|
| deg (J2000) | (W cm−2μm−1) | (mJy) | Fλ, Fν | |||||
| HD009927 | K3III | 24.498152 +48.628212 | W4 | N | 0.632 0.018 | 2.869E−18 4.757E−20 | 4.628E+03 7.674E+01 | 2.00 |
| HD134493 | K0III | 227.081406 +50.054955 | W3 | N | 3.889 0.025 | 1.684E−18 3.877E−20 | 8.081E+02 1.861E+01 | 2.70 |
| ⋅⋅⋅ | W4 | N | 3.888 0.024 | 1.430E−19 3.161E−21 | 2.307E+02 5.100E+00 | 2.35 | ||
| HD154391 | K0III | 255.3205167 +60.6487542 | W4 | N | 3.910 0.028 | 1.389E−19 4.053E−21 | 2.283E+02 6.659E+00 | 2.82 |
| NPM1p72_0517 | K4.5III | 259.6922963 +72.4213361 | W4 | N | 4.885 0.028 | 5.658E−20 1.655E−21 | 9.297E+01 2.720E+00 | 2.93 |
| HD159330 | K3III | 262.6815571 +57.8768236 | W4 | N | 2.835 0.027 | 3.904E−19 1.197E−20 | 6.142E+02 1.967E+01 | 2.82 |
| NPM1p65_0480 | K4III | 265.3998008 +65.9240075 | W4 | N | 5.054 0.045 | 4.845E−20 2.102E−21 | 7.962E+01 3.453E+00 | 4.34 |
| NPM1p62_0596 | K5III | 269.1971258 +62.3487319 | W4 | N | 5.075 0.028 | 4.751E−20 1.373E−21 | 7.807E+01 2.256E+00 | 2.89 |
| HD163588 | K2III | 268.382202 +56.872643 | W4 | N | 0.958 0.019 | 2.125E−18 3.719E−20 | 3.428E+03 6.000E+01 | 2.21 |
| HD166780 | K4III | 272.1618558 +57.9796831 | W4 | N | 3.803 0.045 | 1.533E−19 6.704E−21 | 2.519E+02 1.102E+01 | 4.37 |
| HD170693 | K1.5III | 276.4964087 +65.5634806 | W4 | N | 1.945 0.025 | 8.490E−19 2.281E−20 | 1.395E+03 3.748E+01 | 2.69 |
| HD173398 | K0III | 280.2350400 +62.7494661 | W4 | N | 3.742 0.026 | 1.621E−19 4.472E−21 | 2.663E+02 7.349E+00 | 2.76 |
| HD173511 | K4III | 280.4191337 +61.5464136 | W4 | N | 3.688 0.045 | 1.704E−19 7.495E−21 | 2.800E+02 1.232E+01 | 4.40 |
| NPM1p62_0632 | K3III | 280.4682962 +62.9614500 | W4 | N | 5.003 0.026 | 5.075E−20 1.391E−21 | 8.339E+01 2.286E+00 | 2.74 |
| HD186585 | K5 | 295.1450871 +66.9393572 | W4 | N | 5.069 0.025 | 4.776E−20 1.269E−21 | 7.849E+01 2.086E+00 | 2.66 |
| HD30083 | K5III | 69.7074987 −69.4541128 | W1 | S | 4.182 0.022 | 1.737E−16 3.669E−18 | 6.575E+03 1.389E+02 | 2.11 |
| ⋅⋅⋅ | W2 | S | 4.354 0.027 | 4.380E−17 1.123E−18 | 3.116E+03 7.989E+01 | 2.56 | ||
| ⋅⋅⋅ | W3 | S | 4.178 0.020 | 1.389E−18 2.639E−20 | 6.756E+02 1.283E+01 | 1.90 | ||
| ⋅⋅⋅ | W4 | S | 4.132 0.028 | 1.133E−19 3.282E−21 | 1.861E+02 5.392E+00 | 2.90 | ||
| HD30986 | M1III | 71.34354 −72.50219 | W1 | S | 4.281 0.022 | 1.586E−16 3.320E−18 | 6.003E+03 1.256E+02 | 2.09 |
| ⋅⋅⋅ | W2 | S | 4.448 0.024 | 4.014E−17 9.192E−19 | 2.855E+03 6.539E+01 | 2.29 | ||
| ⋅⋅⋅ | W3 | S | 4.242 0.019 | 1.310E−18 2.393E−20 | 6.369E+02 1.163E+01 | 1.83 | ||
| ⋅⋅⋅ | W4 | S | 4.186 0.024 | 1.077E−19 2.829E−21 | 1.769E+02 4.649E+00 | 2.63 | ||
| HD32714 | K2III | 75.1363617 −64.3943517 | W1 | S | 4.230 0.022 | 1.663E−16 3.452E−18 | 6.293E+03 1.306E+02 | 2.08 |
| ⋅⋅⋅ | W2 | S | 4.361 0.025 | 4.351E−17 1.050E−18 | 3.095E+03 7.469E+01 | 2.41 | ||
| ⋅⋅⋅ | W3 | S | 4.212 0.020 | 1.346E−18 2.606E−20 | 6.544E+02 1.267E+01 | 1.94 | ||
| ⋅⋅⋅ | W4 | S | 4.174 0.025 | 1.089E−19 2.937E−21 | 1.789E+02 4.826E+00 | 2.70 | ||
| HD032831 | K3III | 75.653854 −35.550907 | W3 | S | 1.699 0.030 | 1.265E−17 3.497E−19 | 6.074E+03 1.678E+02 | 2.00 |
| ⋅⋅⋅ | W4 | S | 1.681 0.029 | 1.092E−18 2.916E−20 | 1.761E+03 4.705E+01 | 2.22 | ||
| HD34127 | K5III | 77.5189175 −66.4232564 | W1 | S | 4.006 0.022 | 2.042E−16 4.334E−18 | 7.729E+03 1.640E+02 | 2.12 |
| ⋅⋅⋅ | W2 | S | 4.178 0.027 | 5.147E−17 1.324E−18 | 3.661E+03 9.417E+01 | 2.57 | ||
| ⋅⋅⋅ | W3 | S | 4.002 0.020 | 1.633E−18 3.120E−20 | 7.939E+02 1.517E+01 | 1.91 | ||
| ⋅⋅⋅ | W4 | S | 3.957 0.028 | 1.330E−19 3.865E−21 | 2.186E+02 6.350E+00 | 2.90 | ||
| HD34437 | K5III | 77.8674338 −69.5460897 | W1 | S | 3.713 0.022 | 2.675E−16 5.669E−18 | 1.012E+04 2.146E+02 | 2.12 |
| ⋅⋅⋅ | W2 | S | 3.887 0.027 | 6.733E−17 1.729E−18 | 4.790E+03 1.230E+02 | 2.57 | ||
| ⋅⋅⋅ | W3 | S | 3.710 0.020 | 2.138E−18 4.078E−20 | 1.039E+03 1.983E+01 | 1.91 | ||
| ⋅⋅⋅ | W4 | S | 3.667 0.028 | 1.737E−19 5.043E−21 | 2.854E+02 8.287E+00 | 2.90 | ||
| HD36752 | K4III | 81.6714017 −72.9492067 | W1 | S | 4.219 0.022 | 1.679E−16 3.554E−18 | 6.354E+03 1.345E+02 | 2.12 |
| ⋅⋅⋅ | W2 | S | 4.368 0.029 | 4.323E−17 1.176E−18 | 3.075E+03 8.366E+01 | 2.72 | ||
| ⋅⋅⋅ | W3 | S | 4.228 0.026 | 1.327E−18 3.275E−20 | 6.451E+02 1.592E+01 | 2.47 | ||
| ⋅⋅⋅ | W4 | S | 4.195 0.045 | 1.069E−19 4.662E−21 | 1.756E+02 7.660E+00 | 4.36 | ||
| HD41356 | K4III | 89.6321758 −69.8565736 | W1 | S | 3.999 0.022 | 2.057E−16 4.328E−18 | 7.784E+03 1.638E+02 | 2.10 |
| ⋅⋅⋅ | W2 | S | 4.140 0.029 | 5.331E−17 1.449E−18 | 3.792E+03 1.031E+02 | 2.72 | ||
| ⋅⋅⋅ | W3 | S | 4.003 0.026 | 1.632E−18 4.003E−20 | 7.934E+02 1.946E+01 | 2.45 | ||
| ⋅⋅⋅ | W4 | S | 3.958 0.045 | 1.329E−19 5.789E−21 | 2.183E+02 9.513E+00 | 4.36 | ||
| HD41371 | K0III | 090.0321179 −64.3100100 | W3 | S | 4.705 0.021 | 7.938E−19 1.536E−20 | 3.810E+02 7.371E+00 | 2.42 |
| ⋅⋅⋅ | W4 | S | 4.687 0.024 | 6.787E−20 1.720E−21 | 1.115E+02 2.827E+00 | 2.61 | ||
| HD41925 | K3III | 090.4346025 −70.1138550 | W1 | S | 4.210 0.021 | 1.693E−16 3.397E−18 | 6.409E+03 1.286E+02 | 2.01 |
| ⋅⋅⋅ | W2 | S | 4.331 0.032 | 4.474E−17 1.346E−18 | 3.183E+03 9.571E+01 | 3.01 | ||
| ⋅⋅⋅ | W3 | S | 4.220 0.020 | 1.337E−18 2.573E−20 | 6.500E+02 1.251E+01 | 1.92 | ||
| ⋅⋅⋅ | W4 | S | 4.177 0.025 | 1.086E−19 2.955E−21 | 1.785E+02 4.855E+00 | 2.72 | ||
| HD42701 | K3III | 091.7106121 −67.2833372 | W3 | S | 3.503 0.031 | 2.402E−18 6.858E−20 | 1.153E+03 3.292E+01 | 2.03 |
| ⋅⋅⋅ | W4 | S | 3.475 0.025 | 2.074E−19 6.581E−21 | 3.406E+02 1.081E+01 | 2.71 | ||
| HD42649 | M2III | 91.7973483 −64.3883669 | W1 | S | 3.876 0.023 | 2.302E−16 4.958E−18 | 8.714E+03 1.877E+02 | 2.15 |
| ⋅⋅⋅ | W2 | S | 4.036 0.034 | 5.867E−17 1.855E−18 | 4.173E+03 1.320E+02 | 3.16 | ||
| ⋅⋅⋅ | W3 | S | 3.839 0.021 | 1.897E−18 3.845E−20 | 9.224E+02 1.869E+01 | 2.03 | ||
| ⋅⋅⋅ | W4 | S | 3.794 0.026 | 1.546E−19 4.235E−21 | 2.540E+02 6.959E+00 | 2.74 | ||
| HD43808 | M0III | 92.8077154 −72.1654233 | W1 | S | 4.044 0.022 | 1.973E−16 4.190E−18 | 7.467E+03 1.586E+02 | 2.12 |
| ⋅⋅⋅ | W2 | S | 4.164 0.024 | 5.216E−17 1.183E−18 | 3.710E+03 8.414E+01 | 2.27 | ||
| ⋅⋅⋅ | W3 | S | 3.979 0.020 | 1.669E−18 3.187E−20 | 8.115E+02 1.550E+01 | 1.91 | ||
| ⋅⋅⋅ | W4 | S | 3.924 0.025 | 1.371E−19 3.659E−21 | 2.253E+02 6.013E+00 | 2.67 | ||
| HD53501 | K3III | 104.9605671 −67.9164428 | W3 | S | 1.952 0.028 | 1.002E−17 2.585E−19 | 4.811E+03 1.241E+02 | 3.11 |
| ⋅⋅⋅ | W4 | S | 1.925 0.025 | 0.860E−18 2.922E−20 | 1.420E+03 4.801E+01 | 2.70 | ||
| HD071878 | K2III | 126.434158 −66.136887 | W4 | S | 1.106 0.190 | 1.854E−18 3.245E−19 | 2.991E+03 5.235E+02 | 1.95 |
| HD097576 | K7III | 168.311172 −44.372215 | W4 | S | 1.480 0.031 | 1.314E−18 3.751E−20 | 2.120E+03 6.052E+01 | 2.21 |
| HD103596 | K5III | 178.917221 −28.477104 | W4 | S | 2.233 0.026 | 6.566E−19 1.573E−20 | 1.059E+03 2.537E+01 | 2.66 |
Notes. NPM1p72_0517 is a high proper motion star: 0.70 −2.40 mas yr−1. HD53501 is a high proper motion star: −27.0 234.2 mas yr−1. MIPS-24 observations (Engelbracht et al. 2007) of W4 calibrators were used to refine the SED templates.
Download table as: ASCIITypeset image
Footnotes
- 11
WISE Explanatory Supplement: http://wise2.ipac.caltech.edu/docs/release/prelim/expsup/wise_prelrel_toc.html
- 12
The field coverage depends on the ecliptic latitude; e.g., at the equator, the coverage is ∼10–11; β = 20 deg, coverage = 12–13; β = 45 deg, coverage = 15–16; β = 60 deg, coverage = 20.
- 13
See Section 4.11 of the IRAC Handbook; http://ssc.spitzer.caltech.edu/irac/iracinstrumenthandbook/
- 14
WISE single-exposure frames and multi-frame mosaics already account for exposure time and coverage depth, respectively. The pixel value units are in DN (data numbers), and the conversion to calibrated magnitude units is mag0 − 2.5 log10(flux[DN]), where mag0 is the zero point magnitude, specified in the image FITS header. More information is given in Cutri et al. (2011).
- 15
An excess in source counts is expected in the faintest flux bins due to Eddington bias. Eddington bias arises from statistical fluctuations in the source counts. As the counts rise at the faint end, more sources statistically scatter from the faint to the relatively brighter flux bins, creating an excess in counts at the faintest flux levels.