


ABSTRACT
In this paper, we describe a theoretical model for accelerating an arbitrary upstream particle distribution. Only those particles that exceed a prescribed injection energy, Einj, are accelerated via the diffusive shock acceleration (DSA) mechanism, also known as first-order Fermi acceleration. We identify a set of quasi-parallel shocks at 1 AU and use the observed solar wind particle distribution information to construct our upstream distribution, which is then accelerated diffusively at the shock, assuming the observed shock parameters. The injection energy for particles to be accelerated diffusively at a quasi-parallel shock is discussed theoretically. By using the observed upstream solar wind distribution function and the observed shock parameters, we can compute the injection energy that matches the observed downstream accelerated particle spectrum. Like the previous studies of van Nes et al., Lario et al., and Ho et al., this analysis focuses on the acceleration of protons only via the first-order Fermi acceleration mechanism. However, our primary focus is on quasi-parallel shocks and the injection mechanism in the context of DSA with a background thermal solar wind modeled as a Maxwellian or kappa distribution. Our approach allows for a direct test of injection at interplanetary shocks. It has been proposed that an additional seed population of energetic particles is needed to explain the accelerated particle distribution downstream of quasi-parallel shocks. This conclusion is based typically on studies that address the acceleration of heavy ions primarily and do not characterize the injection of protons alone using the DSA mechanism. Through comparisons of Maxwellian and kappa upstream distributions, we find that DSA with injection directly from a thermal Maxwellian distribution, or weak departures therefrom, for protons is responsible for energetic solar particle events associated with quasi-parallel shocks.
Export citation and abstract BibTeX RIS
1. INTRODUCTION
Although diffusive shock acceleration (DSA) is now regarded as the mechanism responsible for the observed cosmic ray (CR) spectrum up to at least the "knee" (∼1014 eV nuc−1), the corresponding mechanism is not as widely accepted in the solar energetic particle (SEP) community (Ho et al. 2008). In part, this perspective has resulted from two factors. First, simple power-law distributions downstream of interplanetary or coronal mass ejection driven shocks are not always seen (Desai et al. 2006) and the spectra can resemble double power laws or have pronounced exponential-like rollovers. The observed spectral slopes are not always consistent with spectral slopes predicted by the application of the theory to the locally observed shock wave (e.g., van Nes et al. 1984). Second, observations have not clarified the nature of particle "injection" into the DSA mechanism and theory has not addressed this question adequately.
This has led to two viewpoints. In one, particles are thought to be accelerated out of the "thermal pool" in the ordinary solar wind as a shock propagates away from the Sun. In the other, energetic "seed particles" created independently by a distinct unspecified mechanism are preferentially accelerated by a propagating shock wave.
The question of complex SEP spectra has been addressed in considerable detail by Zank et al. (2000), Rice et al. (2003), Li et al. (2003), Zank et al. (2007), Vainio (2003), and Ng et al. (2003). The authors recognized the importance of modeling particle acceleration at shocks in the solar wind dynamically, taking into account the varying shock speed, decreasing interplanetary magnetic field strength, and the spatially varying diffusion coefficients (and hence acceleration timescale). The time-dependent models have been tested against multiple observations (Verkhoglyadova et al. 2009, 2010; Zank et al. 2007) and some of the model predictions related to the acceleration of particles to the highest energies very close to the Sun have been verified (Reames 2009). In summary, time-dependent diffusive shock acceleration at a dynamically evolving interplanetary shock wave typically produces spectra that are more complicated than simple power laws. Instead, the spectra frequently resemble double power laws or power laws with exponential rollover (Verkhoglyadova et al. 2009, 2010; van Nes et al. 1984).
The question of particle injection into the DSA mechanism has been contentious. As discussed in Zank et al. (2006), we need to distinguish between the injection problem at quasi-parallel and quasi-perpendicular shocks. We shall focus here on quasi-parallel shocks only. Our reason for focusing on quasi-parallel shocks stems from the apparent simplicity of the injection mechanism and the basic simplicity of the DSA process. By contrast, at a quasi-perpendicular shock, the complexity of the perpendicular spatial diffusion coefficient enters (Zank et al. 2006) and the injection process may well be related to the shock dissipation mechanism. At a quasi-parallel shock, for a particle to be accelerated diffusively, it must have sufficient energy to propagate up and downstream multiple times. The particles are assumed to experience pitch-angle scattering which tends to isotropize the energetic particle distribution function. The turbulent fluctuations in the magnetic field, especially upstream, are the result of an anisotropy in the upstream particle distribution function (Bell 1978a, 1978b; Zank et al. 2000; Rice et al. 2003; Gordon et al. 1999; Lee 1983). Consequently, for a particle to diffuse or propagate from downstream of the shock into the upstream region, the particle should have an energy that is at least comparable to the upstream flow speed, u1. For this reason, Lee (1983) and le Roux & Webb (2009) introduced

where u is the upstream plasma flow speed and θBn is the angle of the magnetic field to the shock normal, and the injection threshold at a quasi-parallel shock is defined as v < u1, where v is the particle velocity. This is similar to the injection criterion introduced by Zank et al. (2000), who assumed that the injection energy is determined by the thermal energy downstream of the shock (with an injection efficiency of 1%).
In contrast to the above discussion, in order to apply the CR transport equation to DSA, it is required that the particle anisotropy be small at the shock. Following Zank et al. (2006; see also Giacalone & Jokipii 1999; Zank et al. 2004), if |F| is the streaming flux, then the total anisotropy is defined by ζ = 3|F|/(4πJ), where J = fp2 is the differential intensity, f is the distribution function, and p is momentum. It can then be shown that
where the Bohm diffusive coefficient κBohm = rLv/3 and rL is the Larmour radius. For ζ ≪ 1, i.e., to ensure the validity of the diffusive approximation at a quasi-parallel shock, we essentially require u ≪ v up to a factor ∼3(q/r − 1), where u is the plasma flow, v is the particle velocity, r is the shock compression ratio, and q = 3r/(r − 1) is the power-law index of the accelerated spectrum. As illustrated in Figure 5 of Zank et al. (2006), for an interplanetary shock at 1 AU, this condition suggests that particles with energies exceeding approximately 1 keV are capable of experiencing DSA at quasi-parallel shocks. van Nes et al. (1984) and subsequent studies (e.g., Lario et al. 2004; Ho et al. 2005) attempted to relate observed shocks of varying obliquity to the particle spectra expected from DSA theory. The predicted and observed spectra were compared, as were relations with such quantities as the shock obliquity. For the reasons indicated above and articulated in more detail in Zank et al. (2006), fundamental differences exist between DSA at quasi-parallel and quasi-perpendicular shocks, especially in terms of particle injection mechanisms. Unlike previous studies (van Nes et al. 1984; Lario et al. 2004; Ho et al. 2005), we focus exclusively on highly parallel shocks and directly test the possibility that particles from the tail of the background thermal solar wind Maxwellian (or weak kappa distribution function) are injected into the DSA mechanism.
In this paper, we develop briefly the theory for accelerating an arbitrary upstream particle distribution (in practice, we assume either a Maxwellian or a kappa distribution for the solar wind) and accelerate diffusively only those particles that exceed a prescribed threshold energy. Using this theoretical model, we then identify a set of quasi-parallel interplanetary shocks at 1 AU and use the observed solar wind proton distribution function as the input distribution to our shock acceleration calculation. We then compute the expected energetic particle power law, and by comparing the amplitude/intensity of our calculated energetic particle spectrum against that observed, we can determine the necessary injection threshold. This allows for a direct test of the injection theory.
2. THEORY AND BACKGROUND
Observations that can be related to the injection problem have followed essentially two routes. An important early paper by Gosling et al. (1981) advocated that the energetic particle population emerged from the solar wind thermal pool. Meanwhile, based on an energetic storm particle (ESP) event on 1978 August 27 detected at the International Sun-Earth Explorer 2 and 3 spacecraft, Gosling et al. (1981) showed that the energetic particles up to approximately 1.6 MeV emerged from the solar wind thermal pool. Their results are consistent with particles from the thermal pool or the suprathermal tail of the solar wind being accelerated by DSA. An alternate view was advocated initially by Mason (2000) and Desai et al. (2003) based on observations of energetic particles at corotating interaction regions (CIR) which suggested that they did not come from the bulk solar wind. Based on particle abundances, such as 3He, they found that particles originating, for example, in solar flares, pickup ions, or inner source neutrals were preferentially accelerated in CIRs. The manner by which these suprathermal particles are pre-energized was not addressed, nor was the precise mechanism of acceleration within the CIRs themselves. Desai et al. (2003) conclude that due to the presence of large amounts of 3He particles in the accelerated spectrum, the suprathermal pool is the source of the accelerated distribution.
We will compare DSA theory to observations at 1 AU using a set of quasi-parallel shocks that we have identified. We adopt the one-dimensional (1D) model equations to describe the accelerated downstream particles, i.e., we assume that the shock is an infinite plane that separates the upstream and downstream particle distributions (Krymsky et al. 1977; Axford et al. 1977; Bell 1978a, 1978b; Blandford et al. 1978; Zank 2013). Such an approximation at an interplanetary shock is reasonable to determine the local particle distribution function. The effects of large-scale curvature and geometry far exceed the scale size of, for example, Earth's bow shock where geometric effects can play a role in determining the characteristics of the accelerated spectrum and the injection problem.
We compare the particle distributions from the Low-Energy Magnetic Spectrometer (LEMS30) and LEMS120 detectors in the Electron, Proton, and Alpha Monitor (EPAM) suite of instruments onboard the Advanced Composition Explorer (ACE). By doing so, we can determine whether the plasma environment in those energy ranges of EPAM corresponds to an isotropic distribution. When the particle distributions for LEMS30 and LEMS120 were compared for all dates and energy channels, there were only two or three instances that were found to be highly anisotropic. The observations for the remaining occurrences showed that the particles were very well described by an isotropic distribution. To further examine the particle distributions from LEMS30, we transformed the distribution to the solar wind frame, finding that it remains isotropic. The significance of the Compton–Getting effect for the energy ranges in this study was also investigated. Haggerty et al. (2006) performed a study comparing LEMS30 and LEMS120 data and determined that the Compton–Getting effect was of second order (Haggerty et al. 2006; van Nes et al. 1984). Because our study does not require detailed angular information, we do not therefore include this effect in our study. Since the observed energetic particle distribution is isotropic, we may apply the 1D transport equation to model the particle distribution function, i.e.,
where U denotes flow velocity, κ is the diffusion coefficient, and i = 1, 2 identifies upstream or downstream of the shock. This equation is solved while satisfying the boundary conditions that the particle number density is conserved across the shock and that the energetic particles satisfy the streaming condition at the shock,
where p is the momentum,  is the vector normal to the shock, and Q(p) is the particle injection rate at the shock, i.e., Q(p) particles per unit momentum per cm2 s. Use of the spatial dependence of the accelerated particle spectrum allows us to rearrange Equation (4) as
where f(− ∞, p) is the background particle distribution.
The downstream accelerated distribution, f(0, p), is given by
where u1 and u2 are the velocities upstream and downstream of the shock, pinj is the injection momentum below which we do not expect any particles to be accelerated, f(− ∞, p') is the particle distribution function far upstream of the shock, and q = 3r/(r − 1) is the spectral exponent of the accelerated power-law spectrum. The shock compression ratio, r, is equal to n2/n1, where n is the plasma density and the subscripts 1 and 2 denote upstream and downstream quantities, respectively. All other quantities are as defined above.
Several points about the downstream distribution function f(0, p), expressed through Equation (6), are worth drawing attention to. The boundary condition, Equation (5), shows that two sources of particles can be accelerated diffusively at a shock. The first is simply a background population f(− ∞, p) that is convected into the shock from upstream and the second, discussed further below, are particles injected locally at or near the shock as a result of some form of shock injection mechanism. Both possibilities can of course occur simultaneously and which is more effective depends on the relative flux and energies of the injected distribution. One implication, for example, is that the injection of solar wind alpha particles might be quite different from the injection of 3He in the diffusive acceleration of particles at a particular shock. More generally, it is entirely possible that pre-energized heavy ions are injected into the DSA process in a manner entirely different from diffusively accelerated protons.1 The shock accelerated particle spectrum, p−q, is itself generated from the spectra of sources at lower momentum p' < p. For source spectra steeper than p−q, the accelerated spectrum will tend toward a p−q spectrum (Bell 1978a, 1978b; Axford 1981). However, an initially harder injection spectrum will retain its initial spectral exponent and not acquire the characteristic spectral index associated with the local shock. Consequently, the energetic particle spectrum that is observed downstream of a shock can bear the imprint of the source spectrum rather than that of the locally accelerated spectrum. As before, this can render the interpretation of heavy-ion spectra observed downstream of a shock difficult because the pre-energized heavy-ion spectra may be harder/flatter than that characteristic of the shock itself. Consequently, the difficulties with using heavy ions exclusively to inquire into the characteristics of the injection problem are as follows.
- 1.The turbulence field at quasi-parallel shocks that determines the diffusion coefficient is due to the injection and acceleration of the more populous proton population. As illustrated by Equation (2), the diffusion coefficient is an important factor in the injection problem at oblique shocks.
- 2.Different ion species can be injected differently according to Equation (6), depending on the relative importance of the convected background flux or a specific injection mechanism.
- 3.The observed ion spectrum downstream of a shock may or may not depend entirely on the nature of the source spectrum, particularly if the source spectrum results from another acceleration mechanism (or even another preceding shock) that produces a comparatively hard spectrum.
The difficulties in deconvolving observed heavy-ion spectra downstream of shocks to address the injection problem in DSA have led us to adopt a different approach to the challenge based on observations made by the ACE and Wind spacecraft.
The second term in the integral of Equation (6) corresponds to a locally injected population of particles. This is typically modeled as a delta function in momentum (e.g., Zank et al. 2000 and references therein). The delta function approach assumes essentially that, as a result of some undefined physical processes at the shock itself, a delta function distribution of particles is created, which is sufficiently energetic to be accelerated. Some theoretical models exist that try to identify such a physical mechanism. One mechanism at quasi-perpendicular shocks is the repeated reflection of ions at the cross-shock electrostatic potential (Zank et al. 1996, 2010; Lee et al. 1996). At a parallel shock, some particles may be energized similarly by reflection at the cross-shock potential, leading to the formation of a diffuse upstream beam (Gosling et al. 1980; Rice et al. 2000; Zank et al. 2001). Upstream leakage of particles (Malkov 1998) may also provide an injection source. None of these mechanisms produce a completely monoenergetic particle distribution function but it is a useful simplification. None of these mechanisms for quasi-parallel shocks are yet commonly accepted as the injection mechanism for DSA.
Somewhat surprisingly, the first term in the brackets within the integral of Equation (6) has not been considered as carefully in the context of injection as one might expect. In this study, we neglect the injection distribution term Q(p') in favor of the background distribution function f(− ∞, p') to try to determine whether a thermal solar wind distribution (a Maxwellian or kappa distribution function) has a sufficient number of particles in the tail to explain the observed accelerated population for a large fraction of observed quasi-parallel shocks. As will be shown below, we find that an upstream Maxwellian or a kappa distribution that departs weakly from a Maxwellian (κ = 10) does indeed have a sufficient number of particles in the tail of the distribution to account for the observed accelerated power-law distribution for all 13 of the quasi-parallel shocks in this study.
Initially, we use a Maxwellian as the upstream background population. Assuming no injection population of accelerated particles and an upstream distribution in the form of a Maxwellian, Equation (6) takes the form
where n is the upstream particle number density, m is the mass of an ion, κβ is Boltzmann's constant, T is the kinetic temperature of the distribution, and pinj is the injection momentum. Although Equation (7) is expressed in terms of momentum space, we present our results in terms of energy and continue to refer to the injection energy.
For our initial application, we assume an injection energy of 1 keV for all cases. The choice of 1 keV is motivated by the need to ensure that the particle velocity is sufficiently great that it can propagate back upstream against the supersonic flow of the solar wind (Zank et al. 2000; Lee 1983; le Roux & Webb 2009). A particle with a thermal speed of ∼400 km s−1 corresponds to an energy of 1 keV. Therefore, choosing 1 keV as an initial injection energy is a reasonable first assumption. The upstream Maxwellian particle distributions were constructed using candidate density, velocity, and temperature values to simulate particle distributions found in the typical solar wind at 1 AU. We use initial values of n = 8.7 cm−3, u = 471 × 105 cm s−1, and T = 1.137 × 10⁵ K to construct the upstream Maxwellian and kappa particle distributions used in Figure 1. From Figure 1, the core or thermal part of the distribution is centered around the peak of the Maxwellian, which is essentially the solar wind speed (∼1 keV). The accelerated suprathermal tail is at energies ∼10 keV and greater, which is essentially beyond the Maxwellian tail. The injection energies predicted theoretically for quasi-parallel shocks are a little greater than those associated with the upstream bulk velocity, i.e., ∝u21, which means that particles close to the thermal core should be accelerated. Figure 1 illustrates the accelerated downstream spectrum obtained from Equation (7) using upstream background populations modeled as Maxwellian and kappa distributions and a range of injection energies: 1.0, 1.5, and 3.0 keV. The left-hand column shows a constructed Maxwellian with a shock compression ratio of four (top panel) and two (bottom panel). The right-hand column shows our constructed upstream kappa distribution, with κ = 2 using the same input parameters as the Maxwellian and again r = 4 (top panel) and r = 2 (bottom panel). The shaded regions for all four plots identify those particles in the respective distributions with energies greater than the injection energy. These are the particles that are accelerated.

Figure 1. Constructed upstream Maxwellian distribution (left column) and kappa distribution (κ = 2, right column) and associated accelerated distributions for injection energies of 1 keV (·), 1.5 keV (-), and 3 keV (-·-) using Equation (7) and a correspondingly modified equation for the kappa distribution. For shocks with compression ratio r = 4, we obtain a spectral index q = 4, and for r = 2, q = 6.
Download figure:
Standard image High-resolution image3. COMPARISON WITH OBSERVATIONS
In this section, we use observations from the ACE spacecraft to construct a realistic upstream Maxwellian representative of the core solar wind and accelerate these particles above a given injection energy using Equation (7). We iterate the choice of injection energy until the model results are consistent with energetic particle observations from the ACE (Section 3.1) and Wind (Section 3.2) spacecraft. This process is done manually, meaning that the identified injection energy is somewhat subjective. However, the error estimated for this process is ∼10%, with a lower uncertainty for smaller injection energies. The level of uncertainty is based on our experience in choosing injection energies for the many cases that we considered and finding that we have at most a 10% latitude in our choice of injection energy based on the subsequent fit to the observed power law. We have not made any corrections for possible contamination of the observed distribution by alpha particles or heavy ions and assume all particles are protons. This is possibly an oversimplification, as we are aware of He++ ions in the Solar Wind Electron, Proton, and Alpha Monitor (SWEPAM) data. However, the He++ component of the bi-Maxwellian distribution is comparatively small
compared to the proton component, as He++/H+ ∼0.02–0.04, making their neglect reasonable. Additionally, we compute the spectral index and intensity, and compare to the power-law fit of the observed accelerated ions. The upstream distributions used in the study are constructed by assuming that a Maxwellian or κ-distribution is the appropriate upstream distribution and using the averaged observed upstream data obtained by ACE. Additionally, the shock obliquity and shock compression ratio (and hence spectral index) are quantities that are taken from the ACE shock database. However, we need to be very careful in using data that is derived over very short intervals of time, i.e., over a time interval that corresponds to the passage of the shock past the spacecraft. Recall that the timescale for DSA is determined by the diffusive timescale which is essentially the ratio of the diffusion coefficient and the large-scale flow speed, κ/USW. For any reasonable choice of parameters, this timescale far exceeds the timescales on which the spacecraft is observing variations in the shock compression ratio or the shock obliquity or other parameters. One cannot therefore simply relate the observed shock parameters to the observed accelerated energetic particle spectrum, as is often done, but instead, one should in principle average the plasma and magnetic field quantities associated with the interplanetary shock over the corresponding diffusion timescale. Of course, this cannot be done in practice and we and many other authors assume the observed plasma parameters represent a proxy to the properly averaged shock conditions that are responsible for the observed accelerated particle spectrum. In view of this, error associated with the observed shock parameters cannot sensibly be propagated to error in terms of the DSA process. Accordingly, we do not assign an error to these quantities as they are used as a proxy for the averaged quantities that would ideally be used in our study. Input parameters for the study are given in Table 1 and the results are summarized in Table 2.
Table 1. Summary of Input Parameters Used to Calculate Upstream Maxwellian and Kappa Thermal Particle Distributions
| Date of Shock | n1(cm−3) | T1(°K) | u1(cm s−1) |
|---|---|---|---|
| 1998 Jun 13 | 5.051 | 3.45 × 10⁴ | 380 × 105 |
| 1999 May 5 | 4.899 | 3.82 × 10⁴ | 423 × 105 |
| 2000 Jan 27 | 43.96 | 4.34 × 10⁴ | 367 × 105 |
| 2000 Feb 11 | 3.466 | 1.15 × 10⁵ | 489 × 105 |
| 2000 Aug 10 | 4.373 | 7.26 × 10⁴ | 399 × 105 |
| 2000 Aug 14 | 8.217 | 6.51 × 10⁴ | 546 × 105 |
| 2000 Oct 31 | 6.378 | 1.10 × 10⁵ | 405 × 105 |
| 2001 Jan 17 | 13.677 | 4.74 × 10⁴ | 409 × 105 |
| 2001 Mar 30 | 15.203 | 2.79 × 10⁴ | 428 × 105 |
| 2001 Sep 29 | 3.162 | 2.49 × 10⁵ | 636 × 105 |
| 2001 Oct 28 | 3.777 | 4.52 × 10⁴ | 519 × 105 |
| 2001 Oct 31 | 2.744 | 4.84 × 10⁴ | 402 × 105 |
| 2002 Jul 17 | 8.7 | 1.14 × 10⁵ | 471 × 105 |
Download table as: ASCIITypeset image
Table 2. Summary of Results for All Cases Including the Date, Shock Obliquity for Both ACE and Wind, Shock Compression Ratio, Theoretical Spectral Index, Power-law Fits to ACE and Wind Observations, and the Ratio of the Theoretically Expected Spectral Index to the Power-law Fit to the EPAM Observations
| Date of | θaBn | θaBn | raACE | raWind | Spectral | γ(EPAM) | γ(Wind) | Ratio= |
|---|---|---|---|---|---|---|---|---|
| Shock | (ACE) | (Wind) | Index (q) | q/ | ||||
| (ACE) | γ(EPAM) | |||||||
| 1998 Jun 13 | 23° | ... | 3.0 | ... | −4.5 | −6.44 ± 0.21 | ... | 0.70 ± 0.21 |
| 1999 May 5 | 38° | ... | 3.32 | ... | −4.29 | −6.96 ± 0.11 | ... | 0.62 ± 0.11 |
| 2000 Jan 27 | 23° | ... | 2.07 | ... | −5.8 | −5.76 ± 0.09 | ... | 1.0 ± 0.09 |
| 2000 Feb 11 | 27° | 20° | 2.52 | 2.56 | −4.97 | −5.83 ± 0.20 | −5.71 ± 0.2 | 0.85 ± 0.20 |
| 2000 Aug 10 | 18° | ... | 2.72 | ... | −4.74 | −6.89 ± 0.12 | ... | 0.69 ± 0.12 |
| 2000 Aug 14 | 21° | ... | 2.37 | ... | −5.19 | −5.70 ± 0.11 | ... | 0.91 ± 0.11 |
| 2000 Oct 31 | 24° | ... | 2.32 | ... | −5.27 | −6.59 ± 0.16 | ... | 0.80 ± 0.16 |
| 2001 Jan 17 | 28° | ... | 1.96 | ... | −6.13 | −6.34 ± 0.20 | ... | 0.97 ± 0.20 |
| 2001 Mar 30 | 35° | ... | 1.89 | ... | −6.37 | −4.68 ± 0.07 | ... | 1.36 ± 0.07 |
| 2001 Sep 29 | 19° | ... | 2.25 | ... | −5.4 | −5.65 ± 0.11 | ... | 0.96 ± 0.11 |
| 2001 Oct 28 | 30° | ... | 2.85 | ... | −4.62 | −6.35 ± 0.07 | ... | 0.73 ± 0.07 |
| 2001 Oct 31 | 39° | 20° | 2.08 | 3.10 | −5.78 | −7.19 ± 0.54 | −6.53 ± 0.18 | 0.80 ± 0.54 |
| 2002 Jul 17 | 35° | ... | 2.62 | ... | −4.85 | −4.82 ± 0.07 | ... | 1.0 ± 0.07 |
Note. aRefer to the ACE and Wind shock database Web sites for associated error analyses.
Download table as: ASCIITypeset image
3.1. Comparison with ACE Observations
We utilize data from the SWEPAM instrument on the ACE satellite (Stone et al. 1998; McComas et al. 1998) in order to compare our theoretical results with energetic proton and ion spectra observed at quasi-parallel shocks. SWEPAM measures solar wind plasma and ion fluxes as a function of direction and energy in the energy range of 260 eV to 36 keV. The spin averaged data are used for the comparison.
The Level II five-minute averaged data are also plotted for LEMS30 from the EPAM instrument (Gold et al. 1998) on board ACE. EPAM gives us information about the accelerated region of the particle distribution function in the energy range of 47 keV to 5 MeV, and hence a better understanding of the processes involved in accelerating particles through the shock. Having data from instruments on the same spacecraft allow for data coincident in space and time. For each case, the data are plotted, being careful that all quantities are plotted in the solar wind frame upstream and downstream of the stationary shock. Shock times are confirmed with data in an existing database maintained in-house.
Our goal is to compare model accelerated distributions to data from quasi-parallel shocks at 1 AU. We reviewed a subset of the ACE shock database2 for candidate shocks that are quasi-parallel (⩽45°). For the period 1998–2002, we identified 23 shocks with θBn between 3° and 40°, where θBn is the angle between the magnetic field and the shock normal. The sample was further reduced for this study by excluding reverse shocks and those that appear to be very slow and are not unambiguously true shocks. We additionally excluded any shocks with an enhanced energetic particle population for the previous 24 hr, such as from a previous shock. We find 13 shocks that fit our criteria.
For 13 shocks, an upstream Maxwellian is constructed using the average of the moments from SWEPAM for five minutes immediately preceding a verified shock. This gives us a realistic upstream distribution from which we accelerate protons. The parameters used to construct this upstream distribution (as well as the others) can be found in Table 1. The accelerated distribution is then compared with the corresponding data. An upstream Maxwellian was used because it closely resembles the observed solar wind thermal distribution (Chotoo et al. 1998). We then overplot the EPAM data taken directly after the shock and iterate our choice of injection energy until the model spectrum is consistent with the observed amplitude of the spectral data for EPAM. The uncertainty in the EPAM data was initially plotted. However, this uncertainty is of the order of 10−2–10−6 smaller than the data. Due to this very small uncertainty, the error bars were indistinguishable from the data symbol used (*) and are therefore not plotted.
The approach described above identifies an injection energy within the parameters of the observed upstream solar wind thermal distribution that is consistent with the observed spectral amplitude derived for the EPAM instrument. By iterating the injection energy, we can determine whether the derived injection energy is in fact in accord with the theoretical constraint of Equations (1) and (2). Since we specifically use the observed shock compression ratio, r, we can compare the predicted accelerated spectrum to that observed in these various ESP events. The consistency of the derived injection energy and the observed energetic distribution function therefore provide a direct test of DSA, including whether particles can be injected directly from the thermal solar wind distribution or not.
Figures 2–4 show results for 2002 July 17, 2001 September 29, and 2000 August 14, respectively. The detailed characteristics of these shocks and others are tabulated in Table 2. This includes the shock compression ratio and obliquity. The observed shock characteristics are used to compute the theoretical accelerated power-law spectrum. The slope of the dotted line, identified by "q" in the plots which corresponds to the spectral index, is of course different for each case, as is the injection energy. The observations align well with the expected theoretical spectra of the accelerated population in all four cases. The injection energies varied from 1.5 keV to 2.785 keV.

Figure 2. Constructed upstream Maxwellian distribution derived from the observed plasma distribution ahead of the shock and the associated accelerated distribution (dotted line) using Equation (7) for 2002 July 17, assuming an injection energy of 1.5 keV. Data taken immediately after the shock from the EPAM instrument on ACE are overplotted.
Download figure:
Standard image High-resolution image
Figure 3. As with Figure 2, constructed upstream Maxwellian distribution and associated accelerated distribution (dotted line) using Equation (7) for 2001 September 29 using an injection energy of 2.785 keV. Data taken immediately after the shock from the EPAM instrument on ACE are overplotted.
Download figure:
Standard image High-resolution image
Figure 4. As with Figure 2, constructed upstream Maxwellian distribution and associated accelerated distribution (dotted line) using Equation (7) for 2000 August 14 using an injection energy of 1.95 keV. Data taken immediately after the shock from the EPAM instrument on ACE are overplotted.
Download figure:
Standard image High-resolution imageTo ensure that a Maxwellian distribution has a sufficient number of particles in the tail to provide the injection population for DSA, we extend our analysis by considering an upstream κ-distribution as the background distribution, based on the same set of 13 shocks. When comparing the theoretical results to observations, we found that the κ-distribution for κ = 2, 4 required a significantly higher injection energy in order for the theoretical spectrum of acceleration ions to coincide with the observed spectrum. The inferred higher injection energy for a κ-distribution upstream of the shock is a direct consequence of the much larger number of particles in the "wings" of the distribution. An injection energy comparable to that derived from a Maxwellian distribution yielded theoretical power spectra that had much higher amplitudes than were observed. The injection energy had to be increased significantly in order to reduce the amplitude of the computed spectra. Thus, the results from using an upstream κ-distribution yielded injection energies unrealistically higher than one would expect for a typical interplanetary shock (Zank et al. 2000). Additionally, we use a distribution with κ = 10 and find the accelerated spectrum similar to that produced by the Maxwellian. This is not surprising, as the κ-distribution tend toward a Maxwellian for large κ. These results are shown in Section 4. Our analysis based on a κ-distribution rather than a Maxwellian supports our earlier conclusion—that a suprathermal population of protons is not needed to provide the seed population for DSA at quasi-parallel shocks. Instead, protons are injected directly from the solar wind thermal pool, initially with energies above ∼1.5 keV. Consequently, we therefore restrict the remainder of the paper to discussions based on either an upstream background Maxwellian population or a kappa distribution that is a weak departure from a Maxwellian.
Additionally, we plot the phase space density for both SWEPAM and EPAM for 10 minutes immediately preceding and following the shocks. A least-square polynomial fit routine is then employed to determine the slope (and standard deviation) of the accelerated distribution immediately after the shock in the EPAM data. This corresponds to the "q" value in the p−q term in Equation (6) that dominates the accelerated distribution. Ideally, the slope will be the same or close to the spectral index found using theory, which would indicate a strong correlation between the DSA theory to observations of particles being accelerated out of the approximately Maxwellian distribution of the solar wind.
In Figure 5, we plot the data from the SWEPAM (lower energies) and EPAM (higher energies) instruments on ACE for the 2002 July 17 shock. Plotted are observations 10 minutes immediately preceding and following the shock. The power law of the fit to the line through the EPAM data is γ = −4.82 ± 0.07. The uncertainty in the power-law fit to the EPAM data was initially plotted. However, due to the small uncertainty and the log–log plot, the error bars were indistinguishable from that of the power-law fit. We therefore refer to the fit and uncertainty in the plot details only. Recall that the corresponding theoretical spectral index for this case is −4.85, which is within 1σ deviation from the data. In Section 4, we summarize the properties of all the shocks that we considered. The summary includes plots that compare the predicted and observed downstream spectra. From these results, we construct two summary plots analogous to plots used by van Nes et al. (1984). These are a plot of the observed and predicted spectral index as a function of compression ratio and a plot of the predicted and inferred injection energy as a function of shock obliquity. We find a good correspondence between observations and predictions, but there are some subtleties that need to be borne in mind.
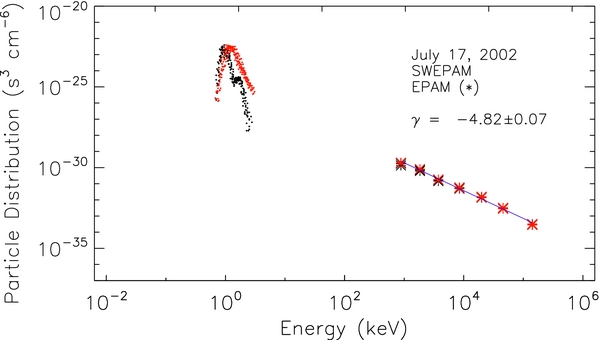
Figure 5. Data for before (black) and after (red) the shock on 2002 July 17. The particles centered around 1 keV are data observations from SWEPAM, while the second group of data (*) are observations from EPAM. Both instruments are on ACE. The line through the EPAM data is the power-law fit to observations immediately following the shock encounter. The power-law fit and uncertainty are reported in the plot as γ.
Download figure:
Standard image High-resolution image3.2. Comparison with Wind Observations
While the SWEPAM instrument is capable of measuring energies up to 36 keV, it was designed to measure the peak of the solar wind and therefore generally stops well short of this upper bound. This leaves a sizable gap in energies between the SWEPAM and EPAM data, as can be seen in Figure 5. To explore further our contention that DSA energizes particles directly out of the thermal Maxwellian pool, we sought additional observations in the 2–50 keV range. The Ion Electrostatic Analyzers (PESA)-High instrument, which is part of the 3D Plasma and Energetic Particle experiment on board Wind, collects particles with energies between 0.7 and 30 keV (Lin et al. 1995). There are a few times when Wind is ahead of the Earth and relatively close to ACE. During these periods, a shock would sometimes sweep over both ACE and Wind. Of 13 quasi-parallel shocks that we find in the ACE data set, we were able to identify two of these as occurring at times where Wind and ACE were relatively close together ahead of the Earth. By somewhat naively combining the PESA-High data from Wind with that derived from the SWEPAM and EPAM data sets, we can obtain data coverage from ⩽1 keV to ⩾1 MeV. Of course, despite the relatively close proximity of the two spacecraft, the shock is measured at a different spatial and temporal location and the plasma characteristics are not identical. Nonetheless, the results are suggestive and instructive.
Figure 6 shows the combined data from SWEPAM, EPAM, and PESA-High for 2000 February 11. The shock obliquity, θBn, was 27° at ACE and 20° at Wind. The time of the shock passage differed by an hour for each spacecraft. The data obtained 10 minutes before and after the shock arrival at the respective spacecraft are plotted. We fit two separate power laws: one to the EPAM data after the shock arrival at ACE and the other to the five most energetic energy bins for PESA-High after the shock arrival time at Wind. The power-law fit to only the downstream EPAM data is −5.83 ± 0.2. The power-law fit to the higher energies measured by PESA-High on Wind yields a downstream exponent of −5.71 ± 0.2, which is close to within the standard deviation of the accelerated spectral slopes between ACE and Wind even though they are separated spatially and temporally. Furthermore, the respective amplitudes of the downstream power-law spectra measured by PESA-High and EPAM appear to be self-similar and scale with one another (essentially, a single unbroken straight line can fit the two power laws). Finally, we note how clearly the PESA-High data emerge from the background solar wind thermal distribution, just as was seen by Gosling et al. (1981). This suggests that if we are cautious, we can use data from two separate spacecraft for a simple comparison study.

Figure 6. Combined plot of data from SWEPAM (·), PESA-High (+), and EPAM (*) for 10 minutes before (black) and after (red) the 2000 February 11 shock. The power-law fits and uncertainties are reported in the plot as γ (EPAM) and ξ (Wind).
Download figure:
Standard image High-resolution imageFigure 7 shows our constructed upstream Maxwellian using data from 2000 February 11 with the corresponding downstream data from Wind and EPAM overplotted. The injection energy for this case is 1.7 keV. For cases where Wind data are included (such as this one), the accelerated population is aligned with the EPAM data because the data used to construct the upstream Maxwellian used in Equation (7) are taken from SWEPAM observations as both instruments are on ACE. The Wind data follow the same general trend with the accelerated particle spectrum, but does not align very closely with EPAM. The differences between Wind and ACE observations may be due in part to spatial and temporal differences in the solar wind at the locations of ACE and Wind, and of course possible differences in calibration between instruments on the different spacecraft. Nevertheless, the close alignment of the EPAM data with the theoretical accelerated distribution obtained from Equation (7) with the solar wind thermal pool modeled as a Maxwellian indicates that a sufficient number of particles above 1.7 keV can account for the accelerated spectrum, without the need for an additional or distinct seed particle population.
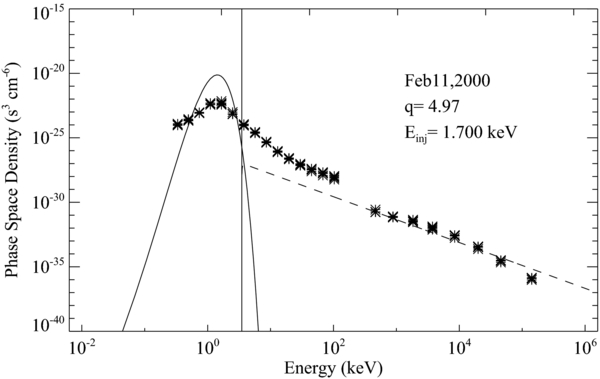
Figure 7. Constructed upstream Maxwellian distribution derived from the observed plasma distribution ahead of the shock, and the associated accelerated distribution (dotted line) using Equation (7) for 2000 February 11 using an injection energy of 1.7 keV. Data for immediately after the shock from the PESA-High instrument on Wind and the EPAM instrument on ACE are overplotted.
Download figure:
Standard image High-resolution image4. SUMMARY OF RESULTS
Here, we summarize our results for 13 events in our study. Table 1 summarizes the input parameters used to construct the Maxwellian and kappa particle distributions upstream of all shocks in our sample study. Table 2 summarizes the results derived from Equation (7), as well as relevant information that allows us to compare shock properties at the time of the shock passage at both ACE and Wind, such as shock obliquity, the shock compression ratio (r) calculated for both ACE and Wind at the time of the shock, and the theoretical spectral index (q) calculated using the shock compression ratio observed by ACE. Also, in Table 2 are the power-law fits to the EPAM observations immediately after the shock arrival, the power-law fits to the five most energetic channels of the Wind observations immediately after the shock, and the ratio of the spectral index calculated from the shock compression ratio at ACE to the EPAM power-law fit. The spectral index ratio is a measure of how well the theoretical prediction compares to the observations. As we discuss with several examples below, the spectral index ratio should be interpreted cautiously. Only instruments on ACE were used to calculate the ratio as they give coincident information, both spatially and temporally. Of 13 shocks in the study, two yielded ratios of 1.0, three have ratios 0.9–0.99, three have ratios 0.8–0.89, two have ratios 0.7–0.79, one has a ratio of 1.36, and the remaining two have ratios less than 0.7. The error for each is listed in Table 2.
Figures 8 and 9 show the results of accelerating the upstream Maxwellian particle distribution constructed using values in Table 1 and accelerated using Equation (7). The dashed line is the predicted accelerated distribution with EPAM (Figures 8 and 9) and Wind (Figure 9) observations overlaid. We also compute the upstream distribution using a κ-distribution with κ = 10 and compute the predicted accelerated distribution. These are shown as dotted lines in Figures 8 and 9. Points in black/red are data immediately preceeding/following the shock. Additionally, the injection energy is adjusted for each shock so that the predicted accelerated population lines up with observations. For many of the dates, we more closely align the accelerated distribution from the κ-distribution with the EPAM data. However, in many of the cases, the accelerated spectrum from the Maxwellian and κ- distributions align very closely with each other for the given injection energy. This is not surprising, as distributions for large values of κ resemble Maxwellians. The injection energy is listed in each plot and ranges from 1.05 to 2.785 keV.
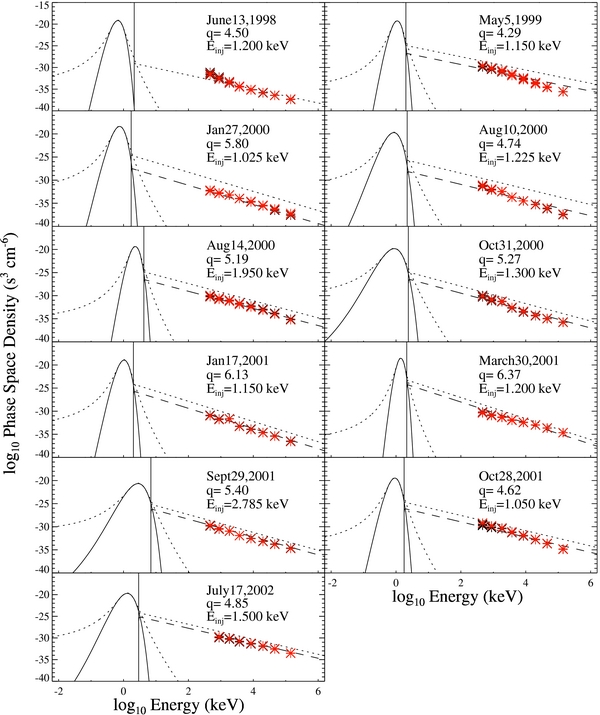
Figure 8. Summary of the ACE SWEPAM and EPAM data sets for 11 interplanetary shocks at 1 AU. The observed upstream SWEPAM data are used to construct the input Maxwellian thermal solar wind distribution for which the injection energy and spectrum of energetic particles (dashed line) is computed theoretically. Additionally, the κ-distribution for κ = 10 and corresponding energetic particles (dotted lines) are also computed. EPAM data are overplotted for 10 minutes before (black) and after (red) the shock arrival time.
Download figure:
Standard image High-resolution image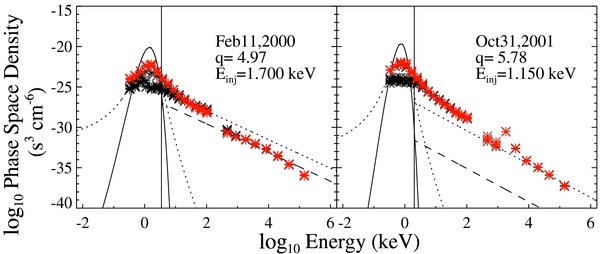
Figure 9. Summary of the combined ACE (SWEPAM and EPAM) and Wind (PESA-High) data sets for two interplanetary shocks upwind of the Earth that are spatially and temporally close. The observed upstream SWEPAM data are used to construct the input Maxwellian thermal solar wind distribution for which the injection energy and spectrum of energetic particles (dashed line) is computed theoretically. Additionally, the κ-distribution for κ = 10 and corresponding energetic particles (dotted lines) are also computed. EPAM and Wind data are overplotted for 10 minutes before (black) and after (red) the shock arrival time.
Download figure:
Standard image High-resolution imageOnly one case, 2001 March 30 shown in Figure 8, has a ratio greater than one, which means that for this shock the predicted spectral index was softer than the observed spectrum. The predicted accelerated distribution agrees better with the lower energies of the overlaid EPAM observations than the higher. The evidently harder spectrum at higher energies may indicate a previously accelerated population, possibly from an earlier flare or even a previous stronger shock that had a harder spectrum and higher energies than is possible at the observed shock.
The remaining cases all have ratios either equal to or less than one. Four cases have ratios of 0.96–1.0 (plus their respective errors), indicating excellent agreement between the predicted spectrum and observations. All other ratios are less than one and indicate a harder predicted spectrum than observed. If we consider the two examples with two of the largest standard deviations (1999 May 5 and 2001 October 28; both in Figure 8), then we see that the energetic particle spectrum more closely resembles a double power law, or possibly a power law with a rollover at higher energies. In these (and the other cases where the ratio is significantly different from one), a single power-law fit is not a good representation, and it is better to fit the spectrum with two power laws, one to the lower energy channels and a second power-law fit to the higher energies (Mewaldt et al. 2005). As derived previously by Zank et al. (2000) and subsequently in Li et al. (2003), Zank et al. (2007), Verkhoglyadova et al. (2009), and Verkhoglyadova et al. (2010), the double power law or rollover structure (i.e., steepening at higher energies) is consistent with time-dependent DSA at an evolving interplanetary shock. These results are consistent with time-dependent acceleration.
We construct a plot analogous to Figure 12 of van Nes et al. (1984), i.e., we plot the spectral index, q, as a function of the shock compression ratio, r. In view of the comments above regarding both the double power-law character of many spectra or the possibility that a harder spectrum is due to a previous population of energetic particles, we need to exercise care in determining an observed spectral index. Thus, for example, we compute the spectral index for only the lower energy part of the accelerated spectrum for the 2001 October 28 event. The steeper section/segment of the accelerated particle spectrum is steeper, probably as a result of time-dependent losses (Zank et al. 2000, 2007; Verkhoglyadova et al. 2009). It is therefore incorrect to describe this part of the spectrum using a steady-state theory. In Figure 10, we provide two sets of plots. The first plot deliberately selects a range of points that obviously correspond to a power-law distribution, generally the first few lower energy points, and we fit a power law to these "hand-picked" terms. As described above, we associate these points with a steady-state model of DSA. Having chosen the points to which we fit the power law, we plot the power-law index q as a function of compression ratio r, and we additionally plot the theoretical q versus r plot derived from steady-state DSA theory. As can be seen, with some exceptions, the correspondence between the steady-state part of the observed spectrum (i.e., q) as a function of compression ratio is very reasonable. The marked exceptions correspond in one case (marked with an asterisk in the figure) to a very hard/flat spectrum that was probably convected into the shock, and the shock was not sufficiently strong to modify the incoming energetic particle spectrum. For completeness, we also plot the observed q derived naively for all shocks from the entire range of spectral points, i.e., we simply average double power laws, etc., to determine the approximate value of q. This is the approach followed by van Nes et al. (1984), and it is clear that the relation of the observed q versus r compared to the theoretical steady-state curve is rather poor, especially at larger values of r. These two sets of curves demonstrate the danger of interpreting shock spectra based entirely on the steady-state DSA theory. This point has been made repeatedly, starting in Zank et al. (2000) and in subsequent papers (Li et al. 2003; Rice et al. 2003; Zank et al. 2007; Verkhoglyadova et al. 2009) in which DSA at propagating, weakening shocks with losses resulted in energetic particle spectra with non-power-law structure.
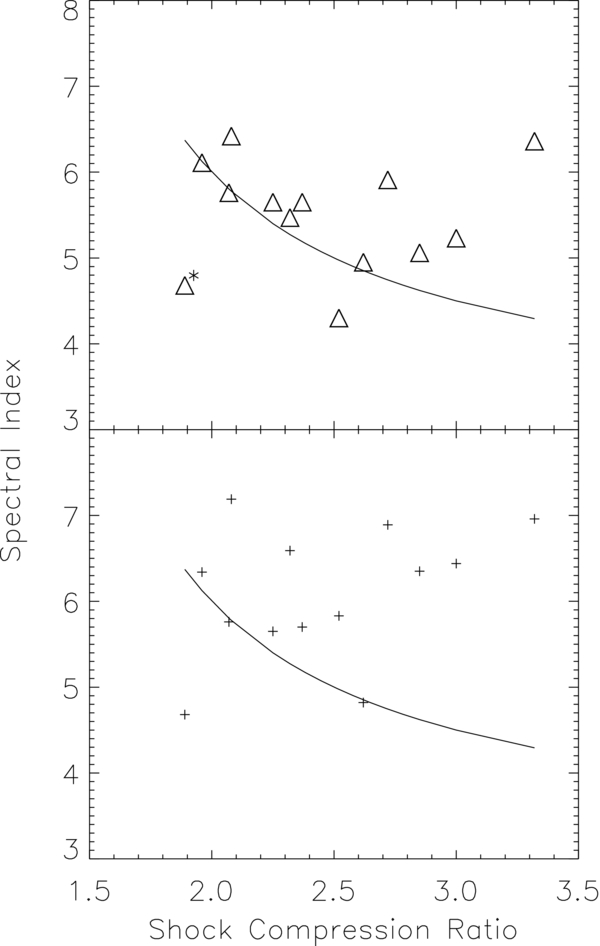
Figure 10. Points indicate the power-law fit to the EPAM data vs. the shock compression ratio, r, for 13 shocks in the study. The top panel plots the power-law fit to the "hand picked" EPAM data points. The bottom panel plots the power-law fit to the entire EPAM energy range. The line in both plots indicates the theoretical curve for the spectral index (q) vs. the shock compression ratio (r).
Download figure:
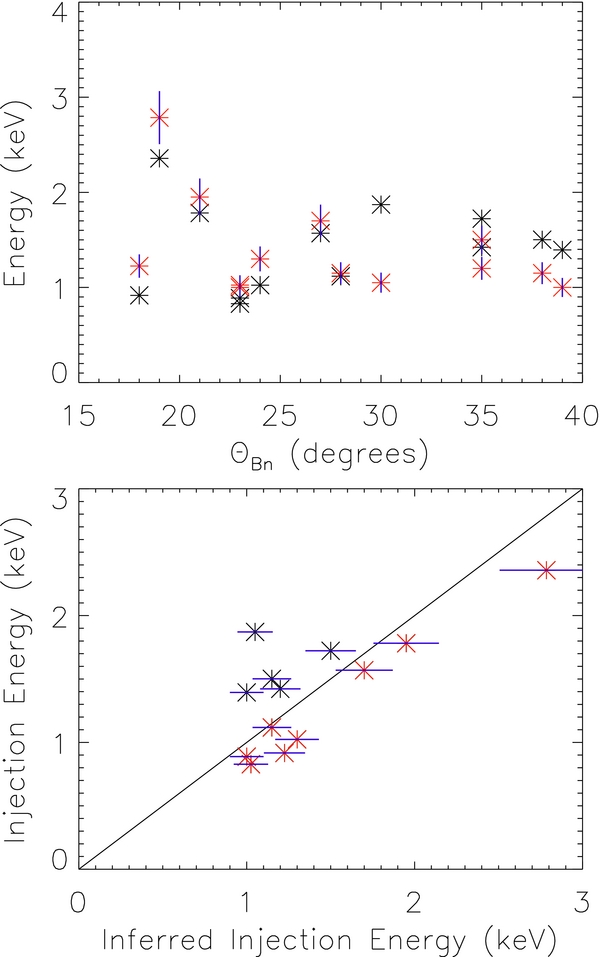
Standard image High-resolution imageFor the sake of completeness, we compare the estimated theoretical injection energy based on Equation (1) and that inferred from matching the predicted and observed accelerated particle spectra. Thus, in Figure 11, we plot Einj(θ) for the theoretical (black points) and inferred (red points) values. These are plotted in the top panel. Additionally, we plot a scatter plot of the theoretical injection energy versus the inferred injection energy shown in the bottom panel. We also plot the 1:1 correspondence. The red symbols indicate the points for θBn less than 30°. The black symbols are the points with θBn ⩾ 30°, which for our study ranges up to 39°. The correspondence is excellent, and we note that our method for inferring Einj is relatively insensitive up to factors of ∼2.
Figure 11. Top panel is a combined plot of the inferred injection energy (*) in keV derived from the data fit to the observed spectra for all shocks in our study vs. the angle between the upstream magnetic field and the shock normal (θBn). Also plotted is the theoretical estimate of the injection energy derived from Equation (1), i.e., u21 sec θBn (*) vs. θBn. Note the close correspondence of the inferred and theoretical injection energies for quasi-parallel shocks. The bottom panel is a scatter plot of the injection energy and the inferred injection energy (both in keV), with the red symbols those points for θBn < 30°. The one-to-one line is also plotted.
Download figure:
Standard image High-resolution image
5. DISCUSSION
Observations of ESP events at 1 AU for 13 quasi-parallel shocks were compared with theoretical predictions of the accelerated spectra using either a Maxwellian or a kappa distribution that departs weakly from the Maxwellian (κ = 10), constructed from the observed plasma conditions as the upstream seed population. Data for the ACE SWEPAM and EPAM instruments were used as were data from the PESA-High instrument on Wind when applicable. Table 2 shows the results for all shocks, giving specific information for the shock compression ratio at ACE and Wind, the obliquity of the shock at both spacecraft, as well as the power-law fits to the accelerated spectra of the EPAM and Wind data, and the ratio of the theoretically computed spectral index to the power-law fit for the EPAM data which gives mathematical representation to how well theory and data correlate for each event. The ratio ranges from 0.62 to 1.36 for all events in the sample. However, 6 of the 13 events have spectral ratios that range from 0.85 to 1.0. Shocks that exhibit poorer ratios may have additional seed populations and as such could explain the poorer correlation between the theoretical spectral index and that of observations since the spectral index is based solely on the accelerated population for an upstream Maxwellian or weak kappa distribution only. However, we contend it is possible to explain the cases with ratios closer to one by diffusively accelerating only the thermal core population of the solar wind.
The summary plots in Figure 8 represent the central results of the paper, as does Figure 9 in which we relate lower energy PESA data from Wind to higher energy EPAM data from ACE. These results may be summarized as follows.
- 1.By using the plasma characteristics immediately upstream of a quasi-parallel interplanetary shock, we can construct either an upstream Maxwellian thermal solar wind distribution or a weak (κ = 10) kappa distribution ahead of the shock. Using the observed "Maxwellian" ahead of the shock, we find that, theoretically, an injection energy Einj of 1.05 keV ⪅Einj⪅2.785 keV ensures that the amplitude/intensity of the theoretical accelerated ion spectrum matches that observed.
- 2.On the basis of the observed shock characteristics, we match the theoretical and observed energetic particle spectra between 105 and 3 × 10⁶ eV. The observed spectra in Figures 2–4 exhibit almost perfect power laws which are essentially identical to those predicted locally, i.e., immediately downstream of the observed shock.
Since the injection energy is consistent with the criteria for particles to be accelerated diffusively at a shock wave, we may conclude that protons can be accelerated directly out of the solar wind Maxwellian distribution or from a kappa distribution that represents a weak departure from a Maxwellian (κ = 10). Based at least on these examples, it appears to be unnecessary to have either a suprathermal pool of energetic protons to seed DSA or even a separate physical mechanism to pre-accelerate protons at the quasi-parallel shock itself. Of course, if a pre-existing suprathermal particle population is present, then it will experience DSA. This, however, is not necessary to explain the observed spectra for the quasi-parallel shocks we analyzed in this paper. For the shocks studied here, we checked for a background of energetic particles and found no enhanced energetic particle population for 24 hr previous to the arrival time at ACE of our shocks, giving confidence to our results that a Maxwellian distribution or kappa distribution that departs weakly from a Maxwellian has sufficient particles in the thermal pool to account for the observed accelerated distribution.
Second, the observed spectral form for energetic protons at quasi-parallel shocks is explained completely by DSA when the observed shock characteristics are used. Because of the different shock strengths, we found spectral indices for the energetic ion spectra that ranged from −4.29 to −6.37 for the shocks in our study (refer to Table 2), in excellent agreement with observations. We therefore conclude that DSA with injection directly from an approximately thermal Maxwellian distribution is responsible for ESP events associated with quasi-parallel shocks.
G.P.Z. acknowledges partial support of NASA grants NNX09AP74A and NNX09AG70G. The authors thank Q. Hu at CSPAR/UA Huntsville for help with the ACE shock database, R. Skoug at LANL for providing the particle distribution data from the ACE/SWEPAM instrument, the ACE SWEPAM and EPAM instrument teams, and the ACE Science Center for providing the ACE Level II data, and R. Lin at UC Berkeley and CDAWeb for providing the Wind 3D Plasma Analyzer data. L.N.P. thank L. Wilson/GSFC for help processing the Wind Level 0 data. We thank the referee for the very helpful comments.
Footnotes
- 1
As an aside, we note that the injection and acceleration of protons is critical in understanding diffusive shock acceleration for all particle species. The more numerous protons are responsible for exciting the turbulent/wave field upstream of the shock (Bell 1978a, 1978b; Lee 1983, 2005; Gordon et al. 1999; Zank et al. 2000; Rice et al. 2003) that then serves to trap energetic particles in the vicinity of the shock, rather than allowing them to stream away into the upstream plasma. By contrast, as discussed by Li et al. (2003), the heavy ions are essentially test particles that experience scattering in the turbulence field excited by the protons. Heavy ion characteristics, such as maximum energies and injection energies, are determined by the diffusion coefficient, which is itself determined by the proton excited wave field. Understanding proton injection is therefore key to understanding the fundamental physics of injection. If there is a sufficient level of turbulence upstream and downstream of a shock, an energetic pre-existing population of ions will inevitably experience diffusive acceleration at a shock wave.
- 2
The database can be found at http://espg.sr.unh.edu/mag/ace/ACElists/obs_list.html#1999.