


ABSTRACT
The giant, superfast, interplanetary coronal mass ejection, detected by STEREO A on 2012 July 23, well away from Earth, appears to have reached 1 AU with an unusual set of leading bow waves resembling in some ways a subsonic interaction, possibly due to the high pressures present in the very energetic particles produced in this event. Eventually, a front of record high-speed flow reached STEREO. The unusual behavior of this event is illustrated using the magnetic field, plasma, and energetic ion observations obtained by STEREO. Had the Earth been at the location of STEREO, the large southward-oriented magnetic field component in the event, combined with its high speed, would have produced a record storm.
Export citation and abstract BibTeX RIS
1. INTRODUCTION
The Sun has just passed through an unusual solar minimum which lasted the longest and had the lowest activity (Russell et al. 2010, 2012) in over 100 years. Nevertheless, since late 2009 solar activity has been increasing and on 2012 July 23, the Sun sent an unusually strong interplanetary coronal mass ejection (ICME) toward STEREO A, which at the time was 121° ahead of Earth in its orbit. Yet as we discuss herein, it did so in a way that, if the ICME had encountered the Earth, it may have generated a sizeable geomagnetic storm but possibly not dangerous levels of geomagnetically induced currents that could damage transformers connected to long high-voltage transmission lines (Brooks 1959; Winckler et al. 1959; Le et al. 1993). In addition, this event provides an example of the possible mediation of an interplanetary shock by the presence of highly energetic particles.
2. MAGNETIC FIELD AND PLASMA OBSERVATIONS
On 2012 July 23, a very fast CME was launched from the Sun at about 0208 ± 2 minutes UT, as detected by the STEREO SECCHI (Howard et al. 2008) EUVI imager at 19.5 nm, followed by the detection by the COR1 coronagraph at 0228 ± 2 minutes and the COR2 coronagraph at 0246 ± 8 minutes. The leading edge of the magnetic structure driving this ejection reached STEREO at 0.96 AU at 2255 UT the same day. The arrival of this magnetic cloud was preceded by three distinct boundaries in the plasma. Figure 1 shows the magnetic field direction and magnitude (Luhmann et al. 2008) from July 23, 0000 to July 25, 2400, and the corresponding solar wind speed measured by STEREO's PLASTIC instrument (Galvin et al. 2008). The initial disturbance occurs at 1630 UT. Dividing the distance of STEREO A from the Sun by the time of arrival measured from the onset, we obtain an average transit speed of 2780 km s−1. This arrival is marked with dashed line 1 in Figure 1. While the solar wind speed has been reconstructed through most of the event as shown in the bottom panel of Figure 1, the proton number density and temperature are not currently retrievable. The data that are available are shown in Figure 2. The density, temperature, and speed had been increasing for some time. The jump at 1630 UT is barely perceptible in Figure 2. It does not appear to be a strong blast wave from the Sun that we would expect if it had a speed of the order of 2800 km s−1. In fact, as discussed below, the magnetic profile is not that of a fast-mode shock. The second front marked with line 2 arrives at 1915 UT. Again dividing the distance by the time from onset gives an average speed of this front of 2330 km s−1. As clearly evident in Figure 1, the magnetic field drops while the energetic particle flux in Figure 2 makes a sudden rise and the speed hardly changes. This too cannot be a fast-mode shock.
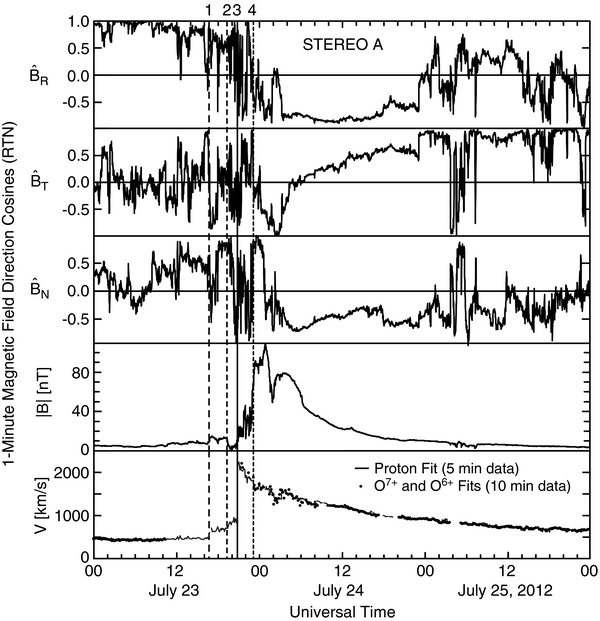
Figure 1. Overlapped two-minute magnetic field averages at STEREO A on 2012 July 23, 24, and 25, and 5 and 10 minute solar wind speeds. Coordinate system is radial, tangential, and normal with R the outward direction from the Sun, T in the direction of the vector cross product of the Sun's rotation axis, and the radial direction, and N completing the RTN right-handed set. Lines 1–4 mark boundaries observed in the magnetic field, plasma, and energetic particles seen in following figures.
Download figure:
Standard image High-resolution image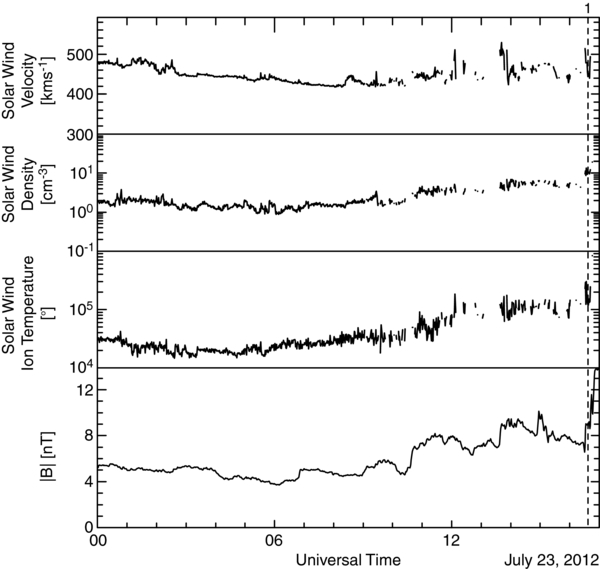
Figure 2. One-minute averages of the solar wind proton speed, number density, and temperature until the detector was overcome by the energetic particle fluxes.
Download figure:
Standard image High-resolution imageBetween 2000 and 2055 UT, the depressed magnetic field strength recovers with a series of irregular pulses, at which time the nature of the waves changes and the field strength increases. The speed jumps abruptly at this point marked with line 3. This does resemble a fast-mode shock with the pulsing field being characteristic of a high beta magnetosheath. Here the distance to the Sun divided by the time from onset to arrival gives on average speed of 2125 km s−1.
The leading edge of the magnetic cloud at 2255 UT is marked with line 4. Ultimately the magnetic field reaches a maximum strength of 109 nT, one of the largest interplanetary field strengths on record near 1 AU. The average transit speed of the leading edge of the cloud itself was 1910 km s−1. The magnetic cloud appears to consist of two flux ropes as evidenced by the double field maxima and rotations of the field evident in the direction cosines of the magnetic field in the top three panels of Figure 1, early on July 24. The first rope is most evident in BR and BN and the second in BR and BT. These apparent ropes are followed by a slow return to more normal magnetic field magnitudes over the next two days. On July 25, the field direction becomes irregular as is customary in the interplanetary magnetic field, but the field strength and the solar wind speed are still elevated above pre-event levels.
As shown in Figure 2, at the time of the CME onset on the Sun, judged to be 0208 ± 2 m UT, the plasma at STEREO had a density of about 2 cm−3, an ion temperature of 22,000 K, and a bulk speed of about 460 km s−1. Around 11 UT the density and temperature began to rise reaching about 3.5 cm−3 and 70,000 K at 1200 UT with little change in speed. The solar wind ion temperature began to rise at about 1600 UT, reaching 300,000 K at 1630 UT with a density of about 10 cm−3. The accompanying magnetic changes do not indicate the presence of a shock but rather a tangential discontinuity. As evident in Figure 2, after 1645 UT, the density and proton temperature are not available because of the energetic particle flux interferes with their calculation, but the speed can still be derived. At the apparent fast-mode shock at 2055 UT, the speed rises abruptly to 2250 km s−1 and then smoothly decays for the rest of the event. The speed is almost 1900 km s−1 as the magnetic cloud is entered.
Had this ICME encountered the Earth, the lack of a strong fast shock could have reduced the strength of any geomagnetically induced currents, but passing the Earth at 1900 km s−1 and having a 25 nT southward magnetic field over the first 6 hr, it would be expected to have produced a storm approaching ∼−1000 nT in the Dst index, assuming that the Burton formula (Burton et al. 1975) applied for this event. Since the magnetic field is strong, we expect that reconnection between Earth's magnetosphere and the ICME would have been efficient, both driving a large ring current injection and allowing entry of the energetic particles through a greatly expanded high latitude open field region.
3. ENERGETIC PARTICLES
The energetic ion data accumulated by the STEREO energetic particle investigations are very interesting during this period and reach levels that may be dynamically important. These intensities are shown for protons in three energy ranges in the top panel of Figure 3 using observations of the three detectors, SEPT, LET, and HET. The flux rises rapidly immediately after solar onset, slows its rise until about 1920 UT. It then suddenly jumps at time 2, rising slowly again, maximizing, and beginning to drop gradually until 2255 UT when it drops suddenly at time 4. This is coincident with the onset of the step rise in the magnetic field and we interpret the fall in the particle intensity and the rise in field strength as the entry into the magnetic cloud. The behavior of the energetic particle flux at 1915 UT resembles that seen in the terrestrial magnetosheath plasma that is first compressed at the leading edge of the bow wave and then deflected by the magnetic obstacle. However, there is no conventional shock at line 2. The plasma density may have increased together with the jump in energetic particle intensity, but the magnetic field dropped as the intensity rose. This signature is not the sharp boundary we expect for a fast-mode shock, but instead the probable signature of a slow-mode wave (Song et al. 1992). If this wave is standing in front of the cloud, the speed of the ICME relative to the solar wind must be below the magnetosonic fast-mode speed. The slow-mode being slower than the fast-mode can form a standing wave in this situation. However, we do appear to have a fast-mode shock at time 3 as the spacecraft enters a region resembling a high-beta magnetosheath and the speed of the plasma rises sharply.
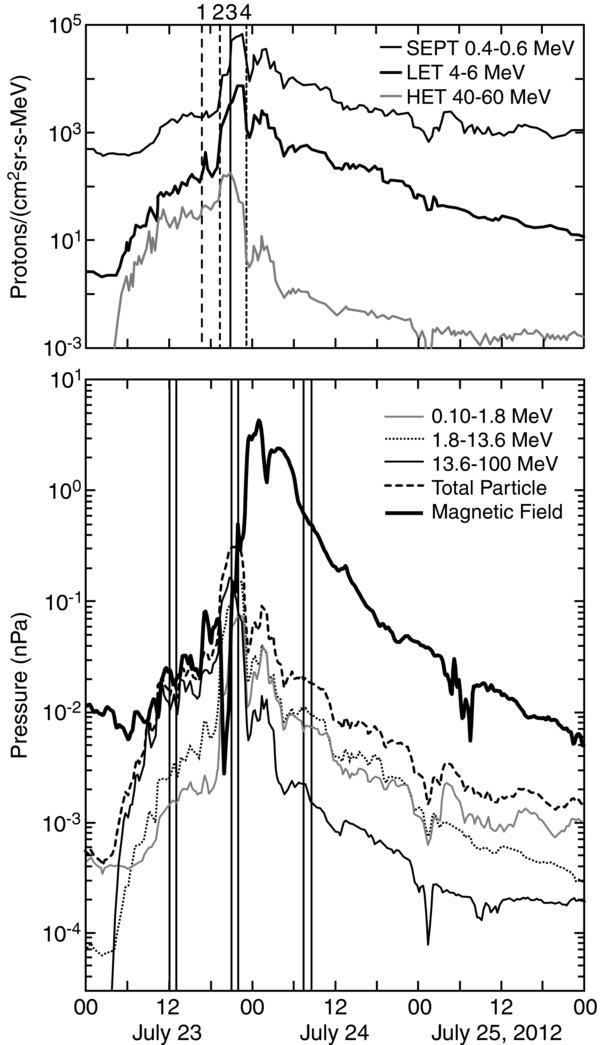
Figure 3. Top: 10 minute average intensities of energetic protons measured by the three energetic particle detectors on STEREO A: SEPT from 0.4 to 0.6 MeV, LET from 4 to 6 MeV, and HET from 40 to 60 MeV. Lines 1–4 mark the same times as shown in Figure 1. Bottom: the energetic proton pressure in three energy ranges and their sum during the event, using sensors SEPT, LET, and HET. Vertical times shows the times used for the spectra in Figure 4. The magnetic pressure is included for comparison.
Download figure:
Standard image High-resolution imageIn order to determine whether the energetic particles can have a dynamic effect on the magnetic cloud we need to calculate their energy density or pressure contribution. We do this using the full proton spectrum constructed from the multiple detectors, and is shown in the bottom panel of Figure 3. Also shown in Figure 3 (bottom) is the magnetic field pressure through the event. Almost immediately after the onset of the event, energy density of the very energetic ions alone became comparable to that in the magnetic field. Thus, the very energetic particles have become a major component of the plasma. After the compression at time 2 until the cloud is entered at time 3, the energetic particle pressure totally dominates the magnetic field. Once the cloud is entered, the magnetic stresses dominate over the particle stresses.
At the times of the three pairs of vertical lines in Figure 3, we have calculated proton spectra and the average energetic particle pressure. The proton spectra are shown in Figure 4. They rival those of the largest events detected in the past. In the pressure calculation here, we add to the pressure in Figure 3 using all significant ion fluxes. We use data from all four of the STEREO energetic particle sensors, SEPT, LET, SIT, and HET (Luhmann et al. 2008). This includes the He ion pressure and that from z = 6 to 26 ions measured by SIT. Initially at 1230 UT on July 23, the magnetic pressure of 0.05 nPa is over twice the pressure, 0.02 nPa, of the energetic particles. At 2130 UT, the energetic ions dominate with 0.34 nPa compared to the field's 0.18 nPa. Thus the energetic ions are playing a major role in the structure and physics of the interaction in the region immediately in front of the magnetic cloud. In the cloud at 0800 UT, with 1.27 nPa compared to the energetic particles' 0.02 nPa, the magnetic field returns to dominance.

Figure 4. Energy spectra from the combined SEPT, LET, and HET sensors at three times during the event: during the rising intensity, near the peak intensity, and in the magnetic cloud.
Download figure:
Standard image High-resolution image4. MAGNETIC STRUCTURE
To confirm our suspicions about the role of the very energetic ions during this event, we look at high-resolution (8 Hz) plots of 1 hr segments of the magnetic field during this period in Figure 5. Panel (a) shows where the plasma density and speed first jumped. This is not the profile of a fast shock. The field drops, rises, jumps, falls and rises again. There are no upstream waves and by inference no upstream particles.

Figure 5. 1 hr panels of the 8 Hz magnetic field strength measured by STEREO A at key times on 2012 July 23. The vertical lines in panels (a), (b), (d), and (e) are the same times as those in Figures 1 and 3.
Download figure:
Standard image High-resolution image
The behavior after STEREO crosses into the compression region at point 2 in panel (b) is equally interesting. The increase in particle flux is accompanied by a significant drop in the magnetic field strength. This is the correlation expected in a slow-mode wave and not a fast-mode shock that usually marks the leading edge of an ICME arrival (Jian et al. 2006). Eventually the magnetic field recovers (panel (c)). Soon weak shocks appear, and then in panel (d)) of Figure 5, some sharp field increases as if a strong but high-beta, fast-mode shock was attempting to form (Farris et al. 1992). In panel (e), a magnetic barrier or plasma depletion layer forms (Crooker et al. 1979). At times in this region, the magnetic field drops to the magnetometer's minimum reading, 0.3 nT. Then the spacecraft enters the magnetic cloud at 2255 UT.
5. DISCUSSION AND CONCLUSIONS
In summary, the STEREO observations on 2012 July 23 through July 25 are those of an extremely strong ICME moving with near-record speed, but its interaction with the pre-CME plasma does not appear to be governed by a fast-mode shock. Rather, the intense flux of highly energetic particles in the strong coronal mass ejection seems to have altered the plasma conditions so that the physical processes changed from those of a supersonically driven blast wave to those of a subsonically driven compressional disturbance. In this way, some of the space weather danger from the powerful blast wave might have been lessened by the event itself.
This is not the first example of shock mediation in the literature. The behavior of energetic particles near the Voyager 2 observed termination shock has been interpreted in terms of accelerated particles mediating the shock (Florinski et al. 2009). The Voyager data show deceleration of the solar wind as it approaches the termination shock.
At 1 AU, a propagating interplanetary shock has previously been interpreted to have precursor activity indicative of energetic particle modification (Terasawa et al. 1999), but this example did not approach the degree of modification seen here. A second 1 AU event studied by Lario & Decker (2002) has some similarities to this event in the correlation of the particle fluxes and the magnetic field strength, but the driving magnetic structure (cloud) was not entered. The 2012 July 23 event shows very strong mediation of the shock and the driving magnetic structure is quite evident in this event.
This work was supported by the National Aeronautics and Space Administration under NASA Grant NAS5-00133, administered by the University of California, Berkeley.