


ABSTRACT
Dense environments are known to quench star formation in galaxies, but it is still unknown what mechanism(s) are directly responsible. In this paper, we study the star formation of galaxies in A2029 and compare it to that of Coma, combining indicators at 24 μm, Hα, and UV down to rates of 0.03 M☉ yr−1. We show that A2029's star-forming galaxies follow the same mass–SFR relation as the field. The Coma cluster, on the other hand, has a population of galaxies with star formation rates (SFRs) significantly lower than the field mass–SFR relation, indicative of galaxies in the process of being quenched. Over half of these galaxies also host active galactic nuclei. Ram-pressure stripping and starvation/strangulation are the most likely mechanisms for suppressing the star formation in these galaxies, but we are unable to disentangle which is dominating. The differences we see between the two clusters' populations of star-forming galaxies may be related to their accretion histories, with A2029 having accreted its star-forming galaxies more recently than Coma. Additionally, many early-type galaxies in A2029 are detected at 24 μm and/or in the far-UV, but this emission is not directly related to star formation. Similar galaxies have probably been classified as star forming in previous studies of dense clusters, possibly obscuring some of the effects of the cluster environment on true star-forming galaxies.
Export citation and abstract BibTeX RIS
1. INTRODUCTION
High-density regions have long been known to affect the evolution of galaxies, morphing blue, star-forming disks into red, quiescent early types. Many possible methods by which dense regions change galaxies have been discussed: ram-pressure stripping, the removal of a galaxy's gas as it plunges through the intracluster medium (ICM; e.g., Gunn & Gott 1972; Kinney et al. 2004; van Gorkom 2004; Sivanandam et al. 2010); starvation/strangulation, the removal of the hot gas halo by the ICM, making the galaxy unable to accrete more material (e.g., Larson et al. 1980; Balogh et al. 2000; Kawata & Mulchaey 2008; McCarthy et al. 2008); and galaxy–galaxy interactions, such as harassment and mergers, which readily change the morphologies of galaxies (e.g., Barnes & Hernquist 1996; Moore et al. 1996; Mihos 2004; Conselice 2006). See Boselli & Gavazzi (2006) for a more comprehensive review of these environmental processes.
What is not known, however, is which of these effects—if any—play dominant roles in the galaxy evolution seen in different environments. The effects seem strongest in dense clusters, which tend to have higher fractions of early-type galaxies and lower fractions of star-forming galaxies than the field (e.g., Dressler 1980; Gómez et al. 2003; van der Wel et al. 2007; Bai et al. 2009; Tempel et al. 2011), suggesting they are instrumental in cutting off a galaxy's ability to form stars. This behavior becomes less prominent with youth: clusters at higher redshifts (up to z ∼ 1) have both more star-forming galaxies and more massive star-forming galaxies than local clusters (Butcher & Oemler 1978, 1984; Balogh et al. 1997; Hashimoto et al. 1998; Poggianti et al. 1999). Galaxy morphology and star formation also depend on local density (Dressler 1980; Whitmore et al. 1993; Lewis et al. 2002; Christlein & Zabludoff 2005; Petropoulou et al. 2011). In Coma, for example, the outer regions of the cluster have higher fractions of star-forming galaxies than the dense center (Donas et al. 1995; Bai et al. 2009; Edwards & Fadda 2011).
It is also possible that much of the evolution we see in cluster galaxies occurs before they reach such high densities, though the evidence is less clear. Galaxy groups are known to have nearly cluster-level fractions of early-type galaxies, specifically S0s (Postman & Geller 1984; Zabludoff et al. 1996; Zabludoff & Mulchaey 1998; Wilman et al. 2009; Just et al. 2010). Also, groups have lower fractions of star-forming galaxies than the field but higher fractions than clusters (Wilman et al. 2005, 2008; Gerke et al. 2007; Balogh et al. 2009; Iovino et al. 2010). These results would seem to indicate a sort of "pre-processing" occurring in groups. Indeed, the age of E/S0 galaxies and their prevalence in these lower-density environments hint at significant mass growth and morphology changes prior to entering the cluster environment (Dressler 2004). Still, because these and other recent studies (Tran et al. 2009; Bai et al. 2010; Tyler et al. 2011) show that groups appear to be intermediate between the field and clusters, additional processing must occur in clusters.
There are many aspects of both star formation and clusters themselves we need to consider if we wish to understand the dominant mechanism for the quenching of star formation in dense regions. First, we must accurately estimate the star formation rate (SFR). Optical and UV data are frequently used, and yet both are subject to uncertain corrections for dust absorption. UV measurements, specifically, can be subject to selection biases that tend to make them echo the overall luminosity function of the cluster (Cortese et al. 2008). The mid-infrared (mid-IR) does not have these problems, and its overall correlation with total IR luminosity (LTIR) makes it a good indicator of the total SFR of most galaxies (Rieke et al. 2009). Still, the mid-IR probes only obscured star formation, which means it can underestimate the SFR in galaxies with low levels of star formation, where there is less dust and less extinction (Kennicutt et al. 2009; Rieke et al. 2009; Calzetti et al. 2010). Using only one type of star formation indicator, therefore, only tells us part of the story. To get an unbiased picture, we need to estimate the total amount of star formation in galaxies—obscured and unobscured—and probe down to the very lowest SFRs.
Additionally, we also need to study a cluster that is not in the process of forming or merging with other clusters or groups. Though all clusters and groups are constantly accreting new galaxies from the field (Colless & Dunn 1996), large numbers of infalling galaxies (i.e., significantly higher than the infall rate of a typical relaxed cluster) can obscure the overall effect of the dense environment on member galaxies. The higher fraction of star-forming galaxies in the field, as well as triggered star formation from galaxies falling into the cluster potential, can make cluster members appear more like field and/or group galaxies than what, perhaps, the cluster would be in a few gigayears (e.g., Beijersbergen et al. 2002; Cortese et al. 2008; Mahajan et al. 2010). If we want to focus on what effects dense environments have on galaxies, we need to observe stable, relaxed clusters.
A2029 (z ∼ 0.08) seems to be one such cluster. It appears relaxed, with a large brightest cluster galaxy (BCG) at the center, a smooth X-ray profile, and a lack of large substructures (Lewis et al. 2003; Vikhlinin et al. 2005; Bourdin & Mazzotta 2008). Walker et al. (2012) observed the X-ray profile of the cluster to larger radii than studied previously and found a cooler region in the southwest. They suggested this could be an indication of infalling group galaxies, but they did not find an overdensity of galaxies in that region. Deep MIPS 24 μm data are available from the Bai et al. (2007) study of intracluster dust, probing IR luminosities down to low levels. Homogeneous optical spectra were obtained in this work, and there is a pointed Galaxy Evolution Explorer (GALEX) observation of the cluster as well (Hicks et al. 2010), allowing us to combine Hα, IR, and UV measurements into a more complete picture of obscured and unobscured star formation in the cluster. To place our work within a broader context, we compare it with similar results for the Coma cluster.
In Section 2, we discuss our observations and sample selection. Section 3 covers the identification and removal of galaxies detected using our star formation indicators but which are not actively forming stars. Our estimation of SFRs and analysis of star-forming galaxies in both A2029 and Coma are laid out in Section 4. We discuss our results in Section 5, and our conclusions are summarized in Section 6. Throughout the paper, we use the following cosmological parameters: H0 = 70 km s−1 Mpc−1, ΩM = 0.25, ΩΛ = 0.75.
2. SAMPLE AND DATA REDUCTION
2.1. Infrared Observations
Cluster A2029 was originally observed at 24 μm with the Multiband Imaging Photometer for Spitzer (MIPS; Rieke et al. 2004) in 2004 February with a total integration time of 80 s pixel−1. Additional observations in 2005 January to look for faint intracluster emission extended the exposure time to ∼340 s pixel−1 (Bai et al. 2007). While we have 24 μm observations over a larger area, for this study, we focused on the region with the deepest coverage, which covers a smaller area: ∼30' × ∼50'. The images were processed using the MIPS Data Analysis Tool (ver. 2.9; Gordon et al. 2005) as described by Bai et al. (2007).
Sources were initially selected using the IRAF routine DAOPHOT (Stetson 1987) and fluxes from point-spread function (PSF) fitting. Errors were estimated for each source by averaging the sigma-clipped flux of the nearest 30 randomly placed apertures. Sources detected at 3σ or above were considered real sources, while anything below 3σ significance was rejected. All possible sources were visually inspected so as not to include false detections such as high-signal image artifacts.
The DAOPHOT routine occasionally missed faint sources in the field, so we also used SExtractor to identify and extract IR sources. This routine first subtracts the background and filters with a Gaussian function we set to 4'' FWHM. The program also used a deblending routine to separate individual sources and remove any artifacts that may masquerade as sources. We used a 1σ detection threshold to identify and extract all possible sources, though only those above 3σ were retained as true detections. The SExtractor routine was able to identify more low-flux sources than DAOPHOT, though after filtering out active galactic nuclei (AGNs) and other sources (discussed later), few new galaxies were added. Given the better accuracy of this method, we use the SExtractor-selected galaxies in the rest of our analysis. The differences between these two methods are minor, however, and our overall results are independent of the photometry approach.
As a result, the 3σ detection limit was ∼135 μJy, or L24 ∼ 2.6 × 1041 erg s−1 and SFR ∼ 0.03 M☉ yr−1 according to the calibration of Calzetti et al. (2010) at the redshift of our cluster (z ∼ 0.08).
2.1.1. IR Source Matching and Errors
To identify which optical sources have 24 μm emission, we cross-correlated optical and IR catalogs by matching the position of each to within a radius of 3'' (corresponding to ∼4.5 kpc). Although positions at 24 μm are accurate to ≲1'', the MIPS PSF is large (6'' FWHM). This matching radius is small enough to minimize the number of false matches while simultaneously including galaxies with star formation in their outer regions, since areas of star formation can be clumpy and/or asymmetrical with respect to the overall shape of the galaxy, especially in late types.
Incorrectly matched IR sources will occur, however, so it is important to be aware of the errors of our source-matching criteria. First, we noted that four IR sources had been matched to multiple optical galaxies. After viewing optical images of the area, all were easily associated with a specific galaxy and the incorrect optical matches removed. This gives us a rough estimate of our IR/optical source-matching errors of ∼0.8% incorrectly matched sources.
Given that we can detect sources far beyond our cluster redshift and that we would like to have an upper limit on the possible fraction of incorrect matches, we scattered ∼3500 fake source coordinates randomly over the 24 μm image. (This is slightly more fake sources than the number of real sources detected in the 24 μm image but still below the confusion limit.) We combined the real 24 μm source list with this fake source list and matched it to our catalog of cluster and field galaxies with known redshifts. The fraction of galaxies matched to a fake source was much less than 1%. We conclude that the total fraction of 24 μm sources matched to an incorrect optical source is no more than ∼1%.
2.2. Optical Observations
To confirm cluster members spectroscopically, we targeted objects down to r ∼ 20 in the inner 60' of the MIPS field with the Hectospec fiber spectrograph on the MMT at Mt. Hopkins (Fabricant et al. 2005). We used the 270 gpm grating, covering a wavelength range of 3650–9200 Å at a resolution of 6 Å, allowing us to observe the Hα emission line in galaxies out to z ∼ 0.4, far beyond the cluster redshift. The fibers subtend 1 5 on the sky, possibly necessitating aperture corrections for line fluxes. However, our use of continuum photometry for estimating fluxes implicitly includes a first-order aperture correction. The region was observed using two different configurations with three 10 minute exposures each for the bright galaxies and five different configurations with three 15 minute exposures each for the faint ones. The spectra were reduced using the HSRED3 IDL routine. We visually confirmed the redshift of each source using best-fitting templates, resulting in confident redshifts for 1362 objects.
Because 24 μm emission from AGNs can masquerade as star formation, we need to identify possible active galaxies in our sample. HSRED identifies AGNs and QSOs using the following emission line ratios:
(see the HSRED documentation for links and details). We reviewed the spectra by eye and compared the emission lines with classic BPT diagrams (Baldwin et al. 1981; Kewley et al. 2001; Kauffmann et al. 2003) to ensure we were only removing AGNs that were dominating the spectra. A few additional galaxies with exceptionally broad emission lines (but not identified as AGNs by HSRED) were also classified as AGNs and removed.
2.3. UV Observations
We selected far-UV (FUV) sources in the GALEX database4 from the A2029 pointed observation GI3-103 (PI: Hicks) described in further detail in Hicks et al. (2010). The GALEX 1.2 deg field of view, centered on the BCG, includes our entire Hectospec coverage area so that none of our spectroscopically confirmed cluster members lie near the edge of the GALEX image. This 1517 s observation is ∼80% complete down to ∼23.0 mag. Because this completeness limit is for 5σ or brighter sources, our SFRFUV detection limit (0.043 M☉ yr−1) is a conservative estimation.5 We then matched the UV sources with our optical catalog using a 4'' radius.
2.4. Sample Selection
To differentiate cluster members from the field, we used the method of den Hartog & Katgert (1996), who select members based on each galaxy's relative line-of-sight velocity (V − V0, where V0 is the mean cluster velocity) as compared with its projected distance from the center of the cluster. Den Hartog & Katgert (1996) then use the maximum line-of-sight velocity at a given distance from the cluster center to define which galaxies are cluster members and which are interlopers. Figure 1 shows this method for A2029. The maximum line-of-sight velocity is plotted as a pair of dashed lines. Only galaxies within these lines are considered cluster members. To ensure we were as complete as possible, we retrieved all extended sources near the cluster redshift within our 24 μm field of view from the NASA/IPAC Extragalactic Database6 (NED) and the Sloan Digital Sky Survey7 (SDSS). We removed duplicate sources and included the remaining galaxies for identifying cluster members.
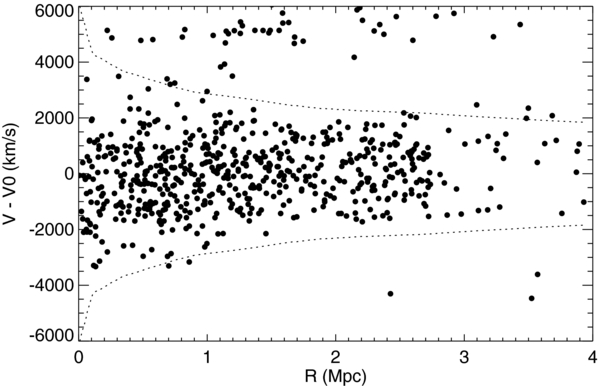
Figure 1. Relative velocity (V) of all galaxies with respect to the cluster mean velocity (V0) as a function of projected distance from the cluster center. Cluster members were selected to be galaxies within the maximum line-of-sight velocity (dotted lines) at a given distance, as per den Hartog & Katgert (1996).
Download figure:
Standard image High-resolution imageAfter removing all non-cluster galaxies and limiting the field sample to galaxies with z ⩽ 0.2, we have a total of 585 cluster galaxies and 239 field galaxies with confirmed redshifts. Of those, 444 cluster members and 148 field galaxies were covered by Hectospec and deep MIPS observations. However, for this study, we did not include any of the NED or SDSS sources in our final sample because it is difficult to identify and correct for selection biases of these galaxies. All cluster members are listed in Table 1; this includes galaxies not explicitly used in our analysis.
Table 1. A2029 Member List
| R.A. | Decl. | z | log (L24 μm) | log (LHα) | log (LFUV) | SFR (min)a | SFR (max)a | log (M*) | Notesb |
|---|---|---|---|---|---|---|---|---|---|
| (L☉) | (L☉) | (L☉) | (M☉ yr−1) | (M☉ yr−1) | (M☉) | ||||
| 227.59595 | 5.6415414 | 0.0768 | ... | ... | ... | ... | ... | 10.06 | ... |
| 227.46886 | 5.6797333 | 0.0808 | ... | ... | ... | ... | ... | 10.59 | ... |
| 227.58581 | 5.8550225 | 0.0812 | 8.44 | 7.46 | 8.61 | 0.711 | 0.711 | 10.02 | ... |
| 227.32547 | 5.5163308 | 0.0793 | 9.38 | 7.49 | 8.54 | 2.185 | 2.185 | 10.64 | ... |
| 227.34391 | 5.5039944 | 0.0752 | 8.47 | 6.75 | ... | 0.242 | 0.242 | 9.95 | ... |
| 227.38376 | 5.5582892 | 0.0731 | 9.07 | 7.06 | 8.16 | 1.007 | 1.007 | 9.90 | ... |
| 227.35787 | 5.5324111 | 0.0739 | 8.06 | 6.35 | ... | 0.094 | 0.094 | 9.67 | ... |
| 227.41070 | 5.6222886 | 0.0799 | ... | ... | ... | ... | ... | 10.06 | ... |
| 227.54800 | 5.4776306 | 0.0786 | ... | ... | ... | ... | ... | 10.29 | ... |
| 227.44500 | 5.6604972 | 0.0835 | 9.20 | 7.51 | 8.85 | 1.713 | 1.713 | 10.07 | ... |
Notes. aIf a galaxy only has Hα or FUV detections (no 24 μm), then the lower limit (min) on SFR is calculated using these wavelengths without dust corrections. The upper limit (max) is calculated using our 24 μm detection limit with Hα (or FUV if Hα is not available). If the min and max values of SFR are the same, then the SFR was calculated using 24 μm and Hα (or FUV if Hα is not available). In these cases, the total SFR includes both obscured and unobscured components from measured quantities. b(0) indicates galaxies without any 24 μm coverage; (1) indicates galaxies from SDSS or NED; (2) indicates passive (non-star-forming) galaxies; (3) indicates galaxies spectroscopically identified as possible AGNs (non-star-forming); (4) indicates galaxies with shallow 24 μm coverage that are not included in the analysis. Galaxies from SDSS, NED, and with shallow 24 μm coverage have not been identified as being passive vs. star forming, and most have not been identified as hosting AGNs or not since most do not have Hectospec coverage.
Only a portion of this table is shown here to demonstrate its form and content. A machine-readable version of the full table is available.
Download table as: DataTypeset image
3. PASSIVE EARLY-TYPE GALAXIES
Not all IR- or UV-emitting galaxies are forming stars, especially in the case of early-type galaxies (which are common in dense environments). Old stellar populations can be sources of both IR and UV emission. During the asymptotic giant branch phase of stellar evolution, stars lose mass via stellar winds, creating a shell of dusty material around them that absorbs radiation from the star and re-emits it in the IR (Habing 1996; Piovan et al. 2003). Similarly, while bright UV sources often signify star formation in galaxies, faint UV emission has been connected with extreme horizontal branch stars (O'Connell 1999; Boselli et al. 2005). IR and UV emission from non-star-forming early-type galaxies has been studied extensively in recent years (e.g., Bregman et al. 1998; Xilouris et al. 2004; Boselli et al. 2005; Bressan et al. 2006; Ko et al. 2009; Temi et al. 2009; Young et al. 2009; Shim et al. 2011).
If we want to understand how dense environments affect galactic star formation, then we need to be certain we are probing the population of galaxies currently forming stars. Due to the morphology–density relation, clusters have much higher fractions of quiescent early-type galaxies than the field, which means we could be including a significant population of non-star-forming galaxies if we are not careful in our selection criteria.
3.1. The Passive UV- and IR-emitting Galaxy Population
For all non-AGN cluster galaxies not detected in Hα but detected in at least one other star formation indicator, 14 are only detected at 24 μm, 16 are only detected in the FUV, and 24 are detected in both. We examined these galaxies more in-depth to identify whether they are truly star forming or if they are merely quiescent sources.
Figure 2 shows the typical optical spectra (rest frame) of these 54 FUV- and/or IR-detected galaxies, with the Hα wavelength identified by a vertical dashed line. All of the galaxies' spectra (including the ones not shown here) are reminiscent of early-type galaxies. Other than the sky lines, the only obvious features are hydrogen and Ca H and K absorption lines; a few of the spectra shown also have [N ii] λ6583 emission lines. They do not look like star-forming galaxies at all.
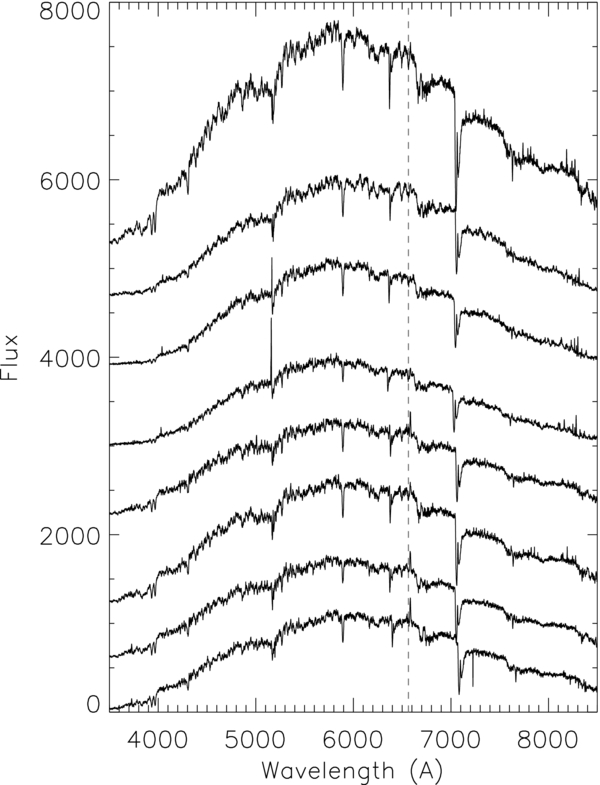
Figure 2. MMT Hectospec redshift-corrected optical spectra of a portion of the 24 μm detected galaxies without Hα emission. The vertical dashed line indicates the wavelength of the Hα line. While some sources have [N ii] λ6583 emission, none show any star formation or obvious AGN activity that could account for the 24 μm emission.
Download figure:
Standard image High-resolution imageHowever, the Hectospec fibers subtend 15 on the sky, which means for the larger galaxies, we may only be probing the central bulges and missing star formation in the outer regions of the galaxies. If we look at optical images of this population from SDSS (Figure 3), we see that nearly all have early-type morphologies (E/S0). Some could be edge-on spiral galaxies, but given their red colors and the lack of any indications of star formation in their spectra, they seem to be completely passive. Only a handful show blue disks or spiral arms indicative of ongoing star formation; we classified these as true star-forming galaxies, while the rest were identified as being passive/quiescent.

Figure 3. SDSS multi-color images of a subset of galaxies only detected at 24 μm or in the FUV (not to scale). Most of the sources look like early-type E or S0 galaxies or passive early-type spirals.
Download figure:
Standard image High-resolution image3.2. Identifying the IR/FUV Emission Source
Forty-one of the original 54 galaxies only detected in the IR and/or FUV appear to be quiescent; if they truly are not forming stars, then what is the source of this emission? We previously covered some of the possibilities, but we would like to understand the source of the IR or FUV emission to be sure we are not excluding galaxies that may be forming stars at very low levels.
First of all, due to the large size of the 24 μm PSF, it is possible that the IR source is offset from the galaxies enough to cast doubt in terms of the 24 μm matching. While we estimated the matching criteria errors previously, the IR emission could still be from a nearby source. We investigated this possibility for the passive early-type galaxies, and most agreed in position almost exactly with their optical source. The few galaxies whose IR emission was visually identified as possibly coming from a companion object were assumed not to be detected at 24 μm.
Now that we are certain the 24 μm emission originates with the early-type galaxies, we can attempt to identify the source. Temi et al. (2009) use KS-band luminosity compared with L24 to identify both passive and star-forming early-type galaxies in the local universe. Figure 4 is our re-creation of the first plot of their Figure 1. We matched our cluster galaxies with those from the 2MASS extended and point-source catalogs and plotted them as black squares (passive galaxies) and gray squares (all other cluster members). The dashed line is our 24 μm detection limit at the redshift of the cluster. Temi et al. (2009) split their sample into blue (U − V < 1.1; blue circles) and red (U − V > 1.1; red circles) early types. Green circles indicate galaxies without available U and/or V colors, and green triangles indicate 24 μm upper limits. Temi et al. (2009) found a strong relation between  and L24 for red early-type galaxies with no apparent star formation (i.e., 24 μm emission is from old stars and not star formation or AGNs; solid black line). Our own passive early types mostly fall on or very close to the relation, indicating that the IR emission in these galaxies is dominated by the old stellar population rather than AGNs or ongoing star formation. If we convert our SDSS data to UBVRI colors (using KCORRECT; Blanton & Roweis 2007), all but two of our galaxies would easily fall in the Temi "red" galaxy sample; indeed, most are much higher than the Temi et al. (2009) U − V limit. A few of our passive galaxies lie significantly above the truly passive relation, but like the rest of the sample, they appear to be normal early-type galaxies with no emission lines (though some have weak [N ii] λ6583). The two early-type galaxies with the highest offset from the passive relation (also the least massive) do have blue colors (U − V < 1.1), but this could be due to AGNs. Since the nature of the 24 μm emission in these galaxies remains unknown, they remain in the "passive early-type" list. Even if they were truly star-forming galaxies, however, they would not affect our results.

Figure 4. 24 μm luminosity vs. KS luminosity for the IR-detected, passive early types in A2029 (black squares) and other cluster galaxies (gray squares). Our 24 μm detection limit is shown by the dashed line. All other points are from the Temi et al. (2009) sample of nearby early-type galaxies, including those with the following optical colors: U − V < 1.1 (blue circles), U − V > 1.1 (red circles), no U − V color data (green points), and 24 μm upper limits (triangles). Temi et al. (2009) found a strong trend (solid black line) with red early-type galaxies whose IR emission is dominated by the old stellar population as opposed to an AGN or any other source of 24 μm emission. Most of our passive cluster galaxies fall on or near this trend; similarly, their optical U − V colors are all well above the 1.1 limit (except for the two lowest-mass galaxies with the highest offset from the relation). This suggests that the IR emission from the passive early-type galaxies is likely to be dominated by dust around old stars.
Download figure:
Standard image High-resolution imageThough the IR emission from most of the passive A2029 galaxies seems to be from dust around old stars, weak AGNs could also be contributing. We removed the obvious AGNs from our sample already, but we could have missed low-luminosity AGNs. Inspection of our optical spectra reveals what could be faint [O iii] λ5007 emission lines in some of our IR early types, but this is hardly conclusive. Most of these galaxies are also detected in the FUV, which could be coming from AGNs (e.g., Agüeros et al. 2005), though, as mentioned previously, it could also be coming from old stars or recently quenched star formation (e.g., Greggio & Renzini 1990; Cortese et al. 2005; Yi et al. 2005; Donas et al. 2007; Atlee et al. 2009; Choi et al. 2009).
Instead, we can turn to X-ray observations of the cluster. Deep Chandra and XMM-Newton images from the central region of the cluster cover most of the 41 IR/FUV early-type galaxies we previously identified as not forming stars. Four are clearly detected in X-rays, implying that AGNs are likely responsible for the IR/FUV emission in at least some cases. It is also possible that some have low-luminosity AGNs that are too faint in X-rays to be detected in these observations. Additionally, the galaxies closest to the cluster center may not be detected due to their proximity to the bright X-ray gas of the cluster itself.
In conclusion, there are a variety of non-star-forming mechanisms that can produce low levels of IR and/or FUV emission in early-type galaxies. Generically, it appears that extremely low or nonexistent levels of star formation allow other IR and FUV sources that are usually hidden to dominate. Independent of the actual mechanism for the 24 μm and FUV emission in these passive early-type galaxies, it is highly unlikely to be from ongoing star formation. In total, 41 of the 153 galaxies detected using at least one of the three star formation indicators do not appear to be actively forming stars. This is 27% of the detected galaxies—not an insignificant fraction! This means that for SFR ≲ 1 M☉ yr−1, one must be careful when using only a single indicator (UV or IR) for identifying star-forming galaxies.
4. ANALYSIS OF STAR-FORMING GALAXIES
4.1. Estimating SFRs and Stellar Mass
Now that we have identified the galaxies in the cluster currently forming stars, we can estimate their SFRs and study how the dense environment of A2029 has affected these galaxies over time. For all sources detected at 24 μm, we calculated the monochromatic 24 μm luminosity (L24) with the general relation between flux and luminosity (νFν) using the luminosity distance. Hα luminosities (LHα) were calculated using the Hα equivalent width along with the continuum magnitude, which was estimated by linearly interpolating between the SDSS r- and i-band magnitudes to the Hα rest-frame wavelength. The linear behavior of the SEDs of these galaxies at r, i, and z (and sometimes g) makes linear interpolation appropriate in this case. For the few sources without SDSS observations, we simply use the r-band magnitude, which is not significantly different from the interpolated magnitude for most sources. Additionally, because our field galaxy sample only contains objects out to z ∼ 0.2, this method can be used for all field galaxies as well since Hα does not redshift beyond the i band until z ∼ 0.4. The equivalent widths were calculated by linearly fitting the continuum within 200 Å of the emission line and fitting a Gaussian to the Hα line on top of the continuum fit. All fits were visually checked; those where the continuum and/or Hα line were fit poorly by our automated routine were then fit manually (using the same method) so as to make the measurements as accurate as possible. The errors of these manually fit lines were modified to reflect the higher uncertainty in the fits.
Hα and emission by warm dust at 24 μm are both powered predominantly by very young stars in normal star-forming galaxies—see Calzetti et al. (2010, and references therein). We use their equations to convert 24 μm and/or Hα luminosities to total SFRs. As required by Calzetti et al. (2010), for galaxies with both 24 μm and Hα measurements, we used unobscured (uncorrected) LHα. For sources with only Hα detections and no 24 μm, we had two options: for a lower limit on the SFR (i.e., the unobscured component), we used the same conversion but without the IR contribution; as an upper limit, we added in our 24 μm detection limit for the IR component. Although the very low SFRs of the Hα-only detected sources suggest that the obscuration in these systems is insignificant, if we include the 24 μm upper limits, only about half of the SFRs of these galaxies remain reasonably unaffected; the other half change more significantly, indicating there could be a considerable obscured component for some sources. Despite this, we chose to display the non-corrected Hα SFRs in our figures unless stated otherwise; using the upper limits does not change our conclusions.
For estimating the Hα detection limit, however, we need to take into account the host galaxy's luminosity. Bright galaxies tend to have lower specific SFRs (SFR/M*) than faint ones, so as a galaxy's luminosity increases, the stellar continuum increases in brightness faster than the Hα (Boselli et al. 2001; Brinchmann et al. 2004). This means that our Hα detection limit will change depending on the luminosity of the galaxy. Therefore, we estimated the detection limit using LHα of the brightest galaxies in the r band and converting them to SFRs using the methods already discussed. All but a few of the Hα-detected galaxies are above our limit (∼0.07 M☉ yr−1), and ∼ 90% of all galaxies in the cluster are fainter in the r band than the galaxies used to calculate the detection limit, giving us an estimate of the completeness limit of our Hα-detected galaxies as well.
The UV (and far-IR) emission of a galaxy is often powered by somewhat older (and later) stars than the emission in Hα and at 24 μm. The evolution of cluster galaxies may be fast enough to modify the calibration of the SFR in the UV (e.g., Boselli et al. 2009). However, these effects are not well calibrated, so we calculated UV SFRs based on field galaxy behavior. We corrected the FUV (1350–1780 Å) luminosity for obscuration effects using L24 (for sources with both UV and IR detections) from Zhu et al. (2008). Then we used the method of Kennicutt et al. (2009) to convert this FUV luminosity to an SFR. For late-type galaxies only detected in the FUV (not 24 μm or Hα), as with Hα-only detected objects, we use the same conversion to SFR but without the 24 μm component, resulting in a lower limit on the SFR (i.e., the unobscured component). If we compare our unobscured SFRHα with the unobscured SFRFUV (for objects with detections in both), the scatter is larger, though the SFRHα tends to be higher than the SFRFUV. As with the Hα measurements, if we correct the UV-only SFRs with our 24 μm detection limit (resulting in an upper limit on the SFR), our conclusions do not change.
Stellar masses were estimated using the KCORRECT (ver. 4.2) routine SDSS_KCORRECT, which calculates mass using template and model fits with SDSS photometric data (see Blanton & Roweis 2007 for details). KCORRECT uses a different IMF and different cosmological values than we use (Kroupa 2001), so we corrected the original stellar mass output to the IMF and cosmology adopted in this paper.
4.2. Galaxy Distribution
We now look at the distributions of star-forming galaxies in the cluster. The locations of these galaxies can be an indicator of star formation suppression with respect to density. Indeed, other galaxy properties can vary with respect to cluster-centric distance, such as H i gas content (e.g., Cayatte et al. 1990; Solanes et al. 2001; Gavazzi et al. 2005, 2006), SFR (e.g., Lewis et al. 2002; Gómez et al. 2003; Bai et al. 2009; Edwards & Fadda 2011), and morphology (e.g., Melnick & Sargent 1977; Dressler 1980; Whitmore et al. 1993; Goto et al. 2004).
Figure 5 is a histogram of the projected radius (in Mpc) of all galaxies in A2029 (black solid line), all star-forming galaxies regardless of detection method (blue hashed bins), and the non-star-forming IR/FUV early-type galaxies (red hashed bins). The star-forming galaxies appear to be somewhat evenly distributed, while the passive galaxies are more concentrated closer to the center of the cluster.
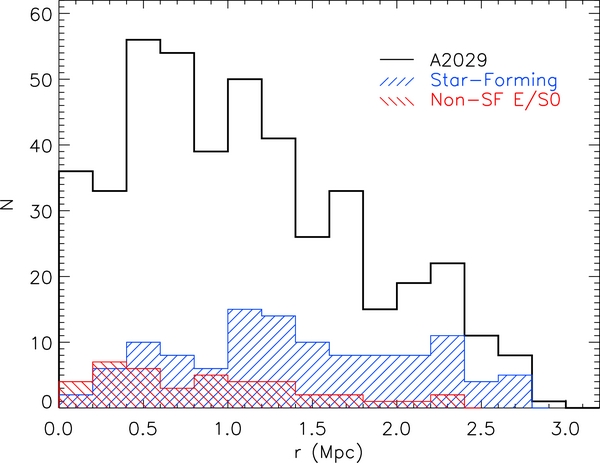
Figure 5. Histogram of all cluster galaxies (black solid line), all star-forming galaxies regardless of detection method (blue hashed bins), and the 24 μm and FUV-detected non-star-forming early-type galaxies (red hashed bins). The distribution of star-forming galaxies is mostly independent of radius, while the non-star-forming early types tend to favor small radii. If we model the star-forming galaxies as being uniformly distributed outside of the core (>1 Mpc), we get a more constant overall distribution, similar to what is shown here. This indicates that the star-forming population lies mostly outside the cluster core, where star formation should be quenched more efficiently than the outskirts regardless of the suppression mechanism. Non-star-forming early-type galaxies are probably more concentrated toward the center of the cluster due to the mass–morphology relation.
Download figure:
Standard image High-resolution imageThese trends could be biased by projection effects, however. To test this, we fit the overall galaxy distribution with a Navarro, Frenk, and White profile (NFW; Navarro et al. 1996) and created fake clusters with ∼500 galaxies randomly arranged in three-dimensional space according to the distribution. We then took the same fraction of star-forming galaxies as in A2029 (∼29%), placed them throughout the cluster, and created histograms of their projected radius. We ran this simple simulation hundreds of times and averaged the results. First, we distributed a star-forming galaxy population uniformly throughout the cluster, resulting in these galaxies having a similar (NFW) profile to the overall cluster population. Then, we distributed the same population uniformly beyond 1 Mpc from the center. This resulted in a relatively constant projected radial distribution, indicating that the ∼1 Mpc radius central region of the cluster is mostly devoid of star-forming galaxies. The lack of star-forming galaxies in the dense core of the cluster, as well as the increasing fraction of star-forming galaxies with increasing projected radius, suggests that the suppression mechanism becomes more efficient as the local density increases. Others have found similar results (e.g., Bai et al. 2009; Mahajan et al. 2010). The slight increase in the IR/FUV early-type galaxies toward the center of the cluster is likely due to the morphology–density relation (and, similarly, the mass–density relation).
4.3. SFR Function
Luminosity functions have been used frequently to study the overall distribution of galaxies emitting light at different wavelengths and luminosities. However, we are studying SFRs of galaxies detected using a variety of methods, making individual luminosity functions untenable. Instead, we have created SFR functions combining all of our detection methods. Our SFR functions are corrected for spectroscopic completeness, which was calculated by taking the number of sources with spectroscopic redshifts in a given r-band bin and dividing it by the total number of photometrically identified extended sources in each bin. The reciprocal of these values is the correction factor. We interpolated between these values given each source's r-band magnitude. The 24 μm detections are already 80% complete at the IR detection limit, and the vast majority of our 24 μm detections are far above this limit, so we do not correct for the incompleteness of IR source detections.
We created an SFR function by plotting all cluster galaxies in terms of their detection method (Figure 6). Galaxies only detected at 24 μm, Hα, or FUV are indicated by orange open triangles, blue open stars, or purple open squares, with detection limits shown by the orange dashed line, blue dot-dashed, and purple dotted line, respectively. The green open circles indicate sources detected at both Hα and 24 μm, and the red down-pointing triangles are galaxies detected with both FUV and 24 μm. The black filled circles are all sources, regardless of detection method, with Poisson errors. (Lines connecting the data points are used only to help guide the eye.)
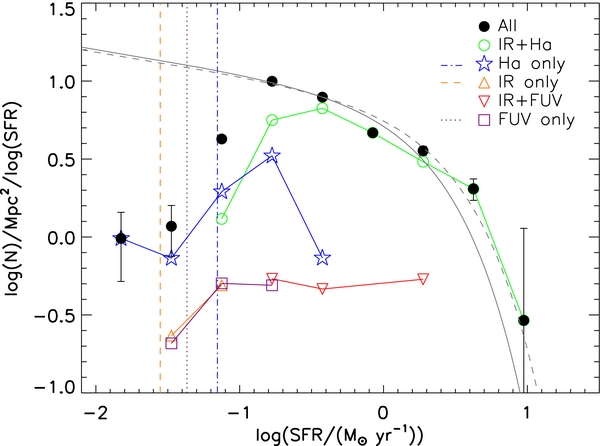
Figure 6. SFR function for all star-forming galaxies regardless of detection method. Galaxies only detected with Hα, 24 μm, or FUV are plotted as blue stars, orange upward-pointing triangles, and purple squares with their detection limits plotted as a vertical blue dot-dashed line, orange dashed line, and purple dotted line, respectively. The green open circles indicate sources detected at both Hα and 24 μm, while the red downward-pointing triangles are galaxies detected with both FUV and 24 μm. The black filled circles are all star-forming galaxies combined. (The sharp dropoff of galaxies at low SFRs is the result of a selection bias.) The gray dashed line is the multi-cluster composite Schechter function from Bai et al. (2009) normalized to A2029 using χ2 minimization. The solid gray line is the best-fit Schechter function using the same multi-cluster faint-end slope and allowing SFR* to vary. Both fits are comparable given the error bars, and both fit A2029 reasonably well.
Download figure:
Standard image High-resolution imageBecause we do not have sufficient data at the faint end to constrain the shape of our SFR function, we use the faint-end slope of previous studies to compare with A2029. The dashed gray line in Figure 6 is the multi-cluster composite Schechter function from Bai et al. (2009), normalized to A2029 using a χ2 minimization routine. We then fit a Schechter function to our cluster using the same faint-end slope but allowing SFR* to vary (solid gray line). This results in log(SFR*/(M☉ yr−1)) ∼ 0.34 ± 0.04, a lower value than the composite, which is ∼0.47 , converted to SFR using our method and evolved to our cluster redshift using Le Floc'h et al. (2005). However, given the error bars and the overall fits to the data, both Schechter functions are comparable and reasonably good representations of A2029.
The Bai et al. (2006, 2009) studies only use 24 μm detections for their luminosity functions, though. To directly compare their Coma and A3266 composite luminosity function with our cluster, we plotted a total IR luminosity (LTIR) function for A2029, shown in Figure 7. We estimated LTIR using Rieke et al. (2009), which was shown in Bai et al. (2009) to be comparable to their own template-fitting method for estimating IR luminosity and SFRs. The black filled circles are for all 24 μm detected cluster members, while the blue triangles only include IR sources identified as actively forming stars. The vertical dashed black line indicates the 24 μm detection limit; we do not use the data point below this limit in any fits. The dashed and solid red lines show the best-fit Schechter function from the Bai et al. (2009) composite luminosity function normalized to all 24 μm emitting A2029 galaxies and only 24 μm emitting galaxies forming stars, respectively. The composite Schechter function is a reasonable fit in both cases. Even if Coma and A3266 also have a population of non-star-forming 24 μm galaxies that were included in the luminosity functions of Bai et al. (2009), the IR luminosities of the galaxies are low enough that they would be below our completeness limit for A2029. In other words, accidentally including non-star-forming 24 μm galaxies in Coma and A3266 does not change the similarities between their luminosity function and that of A2029. All three clusters can be fitted by the same luminosity function, found by Bai et al. (2009) to be very similar to the field luminosity function as well.
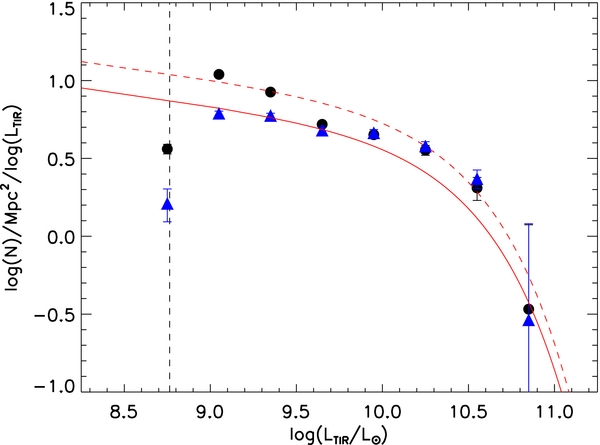
Figure 7. Luminosity function for all 24 μm detected galaxies in A2029 (black circles) and only 24 μm detected galaxies actively forming stars (blue triangles). The vertical black dashed line indicates the 24 μm detection limit. The best-fit Schechter function for the Bai et al. (2009) composite cluster normalized to A2029 using χ2 minimization for all 24 μm sources is shown by the red dashed line, while the same fit normalized to the star-forming galaxies is shown by a solid red line. The composite Schechter function fits the A2029 data reasonably well in both cases.
Download figure:
Standard image High-resolution imageOur SFR function has a turnover at log(SFR) ≲ −0.8, which we found to be due to a selection effect. For our spectroscopy, we only targeted galaxies with r ⩽ 20 mag, which will automatically filter out low-mass galaxies. This effect can be seen in Figure 8, where we compare the stellar masses of the galaxies with their total SFRs (IR, Hα, and/or FUV). Symbols connected by lines indicate galaxies detected at Hα or FUV (but not 24 μm), where the lower value is for Hα or FUV SFRs only and the upper values include our 24 μm detection limit. A2029 galaxies are shown as red circles, and field galaxies are shown as blue stars. Galaxies with no detected star formation indicator are plotted as downward arrows, indicating that these points are upper limits (based on our 24 μm detection limit). The dashed line is our approximate mass-dependent Hα detection limit for the cluster. If we look at all of the quiescent galaxies, we seem to be complete in mass only down to log(M*) ∼ 9.7. Some of the galaxies are lost due to the r-band magnitude limit, but many could be due to an inability to identify redshifts. It is difficult to determine the redshifts of quiescent galaxies because of their lack of emission lines; this is even harder for faint galaxies. Star-forming galaxies, on the other hand, have bright emission lines, making it much easier to measure their redshifts (as can be seen in the figure). We estimate that for r ∼ 19.5 mag star-forming galaxies, we are complete in mass down to at least log(M*) ∼ 9.0, if not lower. However, the greater difficulty in measuring redshifts accounts for the higher mass completeness limit for quiescent galaxies. Given what we know of our completeness in the star formation indicators, we estimate that our SFR function is complete down to log(SFR) ∼ −1.0.
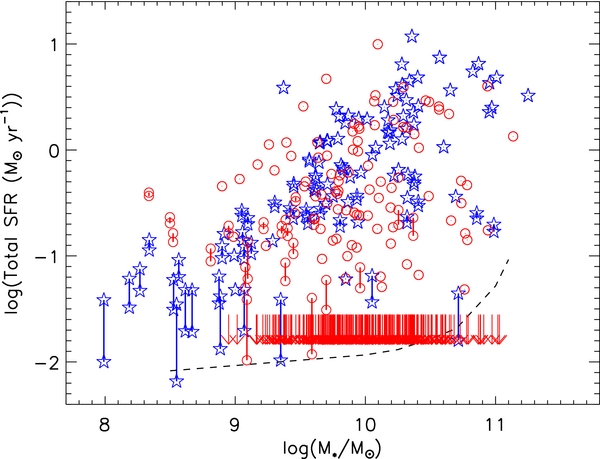
Figure 8. SFR vs. stellar mass (M*) for A2029 (red circles) and the field (blue stars). Connected points indicate galaxies with SFRs calculated from uncorrected Hα/FUV only (lower limits) and uncorrected Hα/FUV combined with our 24 μm detection limit (upper limits). Red arrows indicate the upper limit of star formation for quiescent galaxies (i.e., the 3σ IR detection limit). The dashed line is our approximate mass-dependent Hα detection limit for A2029. The cluster has a similar mass–SFR relation as the field down to log(SFR) ∼ −0.07, where the field becomes incomplete due to the redshift selection criteria for the field. Our mass limit for star-forming galaxies is estimated to be log(M*/M☉) ∼ 9, while the limit for non-star-forming galaxies is closer to 9.7.
Download figure:
Standard image High-resolution image4.4. Mass–SFR Relation
Let us look more closely at Figure 8. Recall that red circles are galaxies in the cluster and blue stars are field galaxies (note that our field sample is incomplete below log(SFR) ∼ −0.07). Open symbols connected by lines indicate galaxies with FUV or Hα detections but no 24 μm detections. The lower and upper limits in SFR for these sources are indicated by the unobscured SFR (FUV or Hα only) and maximum SFR (FUV or Hα corrected with the 24 μm detection limit), respectively. Overall, the star-forming galaxies in the cluster and field are comparable where the field is complete. The quenching process in this cluster appears to be primarily responsible for a larger proportion of quiescent galaxies, not a change in the mass–SFR relation for the active galaxies.
To quantify the mass–SFR distribution of cluster galaxies, we need to know the mass–SFR relation for the field and minimize any systematic differences between the field and our cluster. We adopted the relation of Brinchmann et al. (2004), who found a strong correlation between stellar mass and SFR for a large sample of field galaxies. Up to log(M*/M☉) ∼ 10.5, this relation is linear; the SFRs of higher-mass galaxies drop off and become more uncertain due to lower numbers of galaxies and the larger proportion of early types at high mass. We extrapolate the relation above log(M*/M☉) = 10.5 to represent only the late-type population (as is also done by Elbaz et al. 2007). To avoid this region, and because of our completeness limit, we only compare galaxies in the mass range 9.5 ≲ log(M*/M☉) ≲ 10.5. The mode of the Brinchmann et al. (2004) relation follows the distribution of star-forming galaxies, so we use the mode as the basis of our field comparison.8
To minimize any systematic differences between Brinchmann et al. (2004) and our study, we calculated the SFR and stellar mass in the same manner as A2029 for Hα and 24 μm detected galaxies from the Boötes field (Rujopakarn et al. 2010; not including AGNs) and combined it with our own field galaxies. We then fit a line to the mode of the Brinchmann et al. (2004) relation and normalized it to our combined field sample. Our result can be seen in Figure 9. Our field galaxies are blue stars, the Boötes sample galaxies are black triangles, and the galaxies used in the fitting (i.e., in the region of the plot where these samples are the most complete) are circled in red. This normalized Brinchmann et al. (2004) relation is shown by the black dashed line; we will refer to it as the overall "field relation" from now on. We plotted the Elbaz et al. (2007) field relation (for blue SDSS galaxies at z ∼ 0) as a green dotted line for comparison.

Figure 9. Total SFR vs. stellar mass for our field sample (blue stars) and Hα and 24 μm detected galaxies from Boötes (black triangles; Rujopakarn et al. 2010). SFRs and stellar masses were calculated in the same manner as for A2029. The red circled points indicate the galaxies in the region of the plot that is complete in stellar mass and SFR. We normalized the linear region of the Brinchmann et al. (2004) mass–SFR relation to our complete field to minimize any systematic differences between the two samples. The dashed black line is the result. The green dotted line is the relation for blue SDSS galaxies at z ∼ 0 from Elbaz et al. (2007) for comparison.
Download figure:
Standard image High-resolution imageEarlier, we compared A2029's SFR function with the Coma cluster; it would be prudent to compare both clusters' mass–SFR distributions to the field as well. While many groups have studied Coma using multiwavelength data that are now publicly available (e.g., Iglesias-Páramo et al. 2002; Gavazzi et al. 2003, 2006; Cortese et al. 2008; Hammer et al. 2012), we chose to utilize the recent results from Edwards & Fadda (2011) due to their observations being similar to those we have for A2029. Additionally, Edwards & Fadda (2011), unlike the previous studies, were able to disentangle the Hα line from the surrounding [N ii] lines, which is necessary for accurately estimating SFRs.
Figure 10 shows the same total SFR versus stellar mass as Figure 8, including Coma (blue filled triangles; Edwards & Fadda 2011) with A2029 (red filled circles). We included Coma galaxies with both 24 μm and Hα detections; only a few Coma galaxies with spectra are not detected at Hα (probably because only galaxies detected at 24 μm were targeted). We calculated total SFRs for Coma in the same way as for our cluster. A subset of the Coma galaxies was listed in SDSS, allowing us to compare our method for estimating stellar masses with theirs. Because the two techniques resulted in masses within a factor of two for most of the galaxies, we use the masses listed in Edwards & Fadda (2011) for all Coma galaxies. The horizontal dotted line is our 24 μm SFR detection limit. While the Coma 24 μm detection limit is much lower than A2029, the Hα detection limit should be comparable to ours.

Figure 10. SFR vs. stellar mass for A2029 (red circles) and Coma (blue filled triangles; Edwards & Fadda 2011). Larger blue filled triangles are AGNs (see the text). The IR detection limit for A2029 is shown as a horizontal dotted line; the Hα detection limit for both clusters should be comparable. The mode of the overall mass–SFR relation (normalized to a sample of field galaxies; see the previous figure) is shown as a dashed line (Brinchmann et al. 2004). Coma seems to have more massive, low-star-forming galaxies than A2029, which follows the field relation fairly well.
Download figure:
Standard image High-resolution imageA2029 and Coma seem mostly to follow the field relation, though Coma appears to have a larger number of high-mass, low-star-forming galaxies. This is easier to see in Figure 11, where we show the SFR offset between the cluster galaxies and the field for 9.5 ≲ log(M*/M☉) ≲ 10.5. The solid black line is the distribution of field galaxies at these masses (Brinchmann et al. 2004), while the red dashed line and blue dotted line are the distributions of A2029 and Coma galaxies, respectively. A2029 follows the field very closely, while Coma has more low-SFR galaxies than either the field or A2029, as we noted earlier. In addition, due to the targeting of IR-bright galaxies for spectroscopy (Edwards & Fadda 2011), massive quiescent galaxies are missing from the Coma sample. The detection limit for both clusters (vertical dashed line) is log(M*/M☉) = 9.5. The incompleteness slowly increases for masses further below this limit. A completeness-corrected version of the figure is discussed later.

Figure 11. Offset from the Brinchmann et al. (2004) field relation (black line) for A2029 (red dashed line) and Coma (blue dotted line) for all star-forming galaxies at 9.5 ≲ log(M*/M☉) ≲ 10.5, normalized by the total number of galaxies in each histogram. The vertical dashed line is our completeness limit given the detection limit at log(M*) = 9.5. A2029 closely follows the field, while Coma has a large population of galaxies that fall below the field relation.
Download figure:
Standard image High-resolution imageOne issue with the Coma SFRs is the Hα aperture corrections (Edwards & Fadda 2011). The size of the spectral fibers used for Coma tends to be smaller than the galaxies themselves, indicating that some Hα luminosity is lost. Edwards & Fadda (2011) estimate corrections for this lost light based on the galaxy continuum photometry and state that the median aperture correction is ∼2, though some can be as high as 10.
Because the star-forming regions are likely to be distributed differently from the optical continua, we test the effects of different aperture corrections. Figure 12 shows the field (black dashed line) and Coma (blue solid line) distributions with aperture correction factors of one (no correction), two, four, and eight. These plots show that even with the most extreme correction, the population of low-star-forming galaxies is still readily apparent. This population of star-forming galaxies is clearly real and not from losing Hα due to fiber size.
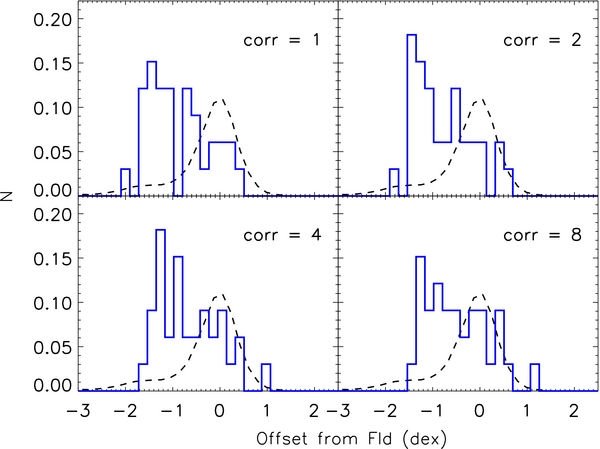
Figure 12. Testing different Hα aperture corrections for Coma star-forming galaxies by imposing correction factors of 1 (no correction), 2, 4, and 8. The black dashed line represents the distribution of field galaxies compared with the mode (zero offset), while the blue line is the distribution of star-forming galaxies in Coma. Even for the highest correction factor (which would only be needed for a handful of galaxies), there still exists the population of galaxies with SFRs significantly below the field, indicating that this population is real and not a result of missing Hα due to the fiber aperture size.
Download figure:
Standard image High-resolution imageTo demonstrate that the correction should be no larger than a factor of two (the median aperture correction as reported by Edwards & Fadda), we carried out another test. The 24 μm fluxes represent the total star formation over the full galaxy (beam of 6'', extended emission captured to first-order through SExtractor), and we can compare them with the Hα measurements to see if there is a tendency for the latter to be systematically too small. For this test, we used the SINGS sample, for which integrated 24 μm and Hα fluxes are available (Kennicutt et al. 2003). We restricted the test to galaxies with SFRs between 0.1 and 1 M☉ yr−1 to have good statistics and comparable SFRs in the samples. We found that there was no significant difference between the SFR24/SFRHα for the Coma galaxies (mean 10, median 4) and the SINGS galaxies (mean 8.6, median 6.8), suggesting that for most of the Coma Hα measurements, only small aperture corrections (if any) may be needed.
Despite that the other Coma studies previously mentioned did not separate Hα and [N ii], we can use them as an additional check on aperture effects. The available data from Edwards & Fadda (2011) include [N ii] λ6583; given our own spectra, we can safely assume that [N ii] λ6548 tends to be approximately 50% of the longer-wavelength [N ii] λ6583 line. We combined the fluxes of the three lines and compared the Edwards & Fadda (2011) values with the blended Hα/[N ii] fluxes from Iglesias-Páramo et al. (2002), GOLDMine (Gavazzi et al. 2003), and Gavazzi et al. (2006), for all overlapping Coma galaxies. (We focused on GOLDMine since it has the most complete sample and highest number of overlapping sources.) The blended GOLDMine line fluxes were an average of ∼2 times higher (median ∼2.5) than the combined Hα/[N ii] lines from Edwards & Fadda (2011). Since the dominant difference between the two studies should be due to aperture corrections, this supports the median aperture correction of 2 that Edwards & Fadda (2011) cite in their study (and that we have chosen to use here).
In the case of A2029, the projected fiber diameters are already about twice those for Coma, and our use of continuum photometry to convert equivalent widths to line fluxes implicitly makes a first-order aperture correction. We therefore make no additional adjustments for the size of the spectroscopic aperture.
4.4.1. Anemic Coma Galaxies
The analysis in the preceding section has identified a population of star-forming galaxies in Coma that fall significantly below the field mass–SFR relation. How are these galaxies different from the other star-forming galaxies?
We extracted the subset of 13 massive (10 ≲ log(M*/M☉) ≲ 10.5) galaxies that lie significantly below the field relation (offset ≲−0.7) for closer study. These galaxies are listed in Table 2. First of all, these galaxies are fairly evenly distributed in terms of projected area in the cluster, which, as we showed earlier with A2029, means most if not all of the galaxies are in the outskirts. Second, almost all are early-type galaxies, with over half being S0s, specifically. None show obvious signs of ongoing merger activity, though some have indications of previous interactions (e.g., rings). We classify this small population of high-mass, low-star-forming Coma galaxies as "anemic," a term defined by van den Bergh (1976) to identify spiral galaxies with abnormally low amounts of gas and star formation as compared with "normal" spirals. Van den Bergh identified the brightest Coma cluster spiral, NGC 4921, as anemic as well, and we include it in our table of anemic Coma galaxies.
Table 2. Anemic Coma Cluster Galaxies
| Catalog ID | R.A. | Decl. | Morphology | log(M*) | Total SFR | AGN? |
|---|---|---|---|---|---|---|
| (M☉) | (M☉ yr−1) | |||||
| ... | 194.48608 | 27.037508 | ... | 10.25 | 0.106 | Y |
| ... | 194.14433 | 27.22756 | S0 | 10.37 | 0.120 | Ya |
| ... | 194.29483 | 27.404902 | Sa | 10.14 | 0.055 | Y |
| ... | 194.65758 | 27.464002 | S0 | 10.35 | 0.049 | Ya |
| MCG+05-31-036 | 194.47652 | 27.490639 | SBb | 10.25 | 0.044 | Y |
| ... | 194.17664 | 27.548255 | S0 | 10.32 | 0.021 | N |
| ... | 194.26768 | 27.730046 | S0 | 10.02 | 0.041 | N |
| MCG+05-31-007 | 193.85438 | 27.798033 | Sp | 10.38 | 0.072 | N |
| IC 4042 | 195.17815 | 27.971266 | SB0 | 10.50 | 0.070 | Y |
| NGC 4907 | 195.20335 | 28.158341 | SBb | 10.49 | 0.060 | Y |
| ... | 196.04228 | 28.247957 | S0 | 10.08 | 0.032 | N |
| MCG+05-31-110 | 195.67002 | 28.371308 | S0/Sp | 10.07 | 0.042 | N |
| ... | 194.56276 | 28.521786 | ... | 10.01 | 0.080 | N |
| NGC 4921b | 195.35896 | 27.885944 | SB(rs)ab | 11.18 | 0.181 | Y |
Notes. Description of columns: (1) catalog ID of the galaxy (if available); (2) and (3) SDSS coordinates; (4) galaxy morphological type as listed by the SIMBAD database; (5) stellar mass, in solar units, adapted from Edwards & Fadda (2011); (6) total SFR using 24 μm and Hα from Edwards & Fadda (2011), calculated using the same method as A2029 (assuming all 24 μm emission is from star formation); (7) flag for whether the galaxy is known to have an AGN or not (most identified via SIMBAD). aWe retrieved 20 cm data from Miller et al. (2009) and found the IR–radio q parameter (q = log(F24/F20 cm)) to be indicative of an AGN. bClassic anemic galaxy in Coma, not identified as anemic in our sample due to its high mass. Morphology from de Vaucouleurs et al. (1991).
Download table as: ASCIITypeset image
Another interesting aspect of these galaxies is that over half were previously identified as hosting an AGN (shown in Figure 10 as larger blue triangles), along with NGC 4921. Indeed, we need to demonstrate that their IR outputs are dominated by star formation, not by AGNs. This possibility could be tested using the diagnostic diagrams proposed by Lacy et al. (2004) or Stern et al. (2005) since both approaches identify AGNs that dominate the mid-IR output of a galaxy by the filling in of the spectral dip near 5 μm by warm dust heated by the AGN. However, the IRAC measurements needed for this diagnostic are available for only two of the anemic galaxies.
Donley et al. (2012) show that the color selection methods are basically equivalent to selecting objects with power-law mid-IR spectra, so we will use an analog of the Lacy/Stern plots using WISE photometry instead. The resulting diagnostic diagram is shown in Figure 13. The dark green line shows the power-law locus, running from indices of −0.25 to −2.25. The green triangles are Seyfert galaxies, divided roughly equally between Type 1 and Type 2 (NGC 1275, 3227, 3516, 3783, 4051, and 4151; Mrk 1, 6, 9, 78, 79, 176, 198, 273, and 348). The red stars are a selection of low-luminosity star-forming galaxies (8 < log(LTIR) < 10; Sanders et al. 2003), and the black square is the color of a low-luminosity star-forming galaxy based on the templates of Rieke et al. (2009). The Coma anemic galaxies are the blue circles. They fall exactly in the locus of the other star-forming galaxies, demonstrating that their mid-IR outputs are dominated by stellar power and that their SFRs are correctly deduced from IR luminosities. We also show the colors of a number of massive early-type galaxies in Coma, selected to be passive with no indications of star formation in their optical spectra (i.e., no Hα emission; e.g., Moss & Whittle 2005; Miller et al. 2009). Two of these galaxies fall in the star-forming zone, indicating that low levels of star formation may have been overlooked in the optical spectroscopy; the remaining 11 galaxies define a distinct locus that shows the behavior of the IR excess in quiescent early-type galaxies. Thus, the properties of the anemic galaxies in the mid-IR are inconsistent with those of AGN-dominated galaxies or of quiescent ones. They do indicate significant levels of star formation.

Figure 13. AGN diagnostic for WISE sources: local Seyferts (green upward-pointing triangles), local starbursts (red stars), star-forming galaxy template from Rieke et al. (2009; black square), and anemic Coma galaxies (blue circles). The dark green line shows the power-law locus, running from indices of −0.25 to −2.25. While over half of the anemic Coma galaxies are known to harbor AGNs, they fall within the star-forming galaxy region using this mid-IR diagnostic, indicating that star formation dominates their IR output. Also plotted are several of Coma's early-type galaxies, most of which also have 24 μm emission (purple down-pointing triangles). The two galaxies in the star-forming locus have evidence of residual star formation, while the others appear completely passive.
Download figure:
Standard image High-resolution imageIt is difficult to determine the prevalence of these high-mass, low-star-forming galaxies in Coma, both because of the AGN contamination and because of the detection limit at log(M*/M☉) ∼ 9. We need to correct for any galaxies we may be missing below our detection limit. We do not have enough data to correct for the incompleteness for galaxies below log(M*/M☉) ∼ 9.5, so we focus on galaxies from 9.5 ≲ log(M*/M☉) ≲ 10.5. For each of the first two bins below offset ∼ −1, we calculate a completeness correction using the ratio of areas and number of sources above and below the detection limit in each bin. The results are shown in Figure 14. The solid black, dashed red, and dotted blue lines (the field, A2029, and Coma, respectively) are the same as in Figure 11 except for the completeness corrections for the clusters. Our new completeness limit, with the corrections, is shown as a vertical black dashed line. Even with completeness corrections, A2029 closely follows the field (though it does have a few low-star-forming galaxies), while the majority of Coma's star-forming galaxies are far below the field distribution.
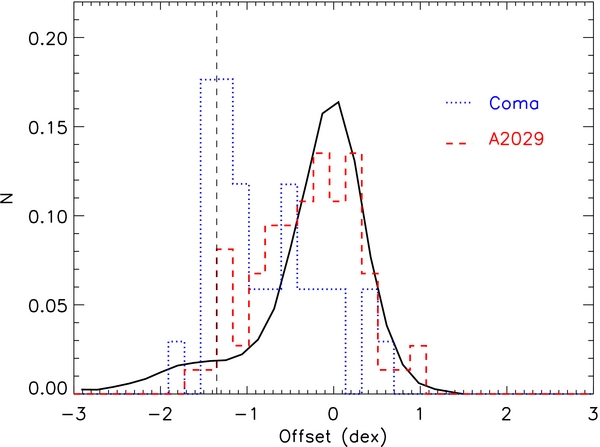
Figure 14. Same as Figure 11, but including completeness corrections for both clusters. The vertical dashed line is the completeness limit for the corrected distributions. Even corrected for missing galaxies, A2029 looks like the field, while Coma retains its population of star-forming galaxies that lie far below the field relation.
Download figure:
Standard image High-resolution image4.4.2. 24 μm Emitting Early-type Galaxies
We also discovered that Coma has non-star-forming early-type galaxies with 24 μm emission, as in A2029. These galaxies are shown in Figures 13 and 15. We collected a sample of 13 normal early-type galaxies in Coma, all of which have WISE and 24 μm coverage but do not have Hα emission. In Figure 13, the WISE colors of these galaxies (purple downward-pointing triangles) indicate that most are indeed passive; only a couple have possible residual star formation.

Figure 15. Same as Figure 4, but including a sample of non-star-forming Coma early-type galaxies with 24 μm emission (yellow stars). These galaxies fall in the same passive region of the plot as our A2029 non-star-forming early-type galaxies, indicating a similar population of galaxies exists in Coma as well.
Download figure:
Standard image High-resolution image
All but two of these Coma galaxies are detected at 24 μm, so we added them to the Temi et al. (2009) plot used earlier to show that the IR emission from passive, early-type A2029 galaxies is mostly from the old stellar population (Figure 15). All points are the same as in the previous plot (Figure 4) except that the only A2029 galaxies we include are the passive early-type galaxies. The Coma galaxies, shown as yellow stars, occupy the same region of the plot as the passive A2029 galaxies, indicating that the IR emission from all of these galaxies is from the same source—old stars—rather than star formation.
5. DISCUSSION
A surprising result from previous studies of rich galaxy clusters is that their IR luminosity functions appear to be very similar to those of field galaxies at the same redshift (Bai et al. 2009), although the fraction of galaxies emitting at a detectable level in the IR is much smaller than in the field. Only by carefully combining measurements of a number of clusters were Atlee & Martini (2012) able to find evidence for a subtle difference between the field and average cluster IR luminosity functions.
However, our more detailed examination of the components of the IR-luminous cluster population shows some interesting features that can be missed in the luminosity function alone. We find that the large proportion of early-type galaxies in dense clusters yields a significant number of such objects that are detected in deep IR surveys but are not forming stars at the indicated level; their IR outputs are probably related to AGNs and mass loss from old stars. These objects must be removed from the luminosity function if it is to be compared correctly with the field.
After removing these objects and correcting for incompleteness, we have shown that the distribution of SFRs in A2029 is nearly identical to that of the field. Since the bulk of this cluster is relaxed and evolved, it appears that its star-forming population has been acquired relatively recently and that there has not been sufficient time to quench the star-forming activity. A2029 does have a few anemic galaxies, but this is unsurprising. Clusters are constantly accreting new galaxies from the field, so while the bulk of A2029's star-forming galaxies appear to have recently joined the cluster, the anemic galaxies have been in the cluster long enough to have had their star formation quenched somewhat.
It is noteworthy that the star-forming galaxies in A2029 are not more active than field galaxies either, since some hypotheses would suggest an increase in activity upon the initial encounter with a dense cluster (e.g., Evrard 1991; Wang et al. 1997; Porter et al. 2008; Mahajan et al. 2012). Even if the outermost gas is removed from a galaxy (on timescales of ∼100 Myr for ram-pressure stripping; Boselli & Gavazzi 2006; Pappalardo et al. 2010), it is thought that the dense molecular clouds could remain and that they might sustain star formation for about 2 Gyr (Boselli & Gavazzi 2006; Bigiel et al. 2011), putting a rough limit on the time since the majority of A2029's star-forming galaxies might have been accreted (though some studies suggest molecular gas can be stripped as well; Fumagalli et al. 2009; Sivanandam et al. 2010; S. Sivanandam et al., in preparation). In comparison, the Coma cluster has a large population of early-type galaxies (including early spirals) that fall below the field mass–SFR relation, indicating that we are seeing them in the process of being quenched. These galaxies lie in the outer zones of the cluster rather than in the center, requiring either that the quenching mechanism be active there or that they were quenched on plunging orbits that have returned them to the outskirts of the cluster. The differences between the star-forming populations are most easily explained as differences in the history of accretion of field galaxies in the two clusters, so long as the quenching process is delayed by a sufficient interval to account for the absence of quenched galaxies in A2029 but is not so slow that it cannot account for the anemic galaxies in Coma.
Boselli & Gavazzi (2006), and references therein, review in detail the multitude of processes that could be responsible for the quenching of star formation in groups and clusters and the types of environments in which each could dominate or be most efficient. The group environment is a prime location for galaxy-galaxy interactions due to the larger densities of galaxies than in the field along with the slower velocities needed to strip significant amounts of gas (e.g., Merritt 1983; Byrd & Valtonen 1990; Boselli & Gavazzi 2006), though harassment can still affect cluster galaxies (Moore et al. 1999, and references therein). The dominant mechanisms in clusters, however, are more likely to be starvation/strangulation, ram-pressure stripping, and thermal evaporation (the ISM of the galaxy is heated by the ICM enough that the galaxy's gravitational potential is unable to retain the gas; e.g., Cowie & Songaila 1977). We can rule out thermal evaporation considering that this mechanism is most effective at low masses, and our anemic Coma galaxies are of much higher mass (Boselli & Gavazzi 2006). Ram-pressure stripping can occur throughout most of the cluster, though it is most efficient in the densest regions; starvation/strangulation can occur anywhere in the cluster. Galaxies in the outskirts, however, can have star formation that is suppressed relative to the field, suggesting these galaxies have been quenched by a mechanism that is less efficient at larger radii (Boselli & Gavazzi 2006). The location of Coma's star-formation-suppressed galaxies in the outskirts would seem to indicate that ram-pressure stripping is not the dominant mechanism, but as we mentioned previously, it is possible that the galaxies have already made one pass through the cluster, and as such, could already have been stripped to some extent.
Interestingly, tidal interactions (say, between galaxies and the cluster potential) can funnel material to the nuclei of galaxies, possibly triggering a short burst of star formation at the galaxies' centers (Condon et al. 1982; Keel et al. 1985; Kennicutt et al. 1987; Byrd & Valtonen 1990; Hummel et al. 1990; Mihos et al. 1992; Iono et al. 2004). This material and/or the sudden increase in star formation could help feed a low-luminosity AGN, which could at least partially explain the high incidence of AGNs in the anemic Coma galaxies (Lake et al. 1998).
It should be noted, though, that we are focusing on the star-forming galaxies with 9.5 ≲ log(M*/M☉) ≲ 10.5. As mentioned previously, low-mass galaxies can be more easily affected by a dense environment than higher-mass galaxies (Boselli & Gavazzi 2006, and references therein). Depending on the field mass–SFR relation at log(M*/M☉) < 9.5, both A2029 and Coma could have significant numbers of galaxies forming stars at rates lower than expected for the field relation. Indeed, the small number of anemic A2029 galaxies just above our completeness limit could be an indication of the quenching of low-mass galaxies. Observations of these low-mass galaxies could be the key to unlocking the mystery of star formation suppression in the highest-density regions of the universe.
6. CONCLUSIONS
We studied the 24 μm, Hα, and UV star formation indicators for galaxies in the clusters A2029 and Coma. A2029 is relaxed, with no obvious substructures, making it a good target for observing how dense environments affect star-forming galaxies over time. Coma is a good comparison cluster due to its proximity and abundance of multiwavelength observations.
The star-forming galaxies in A2029 follow the field mass–SFR relation. Coma, while having a population of star-forming galaxies that echoes the field, has an additional population that lies far below the field relation, indicating these galaxies are in the process of being quenched. A large fraction of these galaxies also host AGNs. We are unable to identify the dominant mechanism responsible for suppressing star formation, though we suspect ram-pressure stripping and starvation/strangulation are the most likely. Given the field-like population of star-forming galaxies in A2029, it appears that these galaxies have been accreted very recently (within 2 Gyr) and have not yet had time to be quenched. The incidence of suppressed star formation in Coma indicates that it accreted a significant number of galaxies longer ago.
Additionally, we discovered a population of 24 μm and/or FUV-emitting early-type galaxies in A2029 with no evidence of star formation, whose IR emission may arise from AGNs or old stellar populations.
First, we thank the referee for his/her helpful comments and concerns.
This work is based on observations made with the Spitzer Space Telescope, which is operated by the Jet Propulsion Laboratory, the California Institute of Technology, and NASA. We thank NASA for financial support through contract 1255094 from Caltech/JPL to the University of Arizona. This research has made use of the SIMBAD database, operated at CDS, Strasbourg, France (http://simbad.u-strasbg.fr/simbad/). This paper also uses data products produced by the OIR Telescope Data Center, supported by the Smithsonian Astrophysical Observatory (Hectospec; Fabricant et al. 2005) and the NASA/IPAC Extragalactic Database (NED), which is operated by the Jet Propulsion Laboratory, California Institute of Technology, under contract with NASA.
This research also made use of the SDSS-III archive. Funding for SDSS-III has been provided by the Alfred P. Sloan Foundation, the Participating Institutions, the National Science Foundation, and the U.S. Department of Energy Office of Science. The SDSS-III Web site is http://www.sdss3.org/.
SDSS-III is managed by the Astrophysical Research Consortium for the Participating Institutions of the SDSS-III Collaboration including the University of Arizona, the Brazilian Participation Group, Brookhaven National Laboratory, University of Cambridge, Carnegie Mellon University, University of Florida, the French Participation Group, the German Participation Group, Harvard University, the Instituto de Astrofisica de Canarias, the Michigan State/Notre Dame/JINA Participation Group, Johns Hopkins University, Lawrence Berkeley National Laboratory, Max Planck Institute for Astrophysics, Max Planck Institute for Extraterrestrial Physics, New Mexico State University, New York University, Ohio State University, Pennsylvania State University, University of Portsmouth, Princeton University, the Spanish Participation Group, University of Tokyo, University of Utah, Vanderbilt University, University of Virginia, University of Washington, and Yale University.
Footnotes
- 3
- 4
- 5
See the GALEX Web site and the GALEX exposure time calculator (http://sherpa.caltech.edu/gips/tools/expcalc.html) for additional information.
- 6
The NASA/IPAC Extragalactic Database is operated by the Jet Propulsion Laboratory, California Institute of Technology, under contract with the National Aeronautics and Space Administration.
- 7
- 8
The mean is influenced by the more quiescent galaxies and so is not a good representation of the overall trend.