


ABSTRACT
We have calculated electron-impact ionization (EII) for P-like systems from P to Zn15 + forming Si-like ions. The work was performed using the flexible atomic code (FAC) which is based on a distorted-wave approximation. All 3ℓ → nℓ' (n = 3–35) excitation-autoionization (EA) channels near the 3p direct ionization threshold and 2ℓ → nℓ' (n = 3–10) EA channels at the higher energies are included. Close attention has been paid to the detailed branching ratios. Our calculated total EII cross sections are compared both with previous FAC calculations, which omitted many of these EA channels, and with the available experimental results. Moreover, for Fe11 +, we find that part of the remaining discrepancies between our calculations and recent measurements can be accounted for by the inclusion of the resonant excitation double autoionization process. Lastly, at the temperatures where each ion is predicted to peak in abundances in collisional ionization equilibrium, the Maxwellian rate coefficients derived from our calculations differ by 50%–7% from the previous FAC rate coefficients, with the difference decreasing with increasing charge.
Export citation and abstract BibTeX RIS
1. INTRODUCTION
Modeling and interpreting spectra of collisionally ionized astrophysical plasmas requires accurate calculations for the underlying charge state distribution (CSD; Landi & Landini 1999; Kallman & Palmeri 2007; Bryans et al. 2009). Such plasmas are formed in the Sun and other stars, supernova remnants, the interstellar medium, galaxies, and the intracluster medium in clusters of galaxies. These CSD calculations, in turn, depend on reliable data for electron-ion recombination and electron-impact ionization (EII). The past decade or so has seen significant advances in the available theoretical and experimental data for dielectronic recombination, which is the dominant recombination process for most ions in cosmic plasmas (Badnell 2006; Schippers et al. 2010). This is to be contrasted with EII which theoretically has only recently been comprehensively studied (Dere 2007). Experimentally, only in the past few years have unambiguous laboratory results become available (Hahn et al. 2011a, 2011b, 2012a, 2012b, 2013).
EII can occur through a number of different channels. Direct ionization (DI) is a one-step process whereby an electron is ejected from an ion Aq + of charge state q +, for any given atom A, thereby forming an ion A(q + 1) +. A number of two-step processes can also contribute to EII. Excitation-autoionization (EA) occurs when the incident electron excites a bound electron to a level which can subsequently autoionize to form A(q + 1) + or higher. The incident electron can also undergo dielectronic capture (DC), forming a doubly excited A(q − 1) + system which can then undergo double autoionization, forming A(q + 1) +. This is known as resonant excitation double autoionization (REDA) if the two electrons are released sequentially (LaGattuta & Hahn 1981; Linkemann et al. 1995) and resonant excitation auto double ionization (READI) if the two electrons are ejected simultaneously (Henry et al. 1982; Pindzola & Griffin 1987; Rinn et al. 1987).
EII calculations are theoretically challenging. They require solving a Hamiltonian which include all the relevant interactions in the scattering event. The potential form to use for the descriptions of target and continuum electrons is often an issue. When multi-step processes can be involved, a large number of intermediate states need to be accounted for along with their radiative and autoionizing branching ratios (BRs). Additionally, the problem necessitates suitable wave function expansions both for the target and continuum states. The most sophisticated method is the close coupling (CC) approach, but this is computationally expensive and unsuitable for generating the vast quantities of data required in astrophysics. For this reason, the distorted wave (DW) method has been most widely employed to generate EII data for astrophysical plasma (Kallman & Palmeri 2007; Dere 2007).
Testing of these theoretical methods has been performed for decades using benchmark experimental measurements. Reviews of such work can be found in Müller (1990) and Müller (2008). However until recently most laboratory measurements have been limited to single pass experiments using ion beams with an unknown population of metastable levels (e.g., Gregory et al. 1987). As a result an exact comparison of theory with experiment has not been possible for ions whose cross sections differ between the metastable levels and the ground level.
The development of ion storage rings combined with merged electron beams has helped to overcome this experimental limitation. Using an ion storage ring one can store the ions long enough so that for many systems essentially all of the metastable levels can radiatively decay to their ground states. The resulting EII data provide unambiguous benchmark data for theory. To date, results from such experiments have been published for Li-like Si11 + and Cl14 + (Kenntner et al. 1995), Be-like S12 + (Hahn et al. 2012b), B-like Mg7 + (Hahn et al. 2010), F-like Fe17 + and Ne-like Fe16 + (Hahn et al. 2013), Na-like Fe15 + (Linkemann et al. 1995), Al-like Fe13 + (Hahn et al. 2013), Si-like Fe12 + (Hahn et al. 2011b), P-like Fe11 + (Hahn et al. 2011a), and S-like Fe10 + and Cl-like Fe9 + (Hahn et al. 2012a).
In Kwon & Savin (2012), we focused on comparing theory and experiment for Fe11 +. Previous experimental work by Hahn et al. (2011a) had found discrepancies with the earlier theoretical work of Dere (2007). The theory was below the experimental results near the 3p DI threshold but above the measurements at higher energies where innershell EA channels opened up. The work of Dere (2007) used the flexible atomic code (FAC) of Gu (2008). In Kwon & Savin (2012) we also performed FAC calculations, but took more channels into account. For that work we included 3ℓ → nℓ' (n = 4–35) EA channels near the threshold and the 2ℓ → nℓ' (n = 3–10) EA channels at higher energies. Particular attention was paid to the detailed BRs. These new FAC results helped to resolve several of the previously seen discrepancies. Moreover, at temperatures where Fe11 + forms in collisional ionization equilibrium (CIE; Bryans et al. 2009) the rate coefficient derived from our calculation lies within 11% of the experimentally derived rate coefficient and is in better agreement with the measurement of Hahn et al. (2011a) than the previous FAC results of Dere (2007) which differed by up to 25% from the measurement.
Here we have extended our EII calculations for Fe11 + to P-like systems from P to Zn15 +. Moreover, for Fe11 + in addition to DI and EA we have also included the REDA process, which we did not include in Kwon & Savin (2012). In Section 2, we describe the calculational approach used to obtain theoretical EII cross sections and rate coefficients. In Section 3 the calculated total EII cross sections and rate coefficients are shown for the selected ions and compared with available experiments and with the previous theoretical works of Dere (2007). Lastly, we summarize our results in Section 4.
2. THEORETICAL CALCULATIONS
We have calculated EII cross sections based on the approach and ionization channels detailed in Kwon & Savin (2012). Here we briefly review those calculations. In addition we describe the method employed for calculating the Fe11 + REDA cross section, which was not part of Kwon & Savin (2012).
Here DI, EA and REDA are treated independently. The total single ionization cross section can then be written as (Badnell & Pindzola 1993)
where  is the DI cross section for any given ion Aq + to the level f of A(q + 1) +. The second summation on the right hand side of Equation (1) represents EA where
  is the collisional excitation (CE) cross section of the initial Aq + ions to level j, which can then undergo autoionization by the emission of a single electron to form A(q + 1) + with a BR of
  . The third summation is due to REDA where
  is the energy averaged DC cross section to level k of A(q − 1) +, which can then double autoionize, to form an A(q + 1) + ion with a BR of
  .
.
The BR for single autoionization of level j by emission of one electron is given by
where Aa denotes the autoionization rate and Ar denotes the radiative decay rate. The s indices are for the levels of A(q + 1) + and the t indices are for the levels of Aq +. Some of the s levels may lie above the ionization limit for A(q + 1) + and some of the t levels may lie above the ionization limit for Aq +. The radiative BR  and autoionization BR
  account for the fraction of those s and t levels eventually resulting in a net single ionization event. Equation (2) must be solved recursively in order to determine all of the BRs.
The BR for double autoionization of level k by emission of two electrons can be expressed as

where  is the autoionization rate of A(q − 1) + from k to any level j' of Aq +,
  is the radiative decay rate of A(q − 1) + from k to t', and
  is the BR for autoionization of j' level given by Equation (2).
In order to compare the theoretical REDA results with experimental data we need to define the energy averaged DC cross section  . This smooths over the resonances in the DC cross section σk and can be related to the experimental energy spread by
where the numerator is defined as
Here v0 is the average longitudinal center-of-mass electron velocity in the experiment and  is the electron velocity vector relative to the ions. The term 〈σkv〉 can be expressed analytically as Equation (9) of Kilgus et al. (1992) for the "flattened" Maxwellian distribution typical of ion storage rings, as we discuss more in the results section. In that equation, following the theoretical framework of Shore (1969), the integrated cross section of state k for DC can be expressed as
where ℏ is the Planck constant divided by 2π;  is the Rydberg energy constant; Ek denotes the resonance energy; a0 is the Bohr radius; gk and gi are the statistical weights of the captured and initial states, respectively; and
  is the autoionization rate from the level i to k.
The ionization channels for DI and EA considered here are the same as those of Kwon & Savin (2012) for Fe11 + forming Fe12 + except that we have included some additional EA channels and autoionization decay channels resulting in net double ionization which are energetically viable for some ions with low atomic number Z. For P, S+, Cl2 +, Ar3 +, and K4 + the 3ℓ → nℓ' EA channels open up at threshold for the ground state from n = 3 but for the isoelectronic Ca5 +–Zn15 + the 3ℓ EA channels open up starting from n = 4. In addition for P, S+, and Cl2 +, the 2ℓ → 3ℓ' EA channel followed by autoionization to 2[s, p]83[s, p]33d levels can further autoionize to form Al-like ions since some of the 2[s, p]83[s, p]33d levels lie above the Si-like ionization threshold. Here n[s, p]m indicates that m electrons are distributed between the s and p orbitals in the n shell. However, these autoionizing levels in the Si-like ions are below the Si-like ionization limit for initially Ar3 +–Zn15 + systems, thereby resulting in no net double ionization. Lastly DI of a 2ℓ electron of the initial P-like system was not included because we calculate that the resulting 2ℓ-hole system for P-like ions considered will autoionize over 93% of the time to form Al-like ions.
In addition to the above, we also calculated REDA for Fe11 +. The REDA channels included are as follows. The first step proceeds via the DC process

where for n1 = 3, n2 = 4–30 and for n1 = 4, n2 = 4. For all cases ℓ1 < n1 and ℓ2 ⩽ 5 were included. The DC cross sections for 2ℓ → n1ℓ1 with n1 > 4 were so small that they can be neglected. The captured states can autoionize by emitting one electron to form Fe11 + via
or can radiatively decay leaving the system as Fe10 + by
The autoionizing states in Equation (8) can then sequentially emit another electron to form Fe12 +

or radiatively decay via
For 2ℓ → 3ℓ1 excitation and capture into n2 > 30, a simple hydrogenic scaling law (Romanik 1988) was used to extrapolate the resonance energies, autoionization rates, and radiative decay rates of the captured electrons. In the extrapolation the resonance energy for the captured states of n2 > 30 is given by
for ns = 30 since the binding energy for high n2 Rydberg levels can be expressed as
where the quantum defect δ is independent of n2 and n2 ≫ δ (Cowan 1981). The autoionization and radiative decay rates are given by
and by
respectively. The radiative decay rate of the core electron for these higher n2 levels was set to that of the last n2 = 30 level for which explicit calculations were carried out.
Based on the good agreement found in Kwon & Savin (2012) with the experimental results, we used the post form of a VN potential where N is the number of initial target electrons (Pindzola et al. 1995). In the DW approximation, the cross section is obtained by considering the continuum and bound electrons interactions perturbatively. For the first order perturbation theory used in the conventional DW approach, the interaction potential is taken as a Coulomb field generated from an arbitrary effective charge, due to the screening of the nucleus by the continuum and bound electrons, and neglecting the long range interaction between the scattered and ejected continuum electrons (Macek & Botero 1992). Hence, the validity of the assumed potential form in DW relies on benchmarking by experimental results (Pindzola et al. 1995). This is to be contrasted with the more sophisticated CC method where the interaction is treated non-perturbatively, taking into account long-range, three-body Coulomb effects. Clearly a more exact treatment for the potential, for example, using the time-dependent CC approach (Pindzola & Schulz 1996), would be helpful to further verify the proper potential form choice.
More specifically, a single local central potential for the initial and final state radial wave functions was optimized on the 3s23p3 configuration of initial target ion for DI, EA, and REDA. The alternative optimization on the 3s3p3 + 3s23p2 configurations can lead to different values for the cross section, especially for DI. The sensitivity of the results to the configuration selected increases as the charge state of the initial target ion decreases. However, as we show below, optimization on the 3s23p3 configuration yielded good agreement with the available experimental results for S+, Cl2 +, and Ar3 + as well as for Fe11 +. Hence that is the configuration we selected for optimizing the radial wave functions.
For a Maxwell–Boltzmann electron energy distribution at an electron temperature Te, the DI and EA rate coefficient αDI + EA(Te) is generated from the calculated cross section σ(E) using
where kB is the Boltzmann constant and me is the electron mass. For REDA the Maxwellian rate coefficient is given by (Shore 1969)
Adding these two gives the total ionization rate coefficient

3. RESULTS
The calculated DI+EA+REDA cross section for ground state Fe11 + is shown in Figure 1. In order to compare our REDA results with ion storage ring data, we must convolve the theoretical data with the flattened Maxwellian distribution of the experiment, which is described by parallel T|| and transverse T⊥ temperatures with respect to the electron beam direction (Schippers et al. 2001). For Fe11 + these were kBT|| = 13.5 meV and kBT⊥ = 180 μeV (Hahn et al. 2011a).

Figure 1. FAC calculations for the EII cross section for ground state Fe11 + including the DI+EA+REDA contributions. The solid line represents the calculated total EII cross section including the REDA cross section and the dashed line shows the DI+EA cross sections. Also shown are the experimental results of Hahn et al. (2011a). The experimental data are plotted using large filled circles and their 1σ experimental uncertainty is shown by the small points.
Download figure:
Standard image High-resolution imageIn our previous EII calculation for ground state Fe11 + (Kwon & Savin 2012), the 2ℓ → 3ℓ' EA channel appeared to turn on about 20 eV higher in energy than the experimental data. We hypothesized that this difference could be due to neither REDA nor READI being accounted for in our previous calculations. As can be seen in Figure 1, including the REDA leads to better agreement with the experiment between ∼680 and 720 eV. However the theory is still below the experiment in the energy range 720–800 eV. This remaining discrepancy is unlikely to be due to REDA. It is true that over the energy range of 640–920 eV DC can proceed via e− + 2ℓ → n1ℓ1n2ℓ2 (n1 = 3 or 4 and n2 > 3). But there are many more sizable resonances concentrated in the energy range 640–750 eV than in the energy range 750–920 eV and the convolved REDA cross section is significant only in the energy range 640–750 eV as shown in Figure 1. We may attribute the remaining difference between theory and experiment over the energy range 720–800 eV to READI which has not yet been incorporated into FAC and therefore has not been considered here. In the energy range of 405–920 eV, READI can occur energetically for DC via e− + 2ℓ → n1ℓ1n2ℓ2(n1 = 3 or 4 and n2 ⩾ 3). The detailed READI cross section calculation is beyond the scope of this paper. READI has been considered for Li-like systems using many-body perturbation theory (Pindzola & Griffin 1987) and a unified R-matrix approach (Müller 2000; Scott et al. 2000). However, it is unclear how to relate those results to the more complex P-like systems considered here.
The REDA contribution to the Maxwellian rate coefficient increases the DI+EA rate coefficient by less than 4% at temperatures where Fe11 + is predicted to form in CIE. This is only a small contribution to the total EII rate coefficient, and so we do not include REDA in the calculated total EII cross sections and rate coefficients for all the P-like ions from P to Zn15 + presented below.
Figures 2–6 show our calculated total EII cross sections for some selected other P-like ions where experimental data is available to compare with. As for comparison to the FAC results of Dere (2007), he did not present data for P, S+, and Cl2 +. His FAC calculations for Ar3 + and Ni13 + are shown in Figures 5 and 6, respectively.

Figure 2. Our calculated EII cross section for ground state P forming P+ is compared with the available experimental results. Various choices for the local central potential for DI are plotted in different line types. The large error bar shows the total experimental systematic uncertainty.
Download figure:
Standard image High-resolution image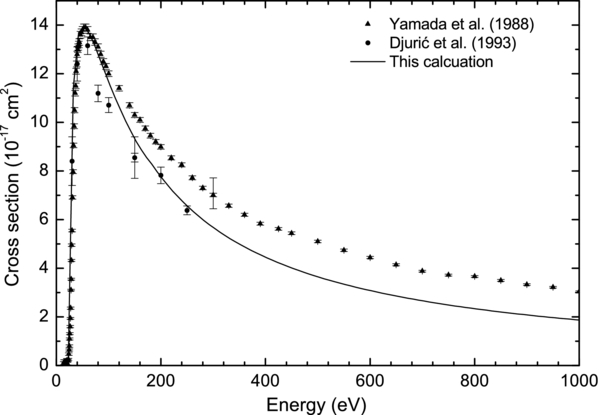
Figure 3. Same as Figure 2 but for ground state S+ forming S2 +. The small error bars show the statistical deviations of the measurements, and the large error bar shows the total experimental systematic uncertainty.
Download figure:
Standard image High-resolution image
Figure 4. Same as Figure 3 but for ground state Cl2 + forming Cl3 +.
Download figure:
Standard image High-resolution image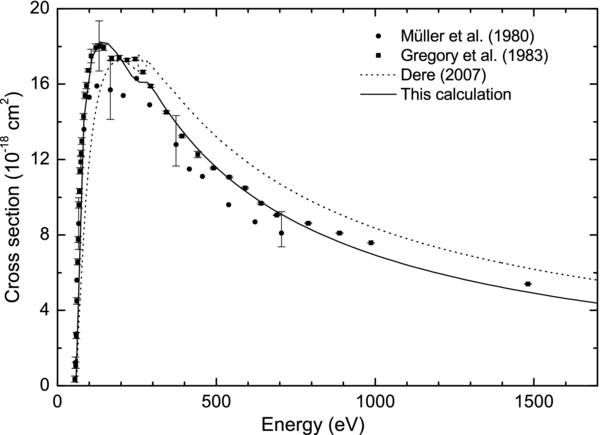
Figure 5. Same as Figure 3 but for ground state Ar3 + forming Ar4 +. Also shown are the previous FAC results from Dere (2007).
Download figure:
Standard image High-resolution image
Figure 6. Same as Figure 5 but for ground state Ni13 + forming Ni14 +.
Download figure:
Standard image High-resolution imageFigure 2 shows our calculated cross section for P. At the peak, it is up to two times larger than the measurements of Freund et al. (1990). At the highest energies it is in good agreement with experiment. The agreement does not improve if we use other potentials for the calculations. Using the VN − 1 potential for DI optimized on the 3s3p3 + 3s23p2 configurations reduces both the peak cross section as well as that at high energies. Similarly, the agreement is also poor using a VN + VN − 1 potential optimized on the 3s23p3 + 3s3p3 + 3s23p2 configurations.
The cause for the discrepancy between experiment and theory is not immediately obvious. The neutral atoms in the experiment were generated using charge-transfer neutralization of fast P+. The resulting neutral beam had an unknown metastable population. Clearly, measurements on ground state P would greatly help to resolve the issue by providing unambiguous laboratory benchmark data. Moreover, such benchmark results, could guide the selection of the proper potential form to use for DW calculations.
Another theoretical issue which may play a role involves the approximations used for the calculation of the collision cross section. FAC assumes a weak interaction in order to derive the scattering matrix (Bar-Shalom et al. 1988; Gu 2008; Sampson et al. 2009). Such an approach is usually reliable for highly charged ions but breaks down for neutral atoms. This approximation does not ensure that the scattering matrix is unitary, which implies potentially incomplete conservation of wave function flux before and after scattering. This issue is generally corrected for using a normalization procedure (Sobelman et al. 1981; Clark 1990). Unfortunately the correction is not implemented at present in FAC. Alternatively, it is possible that calculations with the more sophisticated CC R-matrix method, which should yield a scattering matrix closer to unitary, might resolve the discrepancy between experiment and theory.
Our new FAC calculations for S+ are in good agreement with the measurements by Yamada et al. (1988) and Djurić et al. (1993) near the ionization threshold and also at peak as shown in Figure 3. But at higher energies our calculations agree better with the results of Djurić et al. (1993) than with those of Yamada et al. (1988).
For Cl2 + our new FAC calculations are in good agreement with the measurement by Mueller et al. (1985) near the ionization threshold and also at peak as shown in Figure 4. At higher energies our calculation is lower than the measurement but still within the total experimental systematic uncertainty.
Figure 5 shows our new FAC calculations for Ar3 +. At peak energy they are in better agreement with the measurements by Gregory et al. (1983) than with those by Müller et al. (1980). At an energy of ∼60 eV, near the 3ℓ ionization threshold, our calculated total EII cross section, which includes EA via 3ℓ into high nℓ', is in better agreement with the experimental data of Gregory et al. (1983) than are the FAC cross section results by Dere (2007).
Our new FAC calculation for Ni13 + near the ionization threshold is in better agreement with the measurement by Cherkani-Hassani et al. (2001) than are the previous FAC results by Dere (2007), as can be seen in Figure 6. However our calculated cross section lies below the measurement at energies of ∼840–2000 eV where 2ℓ → nℓ' EA contributes. Resolving these discrepancies would be greatly aided by laboratory EII measurements on ground state Ni13 +.
Surprisingly, for EII of S+–Ar3 + the metastable contamination in the experimental results seems to generate no major discrepancies between our calculations and the laboratory data. We attribute this, in part, to the fact that the metastable states have the same 3s23p3 valence shell configuration as that of the ground state (See Gregory et al. 1983). According to our calculations, DI is the dominant contribution to the EII cross section for all P-like systems from P through Zn15 +. We find that the peak DI cross sections for the metastable levels are larger by only 8% for S+ compared to the ground state. This decreases to 4% by the time one reaches Ar3 +. However, for P the increase is 22%, much larger than for S+–Ar3 +. This decreasing difference with increasing Z is due to decrease in the importance of electron–electron interactions as the nuclear charge increases. These low Z results are to be contrasted with the comparison between our results and the measured data for Ni13 +. For this ion any metastable states in the experiment are expected to be mostly in the 3s23p23d configuration rather than that of the 3s23p3 ground term. For Ni13 +, the peak DI cross section increases by 24% as one goes from the ground state to the lowest metastable term of the 3s23p23d configuration. This difference is much larger than those of the ground terms for S+–Ar3 + and may explain much of the discrepancy between the Ni13 + measurements and our calculations.
The total Maxwellian rate coefficients derived from our calculated EII cross sections are shown in Figure 7 for even Z, P-like ions from P to Zn15 +. Also shown are the rate coefficients from the previous FAC calculations by Dere (2007) for even Z ions from Ar3 + to Zn15 +. The dotted line for S+ represents the rate coefficient from the measurement of Yamada et al. (1988) which was included in the CHIANTI atomic database (Dere et al. 1997; Landi et al. 2012).

Figure 7. EII rate coefficients for various ground state P-like ions forming Si-like ions. The solid line represents our FAC results and the dotted line shows the FAC result by Dere (2007), except for S+. The dotted line for S+ is the BT scaled fit derived from the measurement by Yamada et al. (1988). For Fe11 + the experimental rate coefficient of Hahn et al. (2011a) is also shown by the dashed line. The horizontal bars show the CIE temperature regime predicted by Bryans et al. (2009) where each ion is over 1% abundant.
Download figure:
Standard image High-resolution image
Table 1 lists the relative difference between our FAC results and the rate coefficients in the CHIANTI data base, normalize to our calculations. Also listed is the temperature of peak formation for each ion in CIE (Bryans et al. 2009). Our calculated rate coefficient for P shows a +94% difference with the rate coefficient derived from the data of Freund et al. (1990). For S+ our calculated rate coefficient shows a +77% difference from the rate coefficient derived from the measurement by Yamada et al. (1988). For Cl2 + our calculated rate coefficient shows a +17% difference from that derived using the data of Mueller et al. (1985). The rate coefficients for the ions Ar3 +–Zn15 + derived from our new FAC calculation show relative differences starting at +50% and decreasing to +7%, compared to the earlier FAC rate coefficients of Dere (2007).
Table 1. Differences Between our FAC Rate Coefficients and the Recommended Rate Coefficients of Dere (2007) Relative to our Results. The Data of Dere for P–Cl2 + are Based on Experimental Resultsa and for Ar3 +–Zn15 + on FAC Calculations. Tmax Denotes the CIE Temperature of Peak Abundance for Each Ion (Bryans et al. 2009)
| Ion | Tmax | Relative Difference |
|---|---|---|
| (K) | (%) | |
| P | 1.0E+4 | 94 |
| S+ | 2.0E+4 | 77 |
| Cl2 + | 4.0E+4 | 17 |
| Ar3 + | 1.3E+5 | 50 |
| K4 + | 2.0E+5 | 46 |
| Ca5 + | 3.2E+5 | 37 |
| Sc6 + | 5.0E+5 | 34 |
| Ti7 + | 6.3E+5 | 29 |
| V8 + | 7.9E+5 | 26 |
| Cr9 + | 1.0E+6 | 24 |
| Mn10 + | 1.3E+6 | 17 |
| Fe11 + | 1.6E+6 | 19 |
| Co12 + | 1.6E+6 | 21 |
| Ni13 + | 2.0E+6 | 15 |
| Cu14 + | 2.5E+6 | 9 |
| Zn15 + | 3.2E+6 | 7 |
Notes. aP is from Freund et al. (1990), S+ from Yamada et al. (1988), and Cl2 + from Mueller et al. (1985).
Download table as: ASCIITypeset image
As for which rate coefficients we recommend for modeling, for P we suggest using the experimental results as there are known potential errors in the FAC DW results and the arguments given above suggest that the presence of metastable levels in the experimental results has only a minimal affect for the low Z systems in this isoelectronic sequence. For S+, our calculations are in better agreement with the measurements of Djurić et al. (1993) than those of Yamada et al. (1988) and so we recommend the use of our results for this ion. Lastly, for Cl2 +–Zn15 +, we recommend using our data which are more complete than the results of Dere (2007).
For convenience in plasma modeling we have fitted our calculated Maxwellian rate coefficient using the Burgess–Tully (BT) scaling of Dere (2007) and a fifth-order polynomial for the scaled rate coefficient. The electron temperature Te was scaled as
where t = kBTe/E0 and E0 is the ionization potential of the ion. The rate coefficient αI was scaled as
where E1 is the first exponential integral. The scaled rate coefficient was fitted by the polynomial form
The fit parameters are listed in Table 2 along with the fit temperature range and the maximum fit error over this temperature range.
Table 2. Fifth-order Polynomial Fitting Parameters used to Reproduce the Scaled Ionization Rate Coefficient ρ(x)a
| Ion | a0 | a1 | a2 | a3 | a4 | a5 | Energy | Error |
|---|---|---|---|---|---|---|---|---|
| (K) | (%) | |||||||
| P | 1.6311E −5 | 7.3219E −5 | −4.5887E −4 | 1.2635E −3 | −1.6935E −3 | 8.8162E −4 | (6.03E+3)–(4.06E+5) | 0.8 |
| S+ | 1.0757E −5 | 1.3639E −4 | −1.4018E −3 | 6.2311E −3 | −1.2801E −2 | 9.8485E −3 | (6.03E+3)–(4.06E+5) | 3.0 |
| Cl2 + | 2.2762E −5 | −5.1532E −5 | −1.1728E −4 | 1.5646E −3 | −4.1964E −3 | 3.5701E −3 | (8.12E+3)–(8.12E+5) | 2.0 |
| Ar3 + | 1.7730E −5 | −7.3973E −5 | 4.9263E −4 | −1.7588E −3 | 3.0169E −3 | −1.9607E −3 | (1.74E+4)–(1.62E+6) | 3.0 |
| K4 + | 2.1256E −5 | −1.2960E −4 | 8.8416E −4 | −3.0597E −3 | 5.0371E −3 | −3.1361E −3 | (2.55E+4)–(2.55E+6) | 2.7 |
| Ca5 + | 1.3021E −5 | 3.8018E −5 | −4.3064E −4 | 1.6726E −3 | −2.8000E −3 | 1.7147E −3 | (3.48E+4)–(3.48E+6) | 2.1 |
| Sc6 + | 1.8501E −5 | −3.6593E −5 | 5.4077E −5 | 1.0875E −4 | −3.5507E −4 | 2.4718E −4 | (3.48E+4)–(5.80E+6) | 1.0 |
| Ti7 + | 2.3382E −5 | −1.3456E −4 | 8.0078E −4 | −2.4764E −3 | 3.7944E −3 | −2.2535E −3 | (5.80E+4)–(5.80E+6) | 2.4 |
| V8 + | 1.8561E −5 | −4.3013E −5 | 1.1328E −4 | −8.0616E −5 | −5.3313E −5 | 5.8732E −5 | (5.80E+4)–(1.04E+8) | 1.8 |
| Cr9 + | 2.1585E −5 | −8.7635E −5 | 3.6011E −4 | −6.7487E −4 | 5.9995E −4 | −2.1001E −4 | (5.80E+4)–(1.04E+8) | 0.7 |
| Mn10 + | 2.0189E −5 | −7.4064E −5 | 3.0156E −4 | −5.3355E −4 | 4.3247E −4 | −1.3488E −4 | (1.04E+5)–(1.04E+8) | 0.2 |
| Fe11 + | 1.9812E −5 | −6.8207E −5 | 2.7144E −4 | −4.3611E −4 | 2.9220E −4 | −6.3921E −5 | (1.04E+5)–(9.28E+7) | 1.3 |
| Co12 + | 2.0593E −5 | −8.3051E −5 | 3.6655E −4 | −6.7272E −4 | 5.5221E −4 | −1.6976E −4 | (1.04E+5)–(1.04E+8) | 1.1 |
| Ni13 + | 2.1607E −5 | −1.0651E −4 | 5.2839E −4 | −1.1131E −3 | 1.0795E −3 | −4.0192E −4 | (1.04E+5)–(1.04E+8) | 0.6 |
| Cu14 + | 1.9618E −5 | −8.3581E −5 | 4.2272E −4 | −8.5515E −4 | 7.7232E −4 | −2.6297E −4 | (2.90E+5)–(1.04E+8) | 0.5 |
| Zn15 + | 1.9638E −5 | −8.7310E −5 | 4.6286E −4 | −9.6962E −4 | 9.0541E −4 | −3.1864E −4 | (2.90E+5)–(1.04E+8) | 0.7 |
Note. aSee Equations (19)–(21) in text.
Download table as: ASCIITypeset image
4. SUMMARY
We have calculated EII for ground state P-like systems from P to Zn15 + forming Si-like ions. The calculations were performed using FAC within a DW approximation. For Fe11 + we have also calculated the REDA cross section and find that it contributes ≲ 4% to the total DI+EA rate coefficient at the CIE temperature of peak formation. For all systems, EA via 3l → nℓ' (n = 4–35) channels near the ionization threshold and via 2ℓ → nℓ' (n = 3–10) channels at high energies are included, along with the proper detailed BRs. Our calculated total DI+EA cross sections are compared with the available experimental results for P, S+, Cl2 +, Ar3 +, and Ni+13 + and with the previous FAC calculations for Ar3 +–Zn15 +. We find reasonable agreement with the available experimental data for all systems except for neutral P. For P the calculated peak EII cross section is about two times larger than the available experiment. Further theoretical and experimental work is required to resolve the discrepancy. The differences between our calculated Maxwellian rate coefficients and the previous FAC rate coefficients relative to ours are 50–7% for Ar3 +–Zn15 +, a difference which decreases with increasing atomic number.
We thank M. Hahn for stimulating discussions and P. Defrance for providing the experimental EII data for Ni13 +. This work was supported by the Korean Ministry of Science, ICT and Future Planning (MSIP) and by grants from the NASA Astronomy and Physics Research and Analysis (APRA) Program and the NASA Solar and Heliospheric Physics Supporting Research and Technology Program.