


ABSTRACT
The cross sections of the 2H(d,p)3H and 2H(d,n)3He reactions have been measured via the Trojan Horse method applied to the quasi-free 2H(3He,p3H)1H and 2H(3He,n3He)1H processes at 18 MeV off the proton in 3He. For the first time, the bare nucleus S(E) factors have been determined from 1.5 MeV, across the relevant region for standard Big Bang nucleosynthesis, down to the thermal energies of deuterium burning in the pre-main-sequence (PMS) phase of stellar evolution, as well as of future fusion reactors. Both the energy dependence and the absolute value of the S(E) factors deviate by more than 15% from the available direct data and existing fitting curves, with substantial variations in the electron screening by more than 50%. As a consequence, the reaction rates for astrophysics experience relevant changes, with a maximum increase of up to 20% at the temperatures of the PMS phase. From a recent primordial abundance sensitivity study, it turns out that the 2H(d,n)3He reaction is quite influential on 7Li, and the present change in the reaction rate leads to a decrease in its abundance by up to 10%. The present reaction rates have also been included in an updated version of the FRANEC evolutionary code to analyze their influence on the central deuterium abundance in PMS stars with different masses. The largest variation of about 10%–15% pertains to young stars (⩽1 Myr) with masses ⩾1 M☉.
Export citation and abstract BibTeX RIS
1. INTRODUCTION
The 2H(d,p)3H and 2H(d,n)3He fusion reactions at low energies are relevant in pure and applied physics. These reactions took place for the first time during the Big Bang nucleosynthesis (BBN). According to its standard theory (SBBN), the timescale and the non-existence of stable elements with A = 5 and 8 prevented elements heavier than beryllium from forming, while at the same time, allowing unburned light elements, such as deuterium, to exist. Its effects essentially depend on the rates of the 12 most important reactions of the SBBN model, as well as on the baryon-to-photon ratio, η. This is the only free parameter for the SBBN model and allows one to determine the conditions under which nuclear fusion occurs. From this, with detailed network calculations and knowledge of the nuclear cross sections, we can derive primordial abundances. In this sense, independent knowledge of any one abundance produces a check of the SBBN model itself. For a long time, SBBN was the only way to evaluate the baryon-to-photon ratio, η, in the universe, by comparing observed and calculated light-element abundances. However, the study of cosmic microwave background anisotropies has recently provided an independent and precise determination of the baryonic density, which can be compared to the SBBN results. On the other hand, the increased level of accuracy in measuring primordial abundances has raised a renewed interest in the reaction rates as input parameters in accurate consistency tests of the SBBN model. This applies in particular to the deuterium, the best baryometer (Steigman 2006), as its primordial abundance decreases rapidly with η and its later chemical evolution is simple, as it is essentially destroyed in stars (Tytler et al. 1999). The uncertainty on η inferred from deuterium is contributed equally by the observational errors in the deuterium abundance and by the uncertainties in the cross sections of reactions belonging to the deuterium SBBN network (Smith et al. 1993). In this context, the 2H(d,p)3H and 2H(d,n)3He processes are among the most important and critical points at the SBBN relevant energies (d − d relative energies Edd from 50 to 350 keV). To perform an accurate calculation of the reaction rates, the cross section has to be determined from Edd = 30 keV to at least 1.5 MeV.
All reference measurements, which are included in several compilations (NACRE by Angulo et al. 1999, Descouvemont et al. 2004, and Cyburt 2004) for both channels, have mainly been focused either on the region below 200 keV (Krauss et al. 1987; Brown & Jarmie 1990; Greife et al. 1995) or on much higher energies (Schulte et al. 1972) above 1 MeV. Available reaction rates rely either on polynomial (Angulo et al. 1999; Cyburt 2004) or on R-matrix fits (Descouvemont et al. 2004), with deviations between each of up to 15%. In a recent work (Leonard et al. 2006), the total cross section for both 2H(d,p)3H and 2H(d,n)3He reactions was measured at Edd from 55 to 325 keV in steps of about 50 keV. Although uncertainties of better than 4% were quoted, concerns remain about the procedure followed to calculate the reaction rates, owing to the lack of higher energy data. The rates derived at the SBBN temperatures (T9 = 1 and lower) are about 7% higher than the NACRE rates (Angulo et al. 1999) for both channels. This leads to a decrease in the deuterium abundance of about 7%. In addition, this change provides a 5% increase in the predicted lithium abundance, resulting in a stronger disagreement between lithium abundance observations and SBBN predictions. A new experimental campaign is thus required to provide new data for both 2H(d,p)3H and 2H(d,n)3He reactions in an energy rage wider than the one of interest for the SBBN.
The importance of the ultra-low energies below 30 keV is twofold: burning temperatures (0–10 keV) of deuterium in pre main sequence (PMS) stars as well as thermal energies of future inertial fusion power plants (Lindl 1995; Yamanaka 1999) fall into this region.
Deuterium is a fragile element easily destroyed in stars due to its relatively low burning temperature (about 106 K); the amount survived to the BBN is thus destroyed during the first stages of PMS evolution. The nuclear burning occurs mostly through the 2H(p,γ)3He reaction because of the overwhelming abundance of protons (hydrogen) in stellar matter, although the 2H(d,p)3H and 2H(d,n)3He reactions are active, too. When the central temperature exceeds 106 K, deuterium is burnt; the PMS phase occurs when the star is fully convective, and due to the continuous mixing that brings surface matter toward the stellar center, deuterium is efficiently depleted in the whole structure.
As for the inertial fusion power plant, it is intended to produce electric power by use of inertial confinement fusion techniques induced by laser or ion beams on an industrial scale. This type of power plant is still in the research phase. Nuclear fusion reactions are initiated by heating and compressing a fuel target, typically in the form of a tiny pellet that most often contains a mixture of deuterium and tritium.
Very little data is available below 10 keV. Reliable cross sections below 10 keV were measured only for the 2H(d,p)3H channel with a gas target (Greife et al. 1995), but not in absolute units. These data show a clear enhancement ascribed to electron screening. The inferred electron screening potential of Ue = 25 ± 5 eV is significantly larger than the adiabatic limit (∼14 eV) provided by atomic physics. However, the electron screening that affects nuclear reactions in the laboratory is different from that in a plasma (Shaviv & Shaviv 2000), and its effect has to be removed from the data to properly determine the reaction rate. This also applies to laboratory fusion reactions with inertial confinement. Theories in use for laboratory electron screening cannot be applied because the density of the inner core of the pellets is increased by a thousandfold during compression.
Determining the bare nucleus cross section is thus instrumental in several fields of basic and applied research. The Trojan Horse method (THM; Spitaleri et al. 2011 and Tumino et al. 2013b) enables us to measure the bare nucleus cross section for the first time, overcoming the main problems of direct measurements. The THM has proven successful in several reactions linked to fundamental astrophysical topics (Spitaleri 1990; Spitaleri et al. 2000, 2001, 2004; Cherubini et al. 1996; Aliotta et al. 2000; Lattuada et al. 2001; Tumino et al. 2003, 2005, 2006, 2007, 2008, 2011a, 2011b; La Cognata et al. 2005, 2007, 2008, 2010, 2011, 2013; Lamia et al. 2007, 2008, 2012, 2013; Wen et al. 2008, 2011; Sergi et al. 2010a, 2010b; Gulino et al. 2010; Pizzone et al. 2011, 2013). To shed light on the side of the deuterium sink channels, the 2H(d,p)3H and 2H(d,n)3He reactions have been investigated via the THM applied to the 2H(3He,p3H)1H and 2H(3He,n3He)1H reactions in quasi-free (QF) kinematics with 3He as the Trojan Horse (TH) nucleus (Tumino et al. 2011a, 2011b). This represents the first application of the THM with the detection of the spectator nucleus, here the proton in the projectile 3He, instead of the reaction participants in earlier applications of the THM. For the 3He+n fusion channel, this is a complementary technique without the use of standard neutron detectors, which have poor granularity and low detection efficiency. For the 3H+p channel, it provides a cleaner reconstruction of the reaction mechanism because it removes QF events fed by target break-up from detection. Indeed, the kinematics of the spectator changes dramatically depending on whether it comes from projectile or target. A target-like spectator would not have enough energy to be detected. In the present case, the spectator is a projectile-like particle and its kinematics is focused at forward angles, broadened only by the Fermi motion inside the projectile.
The present paper reports on a full account of the measurements and related data analysis, including new data from an additional run for the 2H(d,p)3H reaction using the standard methodology of THM experiments. In addition, the first estimate of the electron screening for both 2H(d,p)3H and 2H(d,n)3He reactions is provided, based on experimental data by Greife et al. (1995) and reaction rates for both reactions are determined for the first time using experimental data from 2 keV up to 1.5 MeV, throughout the range of temperatures of interest for pure and applied physics. The influence of the new rates is investigated on the 7Li abundance, applying a recent abundance sensitivity study by Coc & Vangioni (2010), and on the central deuterium abundance in PMS stars with different masses exploiting an updated version of the FRANEC evolutionary code particularly suited for PMS calculations (Tognelli et al. 2011; Dell'Omodarme et al. 2012).
2. THE QUASI-FREE KINEMATICS REGIME AND THE TROJAN HORSE METHOD
Indirect techniques have been introduced to determine reaction rates for systems not easily measurable in a direct experiment. The limiting factor for direct measurements is the Coulomb barrier, which is much higher than the energies of interest, that causes the reaction to take place via a tunneling effect with an exponential decrease of the cross section, σ(E) ∼ exp (− 2πη), with η the Sommerfeld parameter,  . In addition, the electron screening of the nuclear charges under laboratory conditions becomes important at astrophysical energies and the projectile feels a reduced Coulomb barrier. This brings a higher cross section for screened nuclei, σs(E), compared to the one for bare nuclei σb(E) (Assenbaum et al. 1987; Strieder et al. 2001), which represents the relevant parameter for astrophysics. Therefore, the screening factor defined by the following relation:

with Ue the "electron screening potential" has to be taken into account to determine the bare nucleus cross section. So far, the only way to determine the bare nucleus cross section is by extrapolating the behavior of the higher energy data, or by calculating it at astrophysical energies using nuclear reaction theory. The extrapolation is done in terms of the astrophysical S(E) factor,

which represents a smoother function of the energy than the cross section. Extrapolation can be avoided using the THM, a unique way to measure the bare nucleus cross section for charged particle reactions at astrophysical energies (Spitaleri et al. 2011). This is done assessing the cross section of a closely related process (Tumino et al. 2013a and references therein). In the THM, the binary reaction of interest to be known at sub-Coulomb energies:

is replaced by a suitable 2 → 3 particle process

called the TH reaction, with the two linked by means of nuclear reaction theory. In the TH reaction, the major component of the particle a wave function is attributed to the x⊕s cluster configuration, with x being the target/projectile of the two-body reaction. The TH reaction is considered to be a transfer to the continuum, where the TH nucleus a breaks up into x, the transferred nucleus, and s, the spectator to the subprocess (3). The process takes place in the QF kinematics regime and gives the main contribution to the cross section in the three-body phase space, where the momentum transfer to the spectator s is small. Particle x plays a role in Equation (4) only as a virtual particle, thus its energy and momentum are not linked by the usual energy–momentum relation for a free particle. The QF mechanism can be sketched using a pole diagram (see Figure 1) (Shapiro 1968) with two vertexes referring to a break-up (upper vertex) and process (3) (lower vertex), with s as a spectator. The A+x subreaction takes place at sub-Coulomb, even negative, relative energy EQF, even though the A+a relative motion takes place at an energy above the Coulomb barrier. This condition ensures that the transfer of particle x occurs inside the nuclear field of A without undergoing Coulomb suppression or electron screening. The excess of energy in the A+a relative motion is pulled out for the break-up of the TH nucleus a = (xs). These key concepts can be translated into a formula using energy and momentum conservation rules:

with mi and  , mass and momentum of particle i, μij = mi mj/(mi + mj) reduced mass of particles i and j (B = A + x = c + C) and Bxs = ms + mx − ma the binding energy of clusters x and s inside a. In Equation (5), a change in EQF is accomplished by varying the ps variable, the momentum of the spectator particle, and/or its emission angle to upper limits of few tens of MeV/c and few degrees, respectively. These values are derived from the theoretical upper limit for the relative momentum pxs between x and s (in the laboratory system
  ) given by
  which represents the on-energy-shell (OES) a = (xs) bound state wave number (Shapiro et al. 1965).
In the initial idea by Baur (1986), the cutoff in ps was much higher, of hundreds of MeV/c, because it was needed to compensate for the A+a relative motion. However, this condition is not suitable for a number of reasons already pointed out in Spitaleri et al. (2011) and Tumino et al. (2013b). This new THM idea is much more reliable for determining the cross section of the process (3).
3. THEORETICAL FORMALISM
The THM has been formulated using different theoretical frameworks. The plane wave impulse approximation (PWIA) has been widely used, because of the simple factorization of the THM three-body cross section in terms of the two-body cross section of process (3), the momentum distribution of the spectator, and a kinematical factor. Recently, more advanced formulations have been introduced. In the present work, the approach based on a modified plane wave born approximation (Typel & Wolter 2000; Typel & Baur 2003; Spitaleri et al. 2001; Tumino et al. 2004, 2003) was applied. This approach retains the factorization of the three-body cross section, making use of the surface approximation to derive an expression of the three-body T-matrix element in terms of the S-matrix elements of process (3) and replacing the distorted waves in the T-matrix element with plane waves. The assumption of the surface approximation is that the largest contribution to the matrix element comes from reactions at the surface of the nuclei, due to optical potentials that are strongly absorptive for small distances between the colliding nuclei. Thereby, the full scattering wave function can be replaced by its asymptotic form for radii larger than a cutoff radius R, which matches with the sum of the radii of the two colliding nuclei. With these approximations, the energy dependence of the cross section for process (3) remains unchanged and the triple differential cross section is given by
where the interference from different partial waves l is disregarded; B denotes the C+c system as before; dσl/dΩ stands for the on-shell two-body cross section for the inverse of process (3) in partial wave l, and Cl is its scaling factor. The penetrability factor

with the regular Fl and irregular Gl Coulomb functions, is introduced to compensate for the Coulomb suppression of dσl/dΩ. The momentum amplitude  relates to the wave function of the TH nucleus a in momentum space and is given by
with  given by
KF is a kinematical factor,
The argument of the Legendre polynomial Pl corresponds to the cosine of the c.m. scattering angle of the two-body reaction. The expression (6) looks like the PWIA factorization (Jain et al. 1970), with the inclusion of the Coulomb penetrability and, similarly, does not provide the absolute value of the two-body cross section. Nonetheless, it can be obtained from a normalization of available higher energy direct data.
4. THE EXPERIMENT
The 2H(3He,p3H)1H and 2H(3He,n3He)1H reactions were investigated at the Nuclear Physics Institute of ASCR in Rez near Prague. Two experimental runs were performed at 17 and 18 MeV of beam energy, the first one being focused only on the investigation of the 2H(3He,p3H)1H reaction. A 3He cyclotron beam with a spot size on target of 1.5 mm and intensities up to 3 pnA, was delivered onto a CD2 target of about 150 μg cm−2. Schematic diagrams of the experimental setups are shown in Figures 2 and 3. In both cases the experimental setups consisted of a telescope (20 μm silicon detector as ΔE− and 1000 μm position sensitive detector (PSD) as E-detector) placed on one side with respect to the beam direction, covering angles from 20° to 30° (5° to 15°), and the other two telescopes (similarly assembled) placed on the opposite side, at angles 20°–30° (5°–15°) and 50°–60° (24°–36°). The less forward telescope was devoted to the detection of p in the first run and of 3H/3He in the second one. The intrinsic α resolution of a standard PSD is quoted as 300 μm for the position and about 0.5% for the energy. The same energy resolution applies to the ΔE detectors. Two pairs of coincidence telescopes could record p–3H/3He coincidences, the first one consisting of the two most forward telescopes placed at symmetric angles and the second one is formed by the less and the most forward detectors placed at opposite sides. The trigger for the event acquisition was given by the coincidences between the two symmetric PSDs (with off-line selection of p–3H/3He coincidences) as well as between any two of them detecting a 3H (first experiment) or a proton (second experiment), and the less forward PSD dedicated to the detection of a proton (first experiment) or 3H/3He (second experiment). In the first run, the standard procedure to detect particles involved in the 2H(d,p)3H two-body reaction was applied. The experiment suffered from low statistics and only coincidences from the two asymmetric telescopes placed at opposite sides, with respect to the beam direction, could be used for data analysis, due to a failure in the other forward telescope. In the second run, a novel technique was applied, based on the detection of the proton, which acts as spectator to both 2H(d,p)3H and 2H(d,n)3He binary reactions. The spectator proton, which comes from projectile break-up, is essentially focused at forward angles. This has allowed us to cover the QF phase space region almost completely and also to rule out QF events proceeding from a target break-up, whose proton spectator has a completely different kinematics and much lower energy. In addition, the role of the detected proton in the 3H+p+p channel is well defined, the energy ranges of participant and spectator protons not overlapping. At the same time, this technique made it possible to investigate the 2H(d,n)3He reaction overcoming all the experimental problems usually connected with the detection of neutrons. The angular regions covered by the detectors were optimized for measuring the break-up process of interest in QF kinematics, and the investigated range of proton momentum values was feasible to check the existence of the QF mechanism.
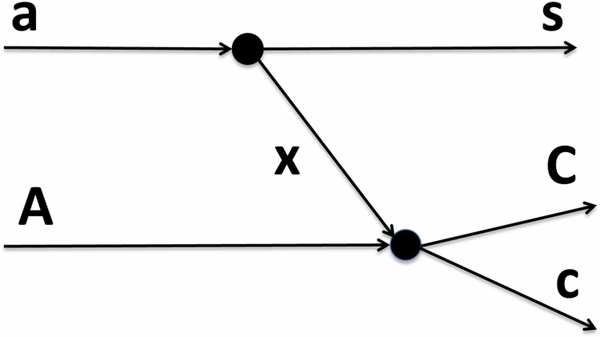
Figure 1. Pole diagram of the a + A → C + c + s quasi-free reaction.
Download figure:
Standard image High-resolution image
Figure 2. Schematic description of the experimental setup for the 18 MeV experiment.
Download figure:
Standard image High-resolution image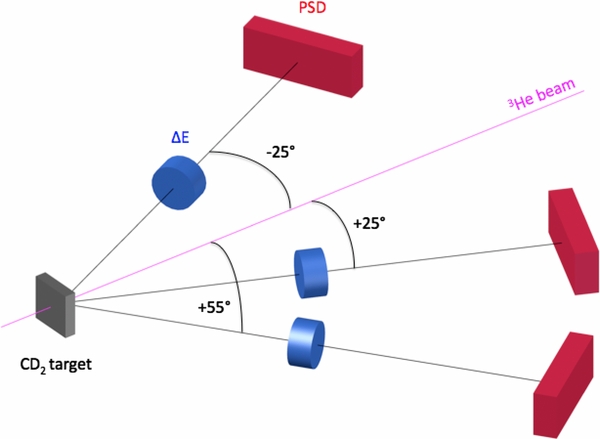
Figure 3. Schematic description of the experimental setup for the 17 MeV experiment.
Download figure:
Standard image High-resolution image5. DESCRIPTION OF DATA ANALYSIS AND FINAL RESULTS
A number of steps are involved in the data analysis before the reaction rate of astrophysical relevance can be determined. These steps include: (1) identification of events due to the three-body reaction of interest; (2) selection of QF events; (3) extraction of the two-body cross section from the measured three-body one for both 2H(d,p)3H and 2H(d,n)3He processes and normalization to direct data; (4) determination of the astrophysical S(E) factors, and estimate of the screening potential from comparison with direct data in the region where screening becomes important; and (5) calculation of the reaction rates for both reactions and evaluation of their impact on the astrophysical scenarios of SBBN and PMS. Each of these steps is described in detail in the following subsections, together with a number of tests to cross-check the validity of the results obtained so far.
The energy calibration of each PSD was performed by means of a standard α source and data from elastic scattering of 3He on 197Au, 2H and 12C at beam energies of 17 and 18 MeV. During these preliminary runs, grids with equally spaced slits were placed in front of each PSD to accomplish the calibration in position.
5.1. Channel Selection
Channel selection was achieved by gating on the ΔE−E two-dimensional (2D) plots to select coincident proton and 3He/3H loci. A typical ΔE−E 2D plot is shown in Figure 4, where the proton, triton, and 3He loci are clearly visible. The kinematics were reconstructed under the assumption of either a proton (for the p+3H channel) or a neutron (for the n+3He channel) as undetected particle. The Q-value spectra for the selected events are reported in Figures 5 (p+3H channel) and 6 (n+3He channel).
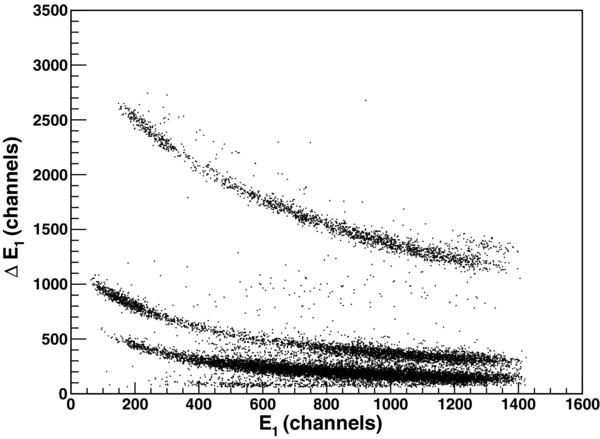
Figure 4. Typical ΔE vs. E 2D plot. From the bottom to the top, the strongest loci correspond to p, 3H, and 3He.
Download figure:
Standard image High-resolution image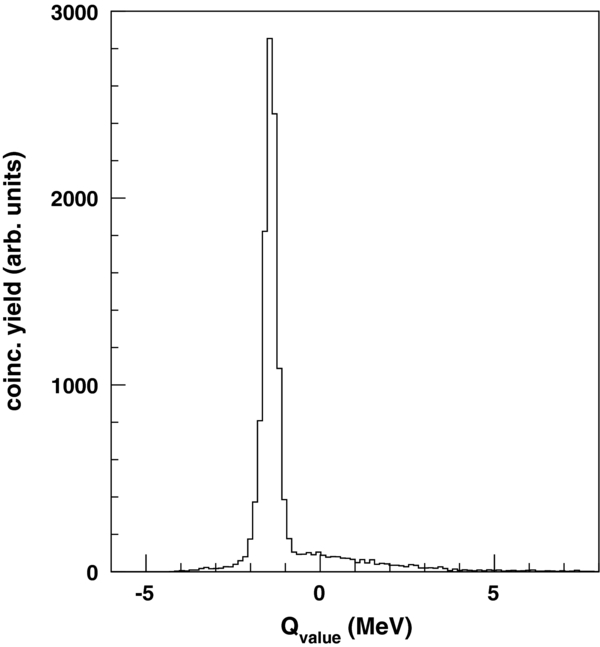
Figure 5. Three-body Q-value spectrum, after selection of proton and triton loci in the ΔE vs. E 2D plots. A dominant peak centered at about −1.4 MeV can clearly be seen.
Download figure:
Standard image High-resolution image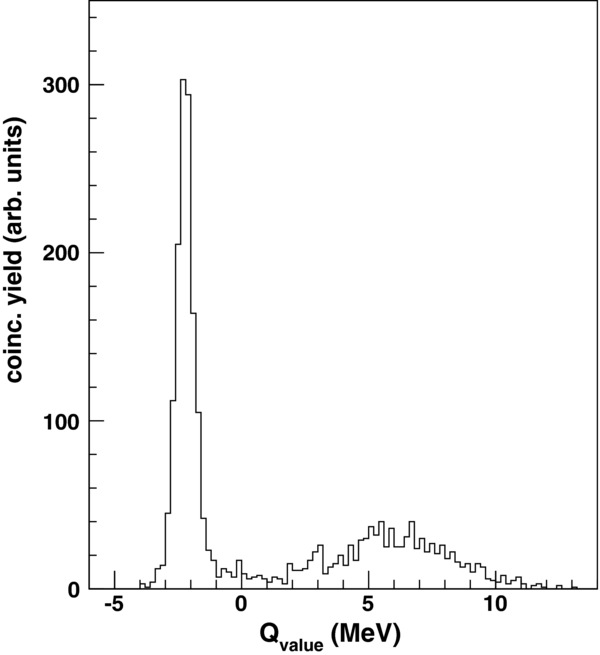
Figure 6. Three-body Q-value spectrum for the run at 18 MeV, after selection of proton and 3He loci in the ΔE vs. E 2D plots. A dominant peak centered at about −2.2 MeV is clear.
Download figure:
Standard image High-resolution imageA prominent peak is observed in each figure around E = −1.5 MeV (Figure 5) and E = −2.2 MeV (Figure 6) in very good agreement with the theoretical Q values of −1.46 MeV and −2.22 MeV for the p+3H+p and n+3He+p three-body channels of interest, respectively. No other reactions contribute, except a small background not larger than 4%. This confirms the correct identification of the reaction channel, as well as the accuracy of the calibration. Only events inside these peaks were selected for the further analysis.
5.2. Experimental Evidence of the QF Mechanism
After selecting events belonging to the 2H(3He,p3H)1H and 2H(3He,n3He)1H reactions, the next step is to determine the contribution of the QF process to the total coincidence yield. This is necessary because the equations exploited are valid only upon the assumption that particle s, here the proton, acts as a spectator to the A − x interaction. Indeed, the analysis of the experimental results can reveal the presence of other reaction mechanisms, such as sequential decay (SD) and direct break-up, filling up the same final state. A study of the reaction dynamics can be carried out looking into the relative energies for any two of the three final particles, deduced from the measured energies and emission angles, for possible excitations of their respective intermediate systems. In the present case, SD mechanisms may only be due to the excitation of 4He levels above 20 MeV of excitation energy that feed the two p+3H and n+3He exit channels. However, none of these levels can be seen as resonances, their widths being of the order of 5–10 MeV. Thus, no useful information can be gathered from the investigation of relative energy spectra.
A physical quantity very sensitive to the reaction mechanism is the shape of the experimental momentum distribution of the spectator. Only in the case of 3He QF break-up does the proton momentum distribution keep the same shape as inside 3He. Thus, the agreement between the shape of the theoretical 3He momentum distribution and the experimental one is a clear signature of the occurrence of the QF mechanism (Spitaleri et al. 2004; Tumino et al. 2008). To establish the momentum dependence of the coincidence yield, the modulation due to possible feedings of 4He states has to be removed. This is achieved by deducing the proton momentum distribution within p+3H/n+3He relative energy bins of 100 keV. To correct for the phase-space effects, a Monte Carlo simulation was performed considering the angular ranges in the experiment and the real detection thresholds. The experimental momentum distribution obtained for both 2H(3He,p3H)1H and 2H(3He,n3He)1H reactions experience the same shape. As an example, the momentum distribution from the 2H(3He,p3H)1H reaction is shown in Figure 7 as black full circles.
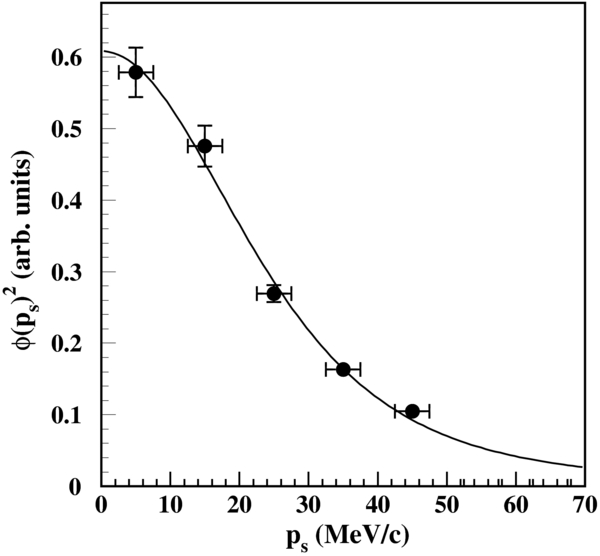
Figure 7. Experimental proton momentum distribution from the 2H(3He, p3H)1H reaction (full dots). The solid line is the theoretical shape (see the text for details).
Download figure:
Standard image High-resolution imageData are projected in 10 MeV/c bins over the momentum axis of the detected proton, ps, with error bars only including statistical errors. The theoretical distribution, shown as a solid line, refers to a Wood–Saxon p − d bound state potential with standard geometrical parameters r0 = 1.586 fm, a = 0.50 fm, and V0 = 53.858 MeV (Pizzone et al. 2009). The shape agreement within 3% between the experimental momentum distribution and the theoretical one is a clear signature of the existence and dominance of the QF mechanism. This 3% enters in the further extraction of the astrophysical S(E) factor as the systematic uncertainty coming from theory (Pizzone et al. 2005a, 2009; Mukhamedzhanov et al. 2006, 2008; La Cognata et al. 2010). Thus, the factorization of Equation (6) is reliable for the present investigation and the QF mechanism is dominant in the phase space here spanned. In further analysis, only coincidence events within 40 MeV/c were considered.
5.3. Parameterization of the 2H(d,p)3H and 2H(d,n)3He Two-body Cross Sections
The functional form of the 2H(d,p)3H and 2H(d,n)3He two-body cross sections was determined starting from previous R-matrix calculations by Descouvemont et al. (2004). If no resonance is present in the energy range investigated, the R-matrix can be parameterized by a constant value. This is the case in the present study and two non-resonant components for the l = 0 and l = 1 partial waves are needed in the whole relative energy Edd region investigated. In this way, we account for the several 4He levels feeding the 3H+p and 3He+n decay channels, which, as mentioned, do not contribute as promiment resonances because of their huge widths from 5 to 10 MeV. Nonetheless, they are also responsible for the anisotropies in the angular distributions, as shown later. With orbital angular momentum l = 0, possible Jπ values are 0+ and 2+, whereas l = 1 yields Jπ = 0−, 1−, 2−.
Given that the energy dependence of the s- and p-wave contributions is essentially provided by their penetrability factors (Descouvemont et al. 2004), the functional form of the binary cross section was assumed as
with C + c = t+p or 3He+n in the present case. The relative energy Edd and the momentum kdd are connected in QF kinematics by Equation (6), which in the present case becomes

with the reduced mass μdd and the binding energy Bdp of 3He with respect to the d+p threshold. Edd is determined from the measured p3H/n3He relative energies by means of the energy conservation law and it is referred to as Ecm, as given by (Spitaleri et al. 2011)

with  and Q2 − body relative energy and Q value, respectively, of any two of the exit channels.
To fix the contributions of the two partial waves l = 0 and l = 1 to the three-body coincidence yield, Equation (11) enters the factorization of Equation (6) in a Monte Carlo simulation (Tumino et al. 2003), based on the theoretical approach reported in (Typel & Wolter 2000; Typel & Baur 2003; Tumino et al. 2003), under the assumption that the reaction proceeds through a pure QF mechanism. The theoretical distribution so obtained needs to fit the experimental three-body coincidence yield using the scaling factors Cl and the channel radius R as free parameters. As mentioned above, for the 18 MeV run each fusion channel has triggered two couples of coincidence detectors and thus two coincidence yields have to be fitted at the same time. This constraint helped to unequivocally fix how to distribute the measured THM cross section to the l = 0 and l = 1 components for the further extraction of the S(E) factor. For the 17 MeV run, this procedure was applied only to the working pair of coincidence detectors, providing scaling factors that are consistent within few percent with those from the 18 MeV run. An example of the TH coincidence yield, projected onto the Edd relative energy axis, is shown as solid dots in Figure 8. The solid line superimposed onto the distribution represents the corresponding fit from Edd = 1.5 MeV down to zero. The best description of the THM yields were obtained for relative weight C0/C1 = 1.3 ± 0.14 (1.2 ± 0.13) and R = 6.15 ± 0.05 fm (5.25 ± 0.04 fm) for the 3H+p (3He+n) case with an overall  of 0.24 (0.54). Values for R are similar to the channel radii in the R-matrix analysis reported in Descouvemont et al. (2004).

Figure 8. Coincidence yields for the TH 2H(3He,p3H)1H reaction projected onto the Ecm relative energy axis shown as solid dots for the symmetric coincidence detectors (see the text for details). The red solid line superimposed onto the distributions represents the related fit from Ecm = 1.5 MeV down to zero.
Download figure:
Standard image High-resolution image5.4. Angular Distributions
Owing to the virtual character of cluster x (2H in the present case), the THM provides the half-of-energy-shell (HOES) binary cross section (Tumino et al. 2007, 2008). Thus, an angular distribution analysis of the fragments is needed to check if the different partial waves enter in the same way in both the on-shell and HOES cross sections. A positive result would mean that no distortions are induced by the emitted deuteron. The invariant scattering angle in direct measurements is determined as the angle between the relative momenta of the final and initial particles. In the c.m. system of the subreaction, such an angle is the one between the momentum of any of the two fragments (p/n or 3H/3He) and the beam direction. The corresponding invariant TH angle was calculated as reported in Slaus et al. (1977), for the case of projectile QF break-up, and is given by
with c+C = p+3H or n+3He and  the momentum of the transferred particle. Angular distributions for both 2H(d,p)3H and 2H(d,n)3He reactions were extracted for several energies. In the 18 MeV experiment, θcm ranges from 40° to 120°, with the most forward couple of coincidence telescopes, and from 140° to 170° with the second one, consisting of the less and the most forward detectors placed at opposite sides. For the 17 MeV run, θcm goes from 80° to 100°. A comprehensive systematics is shown in Figures 9 (3H+p channel) and 10 (3He+n channel) for Edd = 20, 50, 130, 270, 980 keV, and 1.25 MeV (±30 keV) as full dots. The solid lines represent the results of fits on the OES distributions measured at those energies (Krauss et al. 1987; Schulte et al. 1972). Due to the identical boson character in the entrance channel, those fits have been performed using only even Legendre polynomials with a maximum order of four. A good agreement is observed, as supported by the following
  values for 3H+p/3He+n: 0.29/0.25 at 20 keV, 0.33/0.36 at 50 keV, 0.28/0.37 at 130 keV, 0.36/0.49 at 270 keV, 0.37/0.28 at 980 keV, and 0.35/0.33 at 1.25 MeV. The positive results confirm our hypothesis about the partial wave relative contribution and gives further confidence on the validity of the theoretical approach to extract the THM S(E) factor.
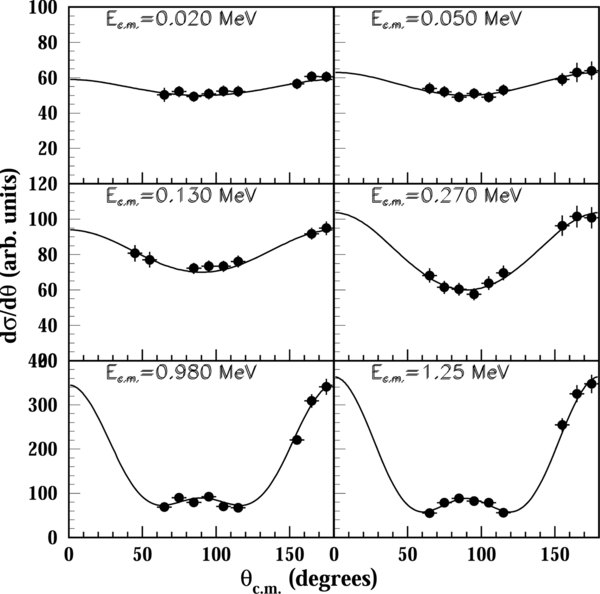
Figure 9. THM angular distributions of the d + d → 3H + p reaction for Ecm = 0.020, 0.050, 0.130, 0.270, 0.980, and 1.25 MeV. Solid lines represent available fits of direct data by Krauss et al. (1987) and Schulte et al. (1972).
Download figure:
Standard image High-resolution image
Figure 10. THM angular distributions of the d + d → 3He + n reaction for Ecm = 0.020, 0.050, 0.130, 0.270, 0.980, and 1.25 MeV. Solid lines represent available fits of direct data by Krauss et al. (1987) and Schulte et al. (1972).
Download figure:
Standard image High-resolution image5.5. Extraction of the S(E) Factors
The S(E) factor from both the 2H(d,p)3H and 2H(d,n)3H reactions was determined from the definition in Equation (4), using the combination of the two l = 0 and l = 1 components as given in Equation (11) as σ(E), with the scaling ratio C0/C1 fixed from the fit to the three-body coincidence yields as explained before. For the 2H(d,p)3H reaction, results from the 17 and 18 MeV runs were combined accounting for their 10% and 4% statistical errors, respectively. An error calculation for Edd was performed, leading to a value of about 20 keV. The S(E) factors thus obtained must be normalized to the direct data in a region with Edd > 15 keV, where electron screening effects are still negligible. However, available sets of data below 200 keV have different accuracies and evaluations of past work on both 2H(d,p)3H and 2H(d,n)3H reactions indicated the possibility of large systematic errors in some of these data sets (Angulo et al. 1999). A classification of direct data available in the literature is reported as follows.
- 1.McNeill & Keyser 1951. p+3H channel: Ecm = 0.06–0.15 MeV, statistical error: 3%–6%; systematic error: up to 20%.n+3H channel: Ecm = 0.06–0.125 MeV, statistical error: 3%–6%; systematic error: up to 20%;
- 2.Schulte et al. 1972. Ecm = 0.98–3.1 MeV, total error: 0.25%–0.28%.
- 3.The First Research Group 1985. Ecm = 15.3–150 keV, total error: 3.6%–4.8%.
- 4.Krauss et al. 1987. p+3H channel: Ecm = 2.98–49.67 keV, statistical error < 1% above 6 keV and 4%–15% below 6 keV;3He+n channel: Ecm = 2.63–49.67 keV, statistical error from 1.3% to 10%; for both channels two quoted systematic errors from independent sources: 6.4% and 5% (due to variations in the alignment of beam and jet target profiles).
- 5.Brown & Jarmie 1990. p+3H channel: Ecm = 9.97–58.45 keV, statistical error: 0.42%–1.3% except in the lowest point (2.8%),3He+n channel: Ecm = 9.97–58.45 keV, statistical error: 0.46%–1.8% except in the lowest point (5%), for both channels systematic error: 1.3%.
- 6.Greife et al. 1995. p+3H channel: Ecm = 1.62–14.95 keV in close geometry and 14.85–128 keV in far geometry, total error: 0.7%–1.5% in close geometry except in the lowest point (15%) (to be more precise, from 1.5% up to 15% below 3 keV, <1.5% between 3 and 10 keV and 1% between 10 keV and 15 keV) and 3%–4% in far geometry;3He+n channel: Ecm = 2.4–13.1 keV in close geometry (no absolute cross section, only relative ratio) and 14.85–128 keV in far geometry, total error: 0.6%–2.9% in close geometry and 3%–4% in far geometry.
- 7.Leonard et al. 2006. Ecm = 55–325 keV, total error: about 4%.
Seeking to benefit from the information given for the individual data sets in the references, the THM S(E) factor was normalized to all cited experimental data in the range Edd = 15 keV–1.5 MeV. However, it is practically impossible to separate the statistical and systematic errors for each direct data set, because in several cases not enough information is provided. This indicates that the total errors should be used to find the most probable normalization, assuming that the systematic errors are independent for the different data sets. It is reasonable to use a weighted normalization, where data sets with larger errors constrain the normalization less. The number of THM data points overlapping with direct data chosen for the normalization is 20 for the 17 MeV run and 43 for the 18 MeV one. As a result, the 4% (10%) THM statistical error entering the normalization is divided by  (
( ), thus supplying a 0.61%(2.2%) uncertainty. This uncertainty, combined in quadrature with that of direct data in the weighted normalization, provides an overall normalization error of about 1% (2.3%). This small error is essentially provided by those direct points with total error of less than 1%, which drive the normalization procedure in terms of absolute value as well as normalization uncertainty.
The robustness of this procedure was checked for the 18 MeV experiment, with a normalization for each individual data set below 300 keV combined with the higher energy data by Schulte et al. (1972) for both 3H+p and 3He+n channels. This provided very consistent results with a total normalization error of about 0.9% for 3H+p and 0.94% for 3He+n (Tumino et al. 2011a, 2011b). From these, one can comment that data sets from Greife et al. (1995) (in "far geometry"), The First Research Group (1985), Brown & Jarmie (1990), Leonard et al. (2006), and Schulte et al. (1972) are quite consistent, in particular for the 3H+p channel, whereas those by Krauss et al. (1987) and McNeill & Keyser (1951) reflect a normalization problem due to the quoted systematic errors, despite a very small statistical uncertainty (⩽1% and 3%, respectively).
The THM S(E) factors of the 2H(d,p)3H and 2H(d,n)3He reactions are shown in Figures 11 and 12, respectively, as black symbols (full squares and full circles for the 17 and 18 MeV run, respectively), with uncertainties accounting for statistical and normalization errors. TH data for the p+3H run at 17 MeV experience a larger scatter with respect to those at 18 MeV, due to the lower statistics in that experiment. Nonetheless, a fair agreement between them is apparent and this is the proof of consistency of the two independent 2H(d,p)3H experiments. Direct data from the different sources are shown as colored symbols, as reported in the legend. Their overall trend shows a large scatter, with deviations of more than 15%, in particular in the 3He+n channel, where a new direct study of the cross section over a larger energy region would be desirable. In contrast, the THM S(E) factors exhibit a much smoother behavior, with deviations from the direct data at ultra-low energies (see Figure 11), because of the screening, and in the SBBN region (see Figure 12). For a complete investigation, the THM S(E) factors for both the 2H(d,p)3H and 2H(d,n)3He reactions were also compared to previous polynomial/R-matrix fits to direct data (Cyburt 2004; Descouvemont et al. 2004), usually exploited in the calculation of the reaction rates, and to the results of recent ab initio calculations using realistic NN interactions (Arai et al. 2011). The comparison is shown in Figures 13 and 14, respectively, using black symbols (full squares and full circles for the 17 and 18 MeV run, respectively) to represent THM data, green (Angulo et al. 1999), blue (Cyburt 2004), and yellow (Descouvemont et al. 2004) dashed lines for earlier fits and a red dashed line for the ab initio calculations. For the 3H+p channel, the green line seems to describe the low-energy trend of TH data, whereas for Ecm > 200 keV the blue line is more appropriate. For the 3He+n channel, the green line matches the full trend, although the slope is not the same. However, the polynomials of Angulo et al. (1999) resulting in the green line were fitted only to the low-energy direct data and it cannot be expected that they could reproduce the full energy covered in the THM experiments. The blue lines at low energy fall below the THM data. The origin of this behavior, already observed for most of the direct data, is discussed in Cyburt (2004). The yellow lines resulting from the R-matrix fits of Descouvemont et al. (2004) resemble the green line for the 2H(d,p)3H reaction and the blue line for the 2H(d,n)3He one. The red lines from ab initio calculations (Arai et al. 2011) are systematically higher than THM data for Ecm > 30 keV. Similar behavior is shown in the comparison to direct data reported in Figure 3 of their paper (Arai et al. 2011), although it is not very obvious, due to the chosen scaling of the y axis. Considering that the ab initio approach gives absolute values of the cross section, it is remarkable that the deviation from experimental data is less than 10% in most cases. For the 3H+p channel, the red lines are comparable to the THM data at the lowest energies, which is not the case for the 3He+n channel, where red lines experience a much steeper energy dependence. This might be caused by not reproducing the exact binding energies of the nuclei and, as a consequence, the Q value of the reaction in the calculation. An updated theoretical calculation based on improved realistic microscopic potentials is required.

Figure 11. S(E) factor for the 2H(d,p)3H reaction: black solid squares and circles are THM data (17 and 18 MeV respectively); colored symbols represent direct data as described in the legend.
Download figure:
Standard image High-resolution image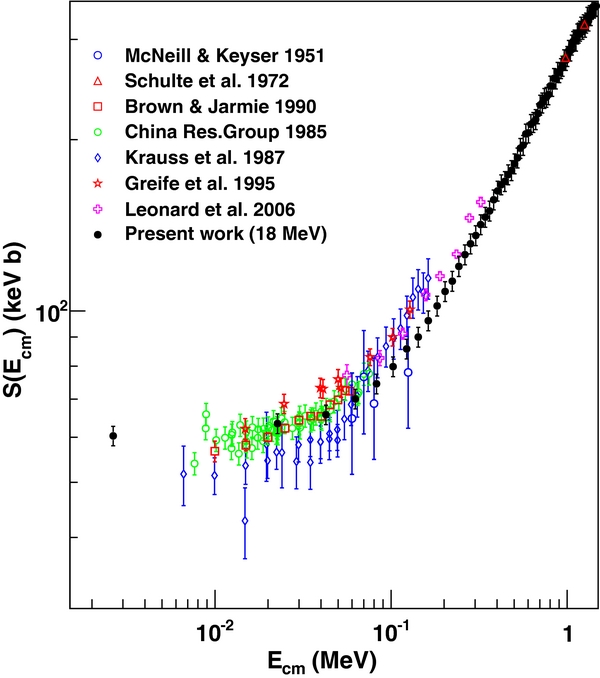
Figure 12. S(E) factors of the 2H(d,n)3He reaction. Same meaning for symbols as in Figure 11.
Download figure:
Standard image High-resolution image
Figure 13. THM S(E) factor for the 2H(d,p)3H reaction (black solid squares (from the 17 MeV run) circles (from the 18 MeV run)) compared to the results of polynomial/R-matrix fits and ab initio calculations, shown as green (polynomial by Angulo et al. 1999), blue (polynomial by Cyburt 2004), yellow (R matrix by Descouvemont et al. 2004), and red (ab initio by Arai et al. 2011) dashed lines.
Download figure:
Standard image High-resolution image
Figure 14. THM S(E) factor for the 2H(d,n)3He reaction (black solid circles) compared to the results of polynomial/R-matrix fits and ab initio calculations. Same meaning for colors as in Figure 13.
Download figure:
Standard image High-resolution imageA new parameterization of the THM S(E) factor, based on the present data, is given here for both channels as a sum of the theoretical l = 0 and l = 1 components. Bringing Equation (11) for the two-body cross section in the definition of the S(E) factor (Equation (4)) with the relative weight C0/C1 = 1.3 ± 0.14 (1.2 ± 0.13) for the 3H+p (3He+n), obtained from the fit to the measured three-body coincidence yields, one is left with the total S(E) factors shown as black solid lines in Figures 15 (3H+p) and 16 (3He+n). The l = 0 and l = 1 contributions are also shown as red and blue solid lines, respectively. THM data from both the 17 (red open squares only in Figure 15) and 18 MeV (red open circles) experiments are also reported. The solid lines for the 3H+p channel are the result of a weighted average of the parameterizations from the 17 and 18 MeV runs, with the total uncertainty of THM data from each run (10% and 5%, respectively) as relative weight. The lines essentially resemble those reported in Tumino et al. (2011a, 2011b), based only on the 18 MeV data. This is due to the close agreement between THM data from the two experiments and to the procedure that favors the most accurate 18 MeV data. To better compare the THM results with the direct data, the residuals to the theoretical THM curves were derived following the prescriptions reported in Cyburt (2004). The residual scatter in the direct data about the TH curves was divided by the weighted dispersion σ (1.82 keVb for the p+3H and 4.24 keVb for the n+3He channel), as given by
with yi and σi direct data points and its total uncertainty, respectively, and μ the corresponding S(E) value on the THM theoretical curve (black solid line) at the same energy. Residuals are shown in Figures 17 and 18; the dashed horizontal lines represent the 1σ error bars. These kinds of scatter diagrams provide an easier visualization of the dispersion of each direct data set about the THM S(E) factor and one may further comment on the quality and reliability of the direct experimental data. One can observe that the group of data by Brown & Jarmie (1990), The First Research Group (1985), and Leonard et al. (2006; only for the 3H+p channel) converge to practically the same normalization, with the first two being affected by a smaller uncertainty. For the 3He+n channel, data by Leonard et al. (2006) turn out systematically above the THM S(E) factor. Data by Greife et al. (1995) in far geometry, which are less precise than their data in close geometry, appear to have a higher independent normalization. Data by Krauss et al. (1987) and McNeill & Keyser (1951) are affected by systematic uncertainties from independent sources that are probably responsible for their steeper slope with respect to that of the other data sets.

Figure 15. Parameterization of the S(E) factor for the 2H(d,p)3H reaction (black solid line) with superimposed THM data from both the 17 MeV (open squares) and 18 MeV (open dots) experiments. The theoretical l = 0 and l = 1 contributions are shown as red and blue solid lines, respectively.
Download figure:
Standard image High-resolution image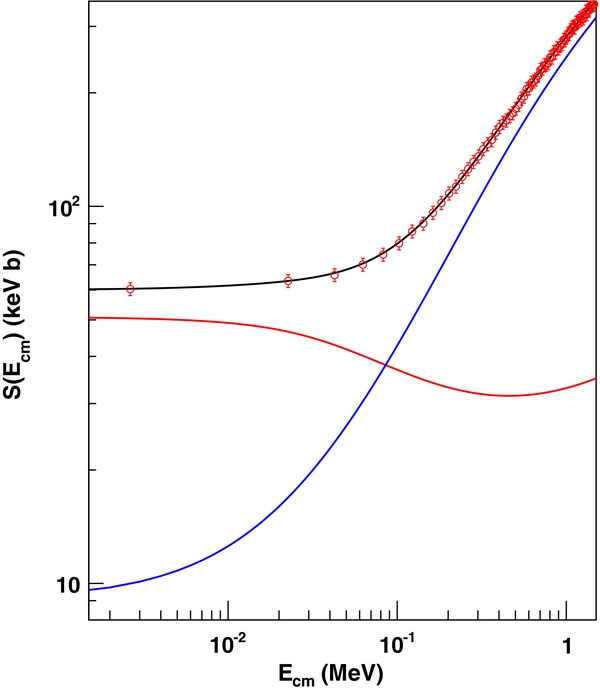
Figure 16. Parameterization of the S(E) factor for the 2H(d,n)3He reaction (black solid line) with superimposed THM data as open dots. The theoretical l = 0 and l = 1 contributions are shown as red and blue solid lines.
Download figure:
Standard image High-resolution image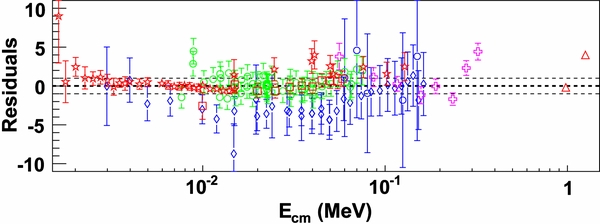
Figure 17. 2H(d,p)3H reaction: residuals of direct data (colored symbols as in Figure 11) to the black solid line of Figure 15, with dashed lines indicating the 1σ error bars (see the text for details).
Download figure:
Standard image High-resolution image
Figure 18. 2H(d,n)3He reaction: residuals of direct data (colored symbols as in Figure 12) to the black solid line of Figure 16, with dashed lines indicating the 1σ error bars (see the text for details).
Download figure:
Standard image High-resolution imageFrom the present work, the S(0) values are 57.7 ± 1.8 keVb for 3H+p and 60.1 ± 1.9 keVb for 3He+n, with uncertainties including the normalization error and the one coming from theory, combined in quadrature. These values differ by 15%–20% from those usually taken as reference (Angulo et al. 1999; Cyburt 2004; Descouvemont et al. 2004), and the present ratio (3H+p/3He+n) of 0.96 ± 0.04 contrasts with their estimates, which are larger than one. Our ratio agrees with that of Greife et al. (1995) using screened data, thus providing an additional test of the isotopic invariance of the electron screening. Our ratio is also consistent with the value predicted by Kimura & Bonasera (2007), based on the difference in Q values of the two mirror d+d fusion processes.
5.6. Evaluation of the Screening Potential
The lack of screening effects in the THM S(E) factors gives the possibility to return the screening potential Ue from comparison with direct data. The only data that allows for an extraction of Ue are those of Greife et al. (1995) in "close geometry," whose screened behavior below 15 keV is clearly visible in Figure 11. These data are not in absolute units and first require a renormalization to the THM S(E) factor. This was done by normalizing the point at 14.95 keV to the THM Sbare(E) (the black solid line of Figure 15), and then performing a weighted fit to the whole data set with the screening function (Equation (1)), with Ue as free parameter. This brings it to a value of Ue = 13.4 ± 0.6 eV, which is below the adiabatic limit (14 eV) for a molecular deuteron gas target, but consistent with it if the uncertainty is considered. The uncertainty accounts for the 5% from THM data, 1.5% from data by Greife et al. (1995) in "close geometry," and 1.8% errors from the fit procedure, combined with the standard error propagation. The result is shown in Figure 19 as a black dashed line, with only the low-energy data by Greife et al. (1995) used for the fitting procedure (red solid stars) and the THM Sbare(E) (black solid line).

Figure 19. "Ingredients" to determine the screening potential Ue for the 2H(d,p)3H reaction: low-energy data by (Greife et al. 1995) is shown as red stars and THM Sbare(E) as the black solid line. The black dashed line represents the result of the fit to the red stars (see the text for details).
Download figure:
Standard image High-resolution imageA tentative estimate of Ue can also be derived for the n+3He channel, using the cross section ratio 3H+p/3He+n reported in Greife et al. (1995). Several technical problems prevented a precise analysis of the 3He+n channel to be carried out in close geometry in the ultra-low energy region. Nonetheless, as already mentioned, the authors were able to provide the cross section ratio between the two channels from 13.1 down to 2.4 keV in close geometry. Multiplying this ratio by the corresponding low-energy 3H+p direct data already normalized to the THM Sbare(E), this gives a normalized 3He+n data set systematically underestimated by a factor 1.02 with respect to the higher energy data in far geometry by the same authors (Greife et al. 1995). If the normalization of these low-energy data is corrected by this factor, the absolute units in the crossing region between data sets in close and far geometry become consistent.
This is shown in Figure 20, where red stars represent direct data by Greife et al. (1995) in "close geometry" with the additional 1.02 factor in the normalization, and the blue star corresponds to the lowest energy point obtained in "far geometry." Solid lines have the same meaning as in Figure 19. When fitting these low-energy data for the 3He+n channel with the same screening function as before (dashed line in Figure 20), this provides a Ue value of 11.7 ± 1.6, in agreement within the experimental errors with those extracted from the 3H+p channel. These results strongly disagree with Ue = 25 ± 5 eV by Greife et al. (1995), possibly because this value was obtained using different bare nucleus S(E) factors for the normalization and/or because of an overestimate of the lowest energy point affected by a larger uncertainty, with respect to that of the other data in "close geometry." A future upgrade in the accuracy of direct low-energy data would be helpful to fix the electron screening potential.
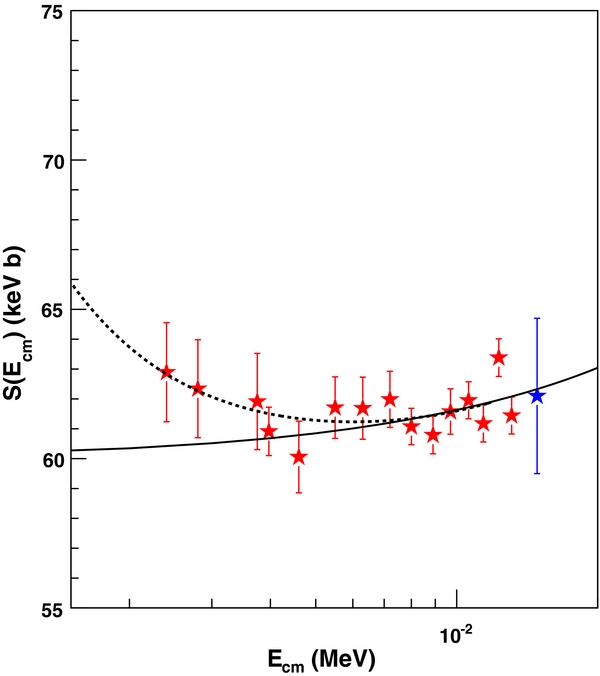
Figure 20. "Ingredients" to determine the screening potential Ue for the 2H(d,n)3He reaction: low-energy data by (Greife et al. 1995) is shown as red stars (additional 1.021 factor in the normalization) and THM Sbare(E) as the black solid line. The blue star represents the lowest energy point obtained by the same authors in far geometry. The black dashed line is the result of the fit to the red stars (see the text for details).
Download figure:
Standard image High-resolution image5.7. Determination of the Reaction Rates and Astrophysical Implications at SBBN and PMS Temperatures
The reaction rates for the 2H(d,p)3H and 2H(d,n)3H processes were calculated assuming the bare nucleus S(E) factors from the THM measurement. The reaction rate between particles 1 and 2, R = NA〈σv〉 (measured in cm3/(s mol)), can be written following Iliadis (2007) as
with T9 = T/109 K, where T is the temperature of the astrophysical site; m1 and m2 are the particle masses in a.m.u.; and the cross section σ is measured in barns b. The numerical values of the reaction rates for the 2H(d,p)3H and 2H(d,n)3He processes are reported in Table 1.
Table 1. Recommended Values of the TH Reaction Rates for the 2H(d,p)3H and 2H(d,n)3He Reactions Between T9 = 0.001 and 1
| T9 | Rate p+3H | exp | Rate n+3He | Exp |
|---|---|---|---|---|
| 0.001 | 1.49 | 10−8 | 1.56 | 10−8 |
| 0.002 | 6.15 | 10−5 | 6.42 | 10−5 |
| 0.003 | 3.37 | 10−3 | 3.51 | 10−3 |
| 0.004 | 4.14 | 10−2 | 4.32 | 10−2 |
| 0.005 | 2.45 | 10−1 | 2.55 | 10−1 |
| 0.006 | 9.42 | 10−1 | 9.82 | 10−1 |
| 0.007 | 2.75 | 100 | 2.87 | 100 |
| 0.008 | 6.65 | 100 | 6.93 | 100 |
| 0.009 | 1.401 | 101 | 1.46 | 101 |
| 0.01 | 2.64 | 101 | 2.76 | 101 |
| 0.011 | 4.61 | 101 | 4.80 | 101 |
| 0.012 | 7.53 | 101 | 7.85 | 101 |
| 0.013 | 1.17 | 102 | 1.22 | 102 |
| 0.014 | 1.73 | 102 | 1.80 | 102 |
| 0.015 | 2.47 | 102 | 2.58 | 102 |
| 0.016 | 3.42 | 102 | 3.57 | 102 |
| 0.018 | 6.08 | 102 | 6.34 | 102 |
| 0.02 | 9.95 | 102 | 1.04 | 103 |
| 0.025 | 2.65 | 103 | 2.77 | 103 |
| 0.03 | 5.57 | 103 | 5.82 | 103 |
| 0.04 | 1.62 | 104 | 1.70 | 104 |
| 0.05 | 3.44 | 104 | 3.61 | 104 |
| 0.06 | 6.08 | 104 | 6.37 | 104 |
| 0.07 | 9.52 | 104 | 9.98 | 104 |
| 0.08 | 1.38 | 105 | 1.44 | 105 |
| 0.09 | 1.88 | 105 | 1.97 | 105 |
| 0.1 | 2.44 | 105 | 2.56 | 105 |
| 0.11 | 3.08 | 105 | 3.23 | 105 |
| 0.12 | 3.77 | 105 | 3.96 | 105 |
| 0.13 | 4.52 | 105 | 4.75 | 105 |
| 0.14 | 5.32 | 105 | 5.59 | 105 |
| 0.15 | 6.17 | 105 | 6.48 | 105 |
| 0.16 | 7.06 | 105 | 7.42 | 105 |
| 0.18 | 8.96 | 105 | 9.42 | 105 |
| 0.20 | 1.10 | 106 | 1.16 | 106 |
| 0.25 | 1.65 | 106 | 1.74 | 106 |
| 0.30 | 2.26 | 106 | 2.38 | 106 |
| 0.35 | 2.89 | 106 | 3.06 | 106 |
| 0.40 | 3.56 | 106 | 3.77 | 106 |
| 0.45 | 4.23 | 106 | 4.49 | 106 |
| 0.50 | 4.92 | 106 | 5.23 | 106 |
| 0.60 | 6.31 | 106 | 6.74 | 106 |
| 0.70 | 7.71 | 106 | 8.26 | 106 |
| 0.80 | 9.11 | 106 | 9.79 | 106 |
| 0.90 | 1.05 | 107 | 1.13 | 107 |
| 1.00 | 1.18 | 107 | 1.28 | 107 |
Notes. Lower and upper limits can be computed using a rate uncertainty of 4.5%(5%) for 3H+p(3He+n).
Download table as: ASCIITypeset image
The rate uncertainty is 4.5% for the 3H+p channel (from the S(E) factor combination of the 18 and 17 MeV experiments using the standard error propagation on the average) and 5% for the 3He+n. Upper and lower limits are also shown in the figures, however they cannot be distinguished from the thick solid line. The region of astrophysical relevance for the SBBN goes from 0.1T9 to T9, whereas for the PMS, as well as for inertial fusion, we are interested essentially in the reaction rate corresponding to the lowest temperature shown in the figure, 0.001T9. We recommend an analytical expression for the reaction rates, exploiting the same formulas as reported in the REACLIB library (Thielemann et al. 1987). This expression is reliable in the whole range of temperatures reported in Table 1 within an accuracy better than 0.5%. The expression is
with parameters ai (1 ⩽ i ⩽ 7) as given in Table 2, resulting from a fit performed using the reaction rate parameterizer from NUCASTRODATA toolkit (CINA 2004).
Table 2. Coefficients of the Analytical Expression of the TH 2H(d,p)3H and 2H(d,n)3He Reaction Rates Using Equation (17)
| ai | 2H(d,p)3H | 2H(d,n)3He |
|---|---|---|
| a1 | 0.203545 × 10² | 0.207826 × 10² |
| a2 | −0.117603 × 10⁴ | −0.756630 × 10⁴ |
| a3 | −0.423548 × 101 | −0.419463 × 101 |
| a4 | −0.616115 | −0.119703 × 101 |
| a5 | 0.122056 × 101 | 0.149639 × 101 |
| a6 | −0.437620 | −0.522989 |
| a7 | −0.586747 | −0.489519 |
Download table as: ASCIITypeset image
The results are compared with the calculated reaction rates available in the literature, taken from Angulo et al. (1999), Cyburt (2004) for p+3H, R. H. Cyburt (2004, private communication) for n+3He (the 2H(d,n)3He reaction rate from Cyburt 2004 not consistent with his S(E) factor), and Descouvemont et al. (2004). The ratio of the THM reaction rate to those quoted above is reported in Figures 21(a), (b), and (c), and 22(a), (b), and (c) for 2H(d,p)3H and 2H(d,n)3H, respectively, with the colored solid lines referring to: blue line = rate ratio THM–NACRE (Angulo et al. 1999) (a); red line = rate ratio THM–(R. H. Cyburt 2004, and private communication) (b); green line = rate ratio THM–(Descouvemont et al. 2004) (c). Each colored region refers to the range of variation due to the experimental uncertainty in the THM reaction rates. The dashed black line in each figure represents the reference rate (Nacre in (a), R. H. Cyburt (2004, private communication) in (b), and Descouvemont et al. (2004) in (c)). In the lower temperature region (below 0.02T9), the reaction rate for the 2H(d,p)3H process can be up to 20% larger than the lowest estimate, given by (R. H. Cyburt 2004, and private communication), while in the higher energy region relevant for the SBBN, an increase by up to 10% is observed. By comparing the reaction rate of Descouvemont et al. (2004; Figure 21(c)), one can deduce that the temperature dependence is closer to the THM, with a maximum deviation of about 10% at the BBN temperatures. As for the 2H(d,n)3He reaction, a similar variation of up to 20% is shown in the lowest temperature region, while in the SBBN region an opposite behavior shows up, with a decrease in the reaction rate by more than 10%. None of the temperature slopes resemble the one from THM rate.
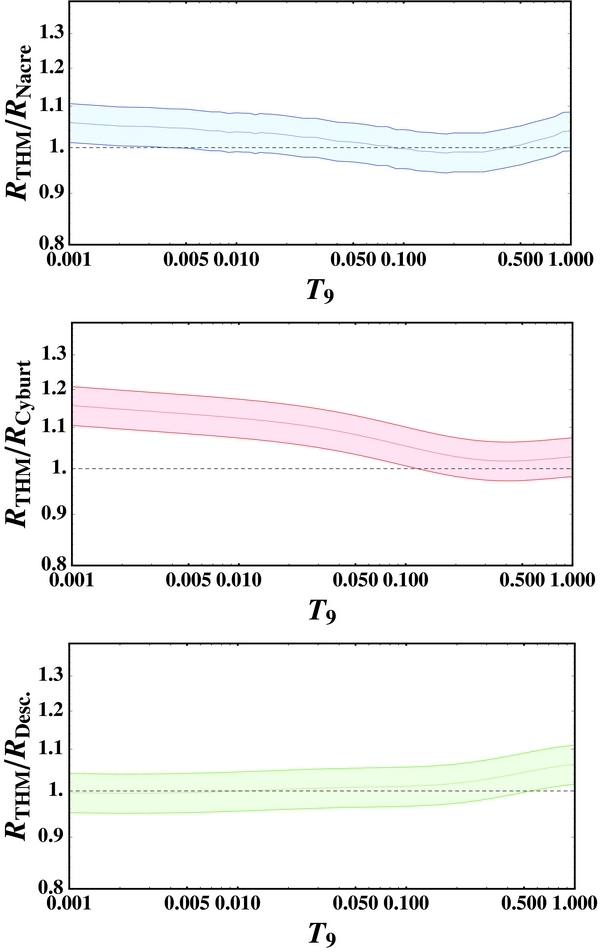
Figure 21. Rate ratios for the 2H(d,p)3H: blue line = THM−NACRE (Angulo et al. 1999) (a); red line = THM—(Cyburt 2004) (b); green line = THM—(Descouvemont et al. 2004) (c). Each colored region refers to the range of variation due to the experimental uncertainty in the THM reaction rates. The dashed black line in each figure represents the reference rate.
Download figure:
Standard image High-resolution image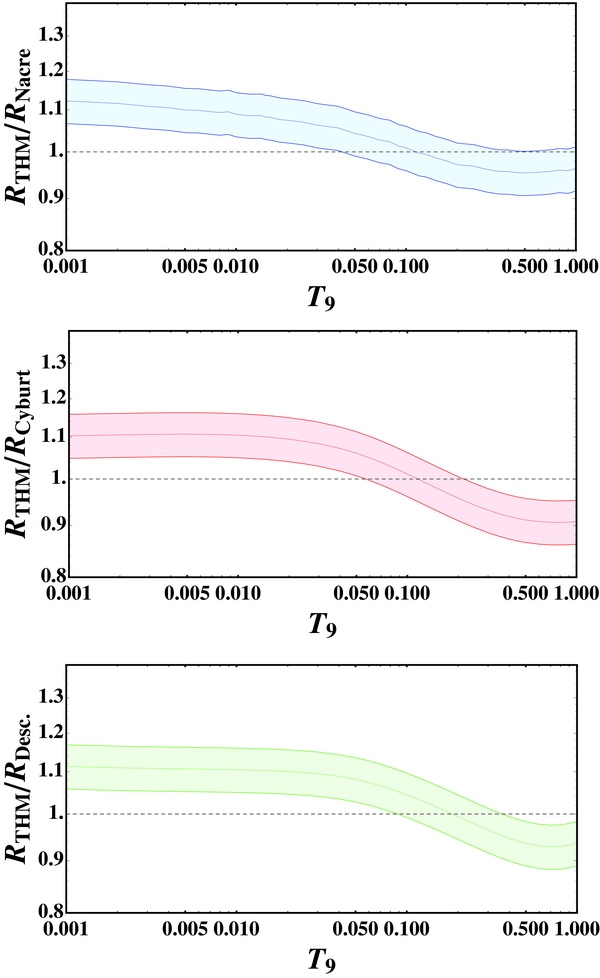
Figure 22. Rate ratios for the 2H(d,n)3He: blue line = THM-NACRE (Angulo et al. 1999) (a); red line = THM—(Cyburt 2004) (b); green line = THM—(Descouvemont et al. 2004) (c). Each colored region refers to the range of variation due to the experimental uncertainty in the THM reaction rates. The dashed black line in each figure represents the reference rate.
Download figure:
Standard image High-resolution imageThese deviations call for a new run of the BBN codes. This is also suggested by a recent sensitivity study by (Coc & Vangioni 2010), which puts the importance of the 2H(d,p)3He and 2H(d,n)3H reaction rates for the SBBN model on more solid ground. In this paper, the η value is fixed at the most recent Wilkinson Microwave Anisotropy Probe result, and used to calculate the sensitivity of a primordial abundance Y to a change of ±15% in reaction rates 〈σv〉, as given by: (∂log Y)/(∂log 〈σv〉). According to the quoted abundance sensitivities, a change in the reaction rates of both 2H(d,p)3He and 2H(d,n)3H processes may imply significant variations in the 2H and 7Li abundances. If we consider our lower and upper limits in the reaction rates from Figures 21 and 22, we can estimate the following ranges for the abundances reported in Table 3.
Table 3. Ranges of Variation in the 2H, 3He, and 7Li Abundances from Lower and Upper Limits of the TH 2H(d,p)3H and 2H(d,n)3He Reaction Rates
| 2H(d,p)3H | 2H(d,n)3He | |||
|---|---|---|---|---|
| Lower | Upper | Lower | Upper | |
| 2H | −6% | 2% | −2% | 4% |
| 3H | −0.8% | 1.7% | −3% | 1% |
| 7Li | −0.6% | −0.2% | −10% | 0.7% |
Download table as: ASCIITypeset image
From this work, the 2H(d,n)3He reaction is quite influential on 7Li and the present variation in the 7Li abundance is in favor for solving the unexplained discrepancy between the calculated and observed lithium primordial abundances. A consistent result is obtained using the abundance sensitivity formulas reported in Cyburt (2004). The present rate variations in the T9 relevant region for the SBBN imply an increase in deuterium abundance of about 2%, but a decrease of 10% in the lithium abundance. This moves the model toward solving the lithium depletion problem. However, more quantitative results for both 2H(d,p)3He and 2H(d,n)3H processes can be obtained from BBN codes once the new THM rates enter the full T9 range of interest.
Interesting results can also be derived from the strong rate variations in the region of T9 relevant for PMS and for plasma physics. Very little information was available, mainly due to the difficulty of providing experimental data at ultra-low Ecm energies from direct experiments, which are screened anyway. To determine the influence of these new rates on PMS evolution, they were included in an updated version of the FRANEC evolutionary code (Degl'Innocenti et al. 2008, Tognelli et al. 2011) and stellar models were computed exploiting five different stellar masses (0.1 M☉, 0.2 M☉, 0.4 M☉, 1 M☉, 2 M☉). Usually in stellar evolutionary codes only the most efficient deuterium burning channel 2H(p,γ)3He is included. Thus, THM rates for the other two deuterium burning d+d channels were included in the FRANEC stellar evolutionary code. As expected, the inclusion of the two additional destruction channels (2H(d,p)3H and 2H(d,n)3He) did not affect the global properties of a star (i.e., luminosity, radius, age, etc.). The analysis has been focused on the evolutionary parameter most affected by the change of the burning rate, (i.e., the deuterium abundance inside the stellar structure).
The deuterium "total" destruction rate in terms of the three relevant 2H(p,γ)3He, 2H(2H,p)3H, and 2H(2H,n)3He channels is given by
with np and nd the numerical hydrogen and deuterium densities, respectively, and F defined as
For the present calculations, the initial deuterium mass fraction abundance has been set to Xd = 2 × 10⁻⁵ ( ) as a representative value of the initial deuterium abundance present in population I stars (see, e.g., Geiss & Gloeckler 1998; Linsky et al. 2006; Steigman et al. 2007). However, as soon as deuterium is burnt inside a star, its abundance rapidly drops (Xd ≈ 10−18–10−17, see, e.g., Rolfs & Rodney 1988). The d-burning rate is different in each region of the star, due to the temperature stratification inside the stellar structure, however, for all the calculated models the burning occurs in a fully convective star, and, consequently, the deuterium abundance is kept homogeneous by the continuous mixing.
The left panel of Figure 23 shows the calculated time evolution of the central deuterium mass fraction abundance, Xd, (which is the same abundance inside the whole structure) normalized to the initial one, for stars of different masses. Results from model calculations with (solid lines) and without (dashed lines) the inclusion of the 2H(d,p)3H and 2H(d,n)3He channels are reported. For a better assessment, the relative difference between solid and dashed lines of the same color (for a given stellar mass) is shown in the right panel as a function of the star age (black dashed lines). Colored dashed lines in this panel connect models of different masses for the same relative time reduction of central deuterium (calculated for the case without the inclusion of the two d+d channels). It turns out that the difference between deuterium abundance with and without the inclusion of the two additional burning channels is usually below 10%, except for larger stellar masses and when deuterium is already nearly exhausted. However, such young evolutionary stages might be affected by other uncertainties, essentially depending on the initial abundances for the computations (see Baraffe et al. 2002). Recently Baraffe et al. (2009) and Hosokawa et al. (2011) have shown that the inclusion of an accretion phase at young ages strongly affects the stellar structure, particularly for what concerns the chemical evolution (see also Baraffe & Chabrier 2010). Indeed, as light elements (i.e., deuterium and lithium) are destroyed inside the star due to their relatively low nuclear burning temperature, the presence of a continuous accretion of matter (i.e., from an accretion disk), which supplies non-nuclear-processed material, partially compensates for the destruction of such elements. Here we do not discuss how accretion processes could modify the present results, because the accretion phase is extremely sensitive to several parameters, such as accretion rate, accretion history, and/or accretion energy, which at the moment are far from being well constrained (Baraffe et al. 2012).

Figure 23. Results from the FRANEC evolutionary code—the effect of inclusion of the 2H(d,p)3H and 2H(d,n)3He reactions on the central deuterium mass fraction abundance for PMS stars: (left panel) calculated time evolution of the central deuterium mass fraction abundance normalized to the initial one for stars of different masses (different colors) from model calculations with (solid lines) and without (dashed lines) the inclusion of the 2H(d,p)3H and 2H(d,n)3He channels. (Right panel) Depletion curves showing the relative difference between solid and dashed lines in the left panel as a function of the star age (black dashed lines). Colored dashed lines join points where models of different masses provide the same relative time reduction of central deuterium calculated without the inclusion of the two d+d channels.
Download figure:
Standard image High-resolution image
6. CONCLUSIONS
The 2H(d,p)3H and 2H(d,n)3He fusion reactions have been indirectly measured by means of the 2H(3He,p3H)1H and 2H(3He,n3He)1H TH processes off the proton in 3He. Two experiments were performed at 17 and 18 MeV. In the experiment at 17 MeV, the standard technique was applied, based on the coincidence detection between triton and proton involved in the binary process. The other experiment represents the first THM study where the charged spectator, here the proton, has been detected. This technique is very powerful when the spectator is in the projectile. The kinematics of the spectator was focused at forward angles, as it retains the same velocity of the projectile, spread out only by the Fermi motion shared with the other cluster inside the projectile. This makes it easier to cover the full QF phase space region expected for a given experiment. This pioneering technique is also pivotal to providing high-resolution, high-efficiency measurements of reactions with a neutron in the final channel.
The bare nucleus S(E) factors for the 2H(d,p)3H and 2H(d,n)3He fusion reactions have been measured for the first time by means of the THM in a wide Edd range, from 1.5 MeV down to 2 keV, with a maximum uncertainty of about 5% (4% statistical (9.5% for the 17 MeV run), 1% from normalization (2.3% for the 17 MeV run), and 3% from theory). These results represent convincing evidence of the validity of the THM. They indicate that the plane wave factorization in the QF kinematics regime can be used to obtain the energy dependence of the 2H(d,p)3H and 2H(d,n)3He cross sections. The new experimental data for both channels, which are available over a wide energy range, allows for an accurate calculation of the reaction rate. Both the deduced 2H(d,p)3H and 2H(d,n)3He reaction rates experience relevant changes. At the SBBN temperature, the rate for the 3H+p (3He+n) channel increases (decreases) by up to 15% with respect to previous studies (Angulo et al. 1999; Cyburt 2004; Descouvemont et al. 2004), while at the temperatures relevant for PMS and future fusion power plants, it undergoes a stronger increase by up to 20% for both channels. Applying the sensitivity studies reported in Cyburt (2004) and Coc & Vangioni (2010), the rate variations at the SBBN temperatures lead to a decrease in the production of lithium by up to 10%. These deviations call for a new run of BBN and stellar evolutionary codes.
Moreover, the influence of the two d+d burning channels (calculated with the presented THM reaction rates) on the deuterium abundance in PMS stars was investigated for different stellar masses using an updated version of the FRANEC evolutionary code. No relevant differences on the stellar properties have been found among models with and without the two additional burning channels, but a maximum variation of about 10%–15% of the deuterium abundance inside the star, limited to the early stages of PMS evolution.
The d+d system is considered as fundamental to investigate the fusion dynamics in plasmas for energy production. Theoretical works suffer because of the lack of d+d unscreened low-energy data, necessary to test the consistency of available models in determining the electron screening. The present results on the bare nucleus S(E) factors for both fusion channels will push the investigation of fusion dynamics in this field. They will help understand whether current models for determining the screening in plasmas are suitable, and how fluctuations due to the chaotic nature of the electron motion, already believed to affect the screening potential in low-energy nuclear reactions (Kimura & Bonasera 2004), may enhance the fusion probability.
This work was supported in part by the Italian Ministry of the University under grant (RBFR082838). A.M. acknowledges the support of the US Department of Energy under grant DE-FG02-93ER40773 and DE-FG52-06NA26207, of the NSF under grant PHY-0852653, S.T. was supported by the Helmholtz Association (HGF) through the Nuclear Astrophysics Virtual Institute (VH-VI-417) and by the DFG cluster of excellence "Origin and Structure of the Universe." V.B., V.K., Z.H., J.M. and S.P. acknowledge the support of the Czech MSMT under grant LC 07050, of the Czech Academy under grant M10480902, and of the GACR under grant P203/10/310.