


ABSTRACT
We present a new approach for estimating the 3.6 μm stellar mass-to-light (M/L) ratio ϒ3.6 in terms of the [3.6]–[4.5] colors of old stellar populations. Our approach avoids several of the largest sources of uncertainty in existing techniques using population synthesis models. By focusing on mid-IR wavelengths, we gain a virtually dust extinction-free tracer of the old stars, avoiding the need to adopt a dust model to correctly interpret optical or optical/near-IR colors normally leveraged to assign the mass-to-light ratio ϒ. By calibrating a new relation between near-IR and mid-IR colors of giant stars observed in GLIMPSE we also avoid the discrepancies in model predictions for the [3.6]–[4.5] colors of old stellar populations due to uncertainties in the molecular line opacities assumed in template spectra. We find that the [3.6]–[4.5] color, which is driven primarily by metallicity, provides a tight constraint on ϒ3.6, which varies intrinsically less than at optical wavelengths. The uncertainty on ϒ3.6 of ∼0.07 dex due to unconstrained age variations marks a significant improvement on existing techniques for estimating the stellar M/L with shorter wavelength data. A single ϒ3.6 = 0.6 (assuming a Chabrier initial mass function (IMF)), independent of [3.6]–[4.5] color, is also feasible because it can be applied simultaneously to old, metal-rich and young, metal-poor populations, and still with comparable (or better) accuracy (∼0.1 dex) than alternatives. We expect our ϒ3.6 to be optimal for mapping the stellar mass distributions in S4G galaxies, for which we have developed an independent component analysis technique to first isolate the old stellar light at 3.6 μm from nonstellar emission (e.g., hot dust and the 3.3 polycyclic aromatic hydrocarbon feature). Our estimate can also be used to determine the fractional contribution of nonstellar emission to global (rest-frame) 3.6 μm fluxes, e.g., in WISE imaging, and establishes a reliable basis for exploring variations in the stellar IMF.
Export citation and abstract BibTeX RIS
1. INTRODUCTION
Accurate maps of the stellar mass distribution in nearby galaxies are essential for charting the dynamical influence of stellar structures over time. They provide a key perspective on the evolution in the amount and distribution of baryons from high redshift to the local universe, both as the result of internal, secular processes (e.g., Elmegreen et al. 2007; Zhang & Buta 2007; Haan et al. 2009; Foyle et al. 2010), and given "bottom-up" assembly and external (heirarchical accretion) events within the context of cold dark matter cosmology (e.g., Balcells et al. 2003; Courteau et al. 1996; Florido et al. 2001; and see Navarro & White 1994; Somerville 2002; Governato et al. 2007; Guo & White 2008).
Near-IR (NIR) bands are often thought to be optimal windows on the old stars that dominate the baryonic mass in galaxies, with images at these wavelengths serving as good relative proxies for stellar mass (Elmegreen & Elmegreen 1984; Rix & Zaritsky 1995; Grosbol 1993). Yet even in these bands the light is affected by the presence of dust extinction and young stars (albeit less than in the optical), requiring the application of a mass-to-light ratio (M/L) that incorporates dependencies on metallicity, star formation history (SFH), and especially the age of the stellar population (Rix & Rieke 1993; Rhoads 1998). Such estimates have emerged only relatively recently, following the demonstrated correlation between optical colors and the mass-to-light ratio in stellar population synthesis (SPS) models (Bell & de Jong 2001). The state-of-the-art, which uses more than one color and incorporates a model of the dust, is optimal for use in two dimensions and has greatly reduced uncertainties (Zibetti et al. 2009), but at present few such maps exist.
We have begun an effort to map the stellar mass distribution in nearby galaxies in the Spitzer Survey of Stellar Structure in Nearby Galaxies (S4G), an unparalleled inventory of stellar mass and structure in ∼2300 nearby galaxies (D < 40 Mpc; Sheth et al. 2010). The survey consists of deep imaging at 3.6 μm and 4.5 μm where the light traces the old stars and where the effects of dust extinction and star formation activity (e.g., young stars, Hii regions; see Sheth et al. 2010, and references therein) are at a minimum compared to ground-based images in either optical or NIR wave bands.
Our method begins by using independent component analysis (ICA) to isolate the old stellar light (from K and M giants) from the "contaminating" emission from several other sources: the 3.3 μm polycyclic aromatic hydrocarbon (PAH) emission feature in channel 1, accessory nonstellar continuum emission (i.e., from hot dust and PAH), and lower-M/L asymptotic giant branch (AGB) and red supergiant (RSG) stars. These three main contaminants can lead to an overestimation of stellar mass when using uncorrected 3.6 μm and/or 4.5 μm images (Meidt et al. 2012a; hereafter Paper I). Corrections for this "contaminating" emission are especially critical for mass estimates because this emission is not incorporated into spectral energy distribution (SED) libraries at the core of now-standard techniques for estimating the stellar M/L (e.g., Bell & de Jong 2001; Zibetti et al. 2009).
Once contaminants are removed with ICA we obtain maps of the underlying distribution of old stellar light in S4G images, with [3.6]–[4.5] colors that are consistent with those of M and K giants (Pahre et al. 2004; Hunter et al. 2006). To generate two-dimensional (2D) maps of the stellar mass distribution in principle thus requires applying an M/L that is appropriate for an old, dust-free population of stars.
Tight constraints on the stellar M/L at 3.6 μm are possible using SPS models to link, e.g., optical or NIR colors to metallicity and age (or SFH) variations in the underlying stellar population. Paired with this information, contaminant-corrected S4G images should be readily convertible into high-quality mass maps. But even in the latest generation of models there are lingering uncertainties: (1) convergence on the TP-AGB phase of stellar evolution that dominates NIR light at ∼1 Gyr has yet to be reached among different models (Bruzual 2007; Maraston 2005; Mouhcine & Lançon 2002), (2) differences in the molecular line opacities assumed in template spectra lead to a variety of model predictions at mid-IR wavelengths (e.g., Peletier et al. 2012), and (3) realistic models of dust extinction (as well as the reflection and scattering of stellar light by dust) are difficult to implement at the pixel-by-pixel level, given the variety of dust geometries (Zibetti et al. 2009).
In this paper we explore estimating the M/L at 3.6 μm in a way that is least susceptible to the uncertainties that plague state-of-the-art mass estimation techniques. The key is our focus on mid-IR wavelengths where the emission is dominated by the oldest stars and dust extinction is minimal.
In Section 2 we describe our ICA technique to isolate the old stellar light from nonstellar emission at 3.6 μm. Then in Section 3.1 we demonstrate that the variation in stellar ϒ3.6 is intrinsically quite low and, in this case, we argue that the IRAC [3.6]–[4.5] colors of the old stars provide sufficient constraint on the M/L (Section 3.2). To demonstrate this we use SPS models, setting out first to improve their predictive power at mid-IR wavelengths. Using a new calibration of the relation between the NIR and mid-IR colors of GLIMPSE giants (the Appendix), we link SPS models to realistic [3.6]–[4.5] colors in Section 4.1. This allows us to explore the dependence of age/SFH (including bursts) and metallicity on the relation between ϒ3.6 and [3.6]–[4.5] color, which we present in Section 4.3.
Our approach for constructing 2D mass maps, namely, using information exclusively from 3.6 and 4.5 μm images revealed by ICA, is an approach that can be applied to the greatest number of galaxies in the S4G sample without relying on ancillary optical or NIR data.
2. ICA CORRECTION OF S4G IMAGES
Mass maps for much of the S4G sample will necessarily rely on information from the two lowest IRAC wave bands, the only bands available during the Spitzer warm mission. Given this constraint, we choose to remove contaminants from these images using an ICA technique that requires only the information available in these two bands and solves for both the fluxes of, and the scaling between (i.e., color), each of two independent sources.
2.1. Applying ICA
As described in Paper I, we assume that emission in each pixel mapped at each of two frequencies νi is a linear combination of the emission from N = 2 different sources (stellar and nonstellar) such that, for P samples (i.e., image pixels) in M = 2 frequency channels,

where x is the M × P measurement set, A is an M × N mixing matrix containing the coefficients of the combination, and the N × P matrix s represents the source signals, under the assumption that the sources S are separable functions of location and frequency (i.e., sj = Sj(x, y) and Ai, j∝Sj(ν)).
Given our two input channel 1 and 2 images xi, we can apply ICA to extract measurements of at most two signals sj (each representing either contaminants or emission from the true old stellar disk) in each of P pixels while simultaneously solving for the separation coefficients  .
.
Like principal component analysis, ICA extracts solutions via transformation of the input data, but the sources are statistically independent rather than orthogonal (with zero covariance). This grants greater uniqueness to ICA solutions, promising improved descriptions of sources that are the result of distinct physical processes.
Perhaps the strongest advantage of ICA is that it allows us to retain and exploit information about the different spectral shapes of the stars and dust between 3.6 and 4.5 μm, rather than requiring that a priori assumptions about the properties of either the stars or the contaminating emission (e.g., imposing a particular set of separation coefficients  given some empirical recipe). This is a particularly favorable alternative to (1) subtracting scaled versions of the 8 μm image (which requires prior knowledge of the relation between the 3.3 μm PAH emission feature and the 8 μm and how, in particular, this varies depending on the size and ionization state of the dust) or (2) a simple scaling and subtraction of the 3.6 and 4.5 μm images. Given the difference in SED shapes for the old stars and dust, there is not a single scaling between the emission at 3.6 μm and at 4.5 μm that can be applied uniformly to all galaxies throughout the Hubble sequence. Combining the two images would furthermore require the loss of the [3.6]–[4.5] color, a key diagnostic of the properties of the old stellar population. By avoiding such measures, we gain a unique tracer of the nonstellar emission (and the thermal and nonthermal sources of dust heating; paper I) as well as a measure of the color of the old stars, which we leverage in this paper to assign the M/L3.6.
In addition, ICA in principle allows much more information in individual structural components, like spiral arms, to be maintained in contaminant-cleaned maps than is supplied by other commonly employed mass estimation methods. Alternative schemes for the identification or correction of these features in IRAC images (Kendall et al. 2008; Hunter et al. 2006; Bolatto et al. 2007; de Blok et al. 2008) either require the loss of 2D information or employ auxiliary data (e.g., 8 μm, UV, optical images) that is not uniformly available for the full S4G sample. The ICA uses only the information from the first two IRAC bands and thus provides a correction for nonstellar emission that can be made uniformly throughout the sample.
2.2. Sources Identified with ICA
As outlined in Paper I (and described in detail by M. Querejeta et al., in preparation), our application of ICA with additional postprocessing yields two maps: a corrected map of the old stellar light (a clean, smoothed version of the uncorrected image) and a map of significant contaminating nonstellar emission (containing most, if not all, of the bright and knotty features tracing, e.g., star formation in spiral arms).
2.2.1. Nonstellar Emission
By comparing with the IRAC 8 μm image, which is dominated by PAH emission, in Paper I we demonstrated that the main sources of contamination expected in 3.6 μm images are well-detected with ICA. These contaminants are defined as all sources of emission apart from the oldest stars: PAH, hot dust, and intermediate-age RSG and AGB stars. Whereas old stars typically exhibit blue colors in the range −0.15 < [3.6]–[4.5] < −0.02, the emission from nonstellar sources are characterized by colors [3.6]–[4.5] ∼ 0.3 and redder (Meidt et al. 2012; M. Querejeta et al., in preparation).
The fractional contribution of nonstellar emission to the integrated 3.6 μm flux of galaxies in S4G can be significant, as high as 30% (Meidt et al. 2012; M. Querejeta et al., in preparation). This emission covers roughly one-third of the disk area, although the degree of spatial contamination depends on the type of galaxy and the nature of the nonstellar emission. Dust emission tracing star formation in low-mass, late-type disks with flocculent spirals, for example, tends to be more diffuse and uniformly distributed. In contrast, the star formation at the source of dust heating in more massive disks with coherent spiral arms tends to be strongly locally organized and thus typically arises from a smaller fraction of the disk area (M. Querejeta et al., in preparation).
2.2.2. Old Stellar Light Maps
By removing nonstellar emission in S4G images with ICA we uncover information related to the old stellar population that was not initially accessible with only the 3.6 and 4.5 μm bands, i.e., as a result of nonstellar contamination. Within contaminated regions (∼30% of the disk area) we obtain new flux and color information for the underlying old stars. In all other initially contaminant-free locations (typically 70% of the disk) the native flux and color information tracing the properties of the stellar population are retained. Only in cases with pervasive nonstellar emission, in which a single [3.6]–[4.5] is assigned to a larger fraction of the disk, do we lose full 2D color information to constrain the properties of the stellar population. As will be discussed in section, however, this is not especially adverse for stellar mass estimation: changes in the stellar M/L due to stellar age and metallicity variations are minimal, and a single (color-independent) M/L may even be preferred.
Removing nonstellar emission with ICA introduces only at most 15% uncertainty (M. Querejeta et al., in preparation), which improves on the uncertainty that would be associated with the presence of that emission (roughly 30%). Images of the underlying old stellar light at 3.6 μm better match expectations for an old, dust-free stellar population than those from which the contaminant emission has not been removed (Paper I). In this case, to convert from light to mass, we only have to apply a stellar M/L, rather than one that accounts for the presence of dust emission tracing young stars or recent star formation. In the upcoming sections, we outline our approach to determining the optimal conversion between the light at 3.6 μm and stellar mass.
3. GENERAL TRENDS IN THE STELLAR MASS-TO-LIGHT RATIO AT 3.6 μm
3.1. Comments on the Sources of Variation
As in other NIR bands, the light at 3.6 μm is dominated by the old stars that populate the red giant branch (RGB). This furnishes the powerful advantage that the stellar M/L, which must reflect the mix of these giants stars with the underlying mass-dominant dwarf stars, varies much less with age/SFH and metallicity than at optical wavelengths (Bell & de Jong 2001).
Consider that, in a simple stellar population, as stars evolve off the main sequence (and the number of stars left on the main sequence decreases) the RGB is populated by later and later spectral types with decreasing M/L. The M/L of the stars remaining on the main sequence meanwhile increases, weighted more toward the higher M/L of the late M spectral class. At the same time, the fraction of giants to dwarfs increases because the average time spent on the RGB is longer than their average main-sequence lifetime. These factors keep the NIR M/L for the oldest stars free of the relatively high degree of variation characteristic of optical wavelengths as the population evolves. Together with the reduced sensitivity to dust extinction, this is the primary reason these bands are favored as direct stellar mass tracers.
The photometric properties of stellar populations, which progressively redden as the RGB becomes dominant,20 encode this difference in stellar M/L with wavelength. By construction, the mass-to-light ratio at 3.6 μm is
where, at any wavelength λ, ϒλ is the mass-to-light ratio, mλ is apparent magnitude, and  is the absolute magnitude of the sun. The prominence of the RGB that leads to red optical–NIR colors ensures a smaller ϒ3.6 than in the optical. For old stellar populations (redder than the Sun), the variation in ϒ3.6 compared to ϒλ will also tend to be smaller because
where variation in parameter β (representing, e.g., age or metallicity) is responsible for the change in the properties of the population, both color and M/L. Even progressing from the H band to 3.6 μm, the variation in the stellar M/L is intrinsically reduced; assuming a color H−[3.6] = 0.4 typical of an old, dust-free population, Δϒ3.6 will be at most 0.75ΔϒH.
In the next section, we explore the variation in M/L in more detail using population synthesis models to follow the evolution in the fraction of giant to dwarf stars, for a given (Chabrier) initial mass function (IMF), as well as the dependence of their combined properties on metallicity and SFH. We compare ϒ3.6 with ϒB to underscore the contrast between tracing the RGB and tracing young, main-sequence stars at optical wavelengths, although a more symbolic comparison may be with the I-band M/L. The I band is preferred to the shorter wavelength B band for tracing the stellar mass for the same reasons we prefer 3.6 μm imaging of old stars (Bell & de Jong 2001) (reduced sensitivity to young stars and dust extinction). It has even been argued that the I band is favorable to NIR (and 3.6 μm) bands for estimating stellar mass, given the uncertain contribution from stars in the late (i.e., AGB) stages of stellar evolution (Rix & Rieke 1993; Rhoads 1998; Portinari et al. 2004; along with the contribution from nonstellar emission at 3.6 μm). Here we emphasize that, for old stellar populations, we can expect Δϒ3.6 ∼ 0.3ΔϒI, given their typical colors I-[3.6] = 2.2 (I − H = 1.8).
3.2. Constraining Variations with Color Information
Population synthesis models provide a clean way to explore the dependencies of the observed properties of a stellar population on age/SFH and metallicity and relate these to the stellar M/L. Figure 1 shows the stellar M/L in the optical (ϒB) and at 3.6 μm (ϒ3.6) as a function of two different colors for a set of dust-free synthesized stellar populations assuming a Chabrier IMF. Each population is constructed with an exponentially declining SFH with e-folding time τ from GALAXEV models (Bruzual & Charlot 2003; hereafter BC03) and observed after 13 Gyr or when the population has a mean age A = 13 Gyr–τ.

Figure 1. Trends in stellar M/L ratios (in solar units M☉/L☉) with optical and optical–NIR color for simple exponential SFH models of age 13 Gyr from BC03. The blue lines (top grid) show B-band ϒB, and the red lines (bottom grid) show 3.6 μm ϒ3.6. Models of the same e-folding timescale τ are connected by dashed lines, and models of the same metallicity Z are connected by solid lines. Short (long) τ correspond to older (younger) ages. The black arrows in the top and bottom of the left panel correspond to V-band extinction AV = 0.3, assuming a Galactic extinction law (Cardelli et al. 1989; Indebetouw et al. 2005).
Download figure:
Standard image High-resolution imageNote first that ϒ3.6 is characterized by much less variation (a factor of nine less) than ϒB over this range of ages and metallicities (see also de Denus-Baillargeon et al. 2013). Second, ϒ3.6 and ϒB show opposite dependencies on metallicity (clearer in the right panel). The young stars that dominate in the optical are bluer and brighter at lower metallicities (due to a combination of reduced line blanketing and opacity), reducing ϒB compared to higher metallicities. The metallicity dependence of ϒ3.6 is reversed because the RGB traced in the NIR is brighter and redder at higher metallicities.
These variations in metallicity are well tracked by the optical–NIR color, which exhibits a weaker dependence on age than the B–R color. In the left panel, we see that age and Z contribute more equally to the B–R color and introduce comparable variation in ϒ3.6, while their individual influences on ϒB are degenerate (Bell & de Jong 2001). The R–H color breaks this degeneracy, revealing similar degrees of variation in ϒB due to age and metallicity over the ranges in these parameters considered here. The nearly orthogonal dependencies of ϒ3.6 on age and metallicity are likewise responsible for similar degrees of variation in ϒ3.6. But, again, these are about one-tenth as large as in the B band.
These well-known dependencies of optical and optical/NIR colors on population age and metallicity offer the opportunity to estimate the stellar M/L: the B–R color provides a good constraint on ϒB (Bell & de Jong 2001), whereas the combination of R-H and B–R provide the potential to estimate ϒ3.6 (by constraining the metallicity and the age, respectively; as used by Zibetti et al. 2009). But such determinations are at risk of the uncertainties introduced by dust (explored below), to which colors tied to optical bands, in particular, are sensitive.
3.3. Impact of Dust
The task of assigning M/L requires finding and using a color (or colors) to optimally trace these age and metallicity variations. Unfortunately, this task is complicated by the presence of dust, which can reduce the diagnostic power of colors tied to optical bands in disk galaxies, in particular (Bell & de Jong 2001; MacArthur et al. 2004; Z09).
The impact of dust at optical wavelengths is demonstrated in Figure 1 by the extinction vector AV = 0.3 at the top left, assuming a Galactic extinction law (Cardelli et al. 1989; Indebetouw et al. 2005). Dust both reddens and dims (optical) light, increasing B–R and ϒB. But because the dust vector is not exactly parallel to the locus of dust-free stellar population models, the broken age/metallicity–dust degeneracy leads to underestimated masses for young, dust-reddened populations relative to old, dust-free populations. As a result of dust, typical uncertainties on total masses are 0.1–0.2 dex using global colors to assign the stellar M/L (Bell & de Jong 2001), although colors are expected to remain reliable in one dimensions for all but the most massive (and therefore dustiest; e.g., Dalcanton & Bernstein 2002) disks (MacArthur et al. 2004). Because our main concern is not only the total mass but also the 2D mass distribution within the disk, dust extinction can pose a real problem. This is especially true because we are interested in mapping the stellar mass in dusty, star-forming disks with a wide range of masses. In star-forming disk galaxies AV can locally be as high as 1–3 mag (e.g., Prescott et al. 2007; Kreckel et al. 2013; Ganda et al. 2009) and even higher in edge-on disks (Jansen et al. 1994; Ganda et al. 2009). For a Galactic dust extinction law, even AV = 1 mag introduces a color excess of 1.5 mag in B–R color, exceeding by far the total amount of variation exhibited by stellar populations with ages between 1 and 12 Gyr.
Although we can expect optical colors to retain their usefulness, e.g., in early-type E/S0 galaxies characterized by lower dust content, for dusty, star-forming galaxies (the bulk of the S4G sample) the use of optical colors clearly requires incorporating a realistic model of the dust (MacArthur et al. 2004; Zibetti et al. 2009). So far, the effect of dust on UV-to-optical emission from late-type spiral disks has been well modeled assuming a mix of foreground screen and birth-cloud extinction (e.g., Popescu et al. 2011; da Cunha et al. 2008). Given the variety of dust geometries, which likely vary from position to position in the disk, models can be difficult to implement realistically in two dimensions without knowledge of the actual dust content and properties measured from far-IR data sampling the dust SED. The first implementation of a dust model for the purposes of estimating the stellar M/L by Zibetti et al. (2009) may not be optimal as recent work suggests that stellar reddening is a poor tracer of the overall dust distribution (Kreckel et al. 2013).
4. CONSTRAINING ϒ3.6 WITH [3.6]–[4.5] COLORS
In what follows we describe an approach to estimating ϒ3.6 that attempts to avoid the effects of dust altogether, taking advantage of the reduced sensitivity of the NIR window to dust extinction. We explore how well the [3.6]–[4.5] color, in particular, can constrain ϒ3.6 and how this can be applied to the bulk of S4G galaxies.
Throughout, we assume that 3.6 μm luminosities predicted by the models are accurate, at least over the ages (>1 Gyr) under consideration. Unlike the 4.5 μm band that contains a CO absorption feature which is either omitted (BC03) or for which the modeled metallicity dependence is questionable (typically scaled solar), there is no significant photospheric molecular absorption in the 3.6 μm band. So although the modeled 4.5 μm luminosities, and thus [3.6]–[4.5] colors, are compromised, the 3.6 μm luminosity should remain accurate for the ages under consideration. Only at the onset of the AGB phase (ages ≲1 Gyr) are modeled 3.6 μm luminosities potentially unrealistic.
To convert from 3.6 μm luminosity to magnitude we use the IRAC channel 1 zero-point calibration provided by Reach et al. (2005) (280.9 Jy; for channel 2 the zero-point is 179.7 Jy). We adopt the 3.6 μm and 4.5 μm absolute solar magnitudes calculated by Oh et al. (2008),  = 3.24 and
  = 3.27. All mass-to-light ratios are presented in solar units M☉/L☉ and all magnitudes and colors are in the Vega magnitude system.
4.1. Trends with [3.6]–[4.5] Color
In this section, we explore the specific age, SFH, and metallicity dependencies of the [3.6]–[4.5] colors of old stellar populations. The colors of RGB stars may not provide the leverage on age/SFH that the (optical) colors of main-sequence stars can. Even so, between 3.6 and 4.5 μm these colors are less susceptible to the systematic uncertainties plaguing optical colors (e.g., dust extinction/reddening) otherwise used to constrain the M/L. Plus, any variations in M/L due to age will be intrinsically much less than at shorter wavelengths. In this case, the [3.6]–[4.5] colors of old stars may alone provide suitable constraints on the M/L.
Unfortunately, SPS models are so far not well trusted at IRAC wavelengths, where molecular line opacities and the TP-AGB phase of evolution remain weakly constrained in template spectra. Peletier et al. (2012) show the degree to which predictions vary from model to model. We note that the modeled [3.6]–[4.5] colors do not match the observed global colors of galaxies, either E/S0 (Peletier et al. 2012) or later-type (Pahre et al. 2004), which do not exceed [3.6]–[4.5] = 0 and strictly fall in the range −0.15 < [3.5]–[4.5] <−0.02. Models that do not properly include CO absorption in the 4.5 μm wavelength range tend to predict redder [3.6]–[4.5] colors (BC03 and CB07; see 6) or a weaker dependence on metallicity (Marigo et al. 2008; Maraston 2005) than observed.21 Even at ages long after the AGB phase, the models have very little predictive power at mid-IR wavelengths. To avoid this issue, in the Appendix we calibrate a relation between the NIR and [3.6]–[4.5] colors of GLIMPSE giants in order to relate the NIR colors of SPS modelswhich successfully reproduce the colors of real galaxiesto realistic [3.6]–[4.5] colors. These better match expectations (based on observation) for the mid-IR colors of old stellar populations.
Figure 2 shows the same BC03 tracks of metallicity and age as shown in the previous section, but now using the relation defined in the Appendix. Notably, the trend in ϒ3.6 with [3.6]–[4.5] is the reverse of the trend with R–H color in Figure 1; due to CO absorption in the stellar photospheres of giant stars in the 4.5 μm band, the [3.6]–[4.5] color is bluer at higher metallicity. In addition, only the influence of metallicity can account for the full range in [3.6]–[4.5] colors observed in real galaxies (as measured, e.g., by Pahre et al. 2004). Peletier et al. (2012) find this same dependence of [3.6]–[4.5] on metallicity in early-type galaxies, linking the relation between [3.6]–[4.5] and galaxy velocity dispersions in the SAURON sample to a mass–metallicity relation, and also linking [3.6]–[4.5] directly to absorption lines like Mgb and Fe. With our GLIMPSE-based calibration to relate [3.6]–[4.5] color to M/L it is now clear that metallicity is in fact the primary driver of [3.6]–[4.5], the age dependence of [3.6]–[4.5] being weak. Indeed, age variation introduces a limited span of only ∼0.002 mag in [3.6]–[4.5] color from τ = 2–12 Gyr at fixed metallicity (see Figure 2). Variation in metallicity across the range 0.0004 < Z/Z☉ < 0.05, on the other hand, can account for colors spanning −0.08 ≲ [3.6]–[4.5] < −0.02.
Figure 2. ϒ3.6-([3.6]–[4.5]) relation for a sequence of exponentially declining star formation rate models from Figure 1, using the calibration between J − H and [3.6]–[4.5] in the Appendix to link the BC03 models to [3.6]–[4.5] color. Models of the same e-folding timescale τ are connected by dashed lines, while models of the same metallicity Z are connected by solid lines. The black arrow in the bottom right corresponds to V-band extinction AV = 1, assuming a Galactic extinction law (Cardelli et al. 1989; Indebetouw et al. 2005).
Download figure:
Standard image High-resolution imageOver the full range of [3.6]–[4.5] probed here, metallicity introduces a change in M/L by 0.2 dex. At fixed metallicity, age variations are responsible for a similar degree of variation, but the corresponding change in [3.6]–[4.5] color of only 0.002 mag is below the typical photometric accuracy of these bands (Reach et al. 2005). As is the case for NIR colors to which our IRAC color is tied, age variations are not well probed. Still, as discussed in Section 3.1, age variations themselves do not lead to greatly varying ϒ3.6. In fact, Figure 2 suggests that these are at most ±0.1 dex at fixed metallicity. Considering the range of ages and metallicities exhibited by the galaxies studied by MacArthur et al. (2004), the oldest age (lowest τ) considered here may even be unrealistic. More realistic SFHs, characterized by at least one additional burst of star formation during the decline of initial star formation, correspond to younger mean ages and, as demonstrated in the next section, tend to tighten the spread in ϒ3.6 at fixed metallicity.
4.2. The Influence of (Bursty) SFHs
Here we explore the impact of bursts on ϒ3.6. For each of the solar metallicity (Z = 0.02) exponentially declining SFHs we add one burst of star formation with 0.5 Gyr duration. Each burst contributes 10% to the total stellar mass formed over the lifetime of the population and is chosen to occur between 1 and 6 Gyr from the present "observation" epoch. Following MacArthur et al. (2004), we assume that more recent and more massive bursts are not likely in our sample, according to the Kauffmann et al. (2003) study of burst fraction in the Sloan Digital Sky Survey (SDSS). Note that this simple model does not account for bursts that produce stars with metallicities other than the metallicity characteristic at earlier times.
As can be seen in Figure 3, the [3.6]–[4.5] color is less sensitive to bursty SFHs than the B–R color, as expected (i.e., the [3.6]–[4.5] color itself is not very sensitive to age; see the previous section). However, older bursts introduce a slightly larger fractional change to the [3.6]–[4.5] color than to the B–R color. This change in [3.6]–[4.5] stays in roughly fixed proportion to the change in ϒ3.6 for bursts of all ages. As a result, the fixed metallicity age track in the right panel remains robust; with the addition of bursts the population slides down the right-hand-side age track, while on the left the age track itself is changed.

Figure 3. Mass-to-light ratio ϒ3.6 (in solar units M☉/L☉) as a function of B-R and [3.6]–[4.5] color for a sequence of exponentially declining star formation rate models at solar metallicity (Z =0.02) with 10% mass fraction added in 0.5 Gyr duration starbursts. The solid red line connects the exponential SFH models with different e -folding timescales τ from Figure 2. The dashed lines connect models of the same τ with starbursts occurring 1, 2, 3, 4, or 6 Gyr ago. The SFH with the youngest mean age (latest burst) is shown in blue for each underlying decaying exponential.
Download figure:
Standard image High-resolution imageIn either the left or right panels of Figure 3, it is clear that later bursts have the largest impact on color and ϒ3.6, and this increases for shorter τ. Imposing a burst of star formation on an exponentially declining SFH primarily reduces the mean age of the stellar population (MacArthur et al. 2004) and thereby also effectively reduces the spread in ϒ3.6 compared to the no-burst SFHs. Note that the [3.6]–[4.5] color for populations with the youngest age (corresponding to a burst 1 Gyr ago) is the most likely to be inaccurate because it does not account for AGB stars (only giant stars). At ∼1 Gyr, the contribution from AGB stars in the NIR is predicted to reach its peak of ∼30% or as high as ∼70%, depending on the model (see BC03 and Maraston 2005). The trends in Figure 3 described above remain secure for all other SFHs.
4.3. The Relation between ϒ3.6 and [3.6]–[4.5] Color
Given that bursty SFHs reduce the mean population age and hence tighten the spread in ϒ3.6, metallicity is arguably the source of largest variation in ϒ3.6. This is especially clear if we focus only on populations with ages younger than ∼10 Gyr (τ = 4–12 Gyr) in Figure 2, even discounting the lowest metallicity models. Such a reduced range of ages and metallicities would be representative of the large majority of nearby S0–Irr galaxies studied by MacArthur et al. (2004).
Because the [3.6]–[4.5] color is itself primarily driven by metallicity, it serves as a natural constraint on ϒ3.6. In Figure 4 we show our parameterization of the relation between ϒ3.6 and [3.6]–[4.5]. Assuming that all regions of the parameter space in Figure 2 are equally likely, we bin our set of models by metallicity, letting the spread in ϒ3.6 and [3.6]–[4.5] due to age set the dispersion around the mean. On average, unconstrained age variations introduce an rms uncertainty of 0.06 dex on ϒ3.6, shown as the vertical error bar at fixed metallicity in Figure 4. The horizontal error bar reflects age-induced variation in [3.6]–[4.5] color at fixed metallicity (∼0.002 mag) together with the uncertainty in our GLIMPSE-based calibration between J − K and [3.6]–[4.5], with which we can estimate the [3.6]–[4.5] color to within ∼0.009 mag (the Appendix).
Figure 4. Relation between fixed-metallicity bins of ϒ3.6 and [3.6]–[4.5] measured from the sequence of exponentially declining star formation rate models shown in Figure 2, with errors as described in the text. The solid black line shows our best-fit relation. The dashed and dotted lines show the results of fits over a restricted range of metallicity and age (see Table 1). The bluest point (Z = 0.0004) has been omitted for the fit traced by the dotted line, while the dashed line shows the fit to slightly different bins (not shown) from which the model with the oldest age at each metallicity is omitted.
Download figure:
Standard image High-resolution imageTaking a linear least-squares fit to the points in Figure 4, we find

We adopt this fit as our optimal color–M/L relation. As demonstrated by Table 1, this relation is not especially sensitive to the particular range of age and metallicity probed by our models. Even with restricted metallicity and age ranges, errors in the slope and intercept primarily quantify the uncertainty introduced by age/SFH.
Table 1. Best-fitting Relations between ϒ3.6 and [3.6]–[4.5] Color
| Fit Type | a | b | δa | δb |
|---|---|---|---|---|
| all | 3.98 | 0.13 | 0.99 | 0.08 |
| τ | 4.03 | 0.11 | 0.77 | 0.06 |
| Z | 3.92 | 0.12 | 1.30 | 0.12 |
Notes. Parameters of the best-fit relation log ϒ3.6 = a ([3.6]–[4.5]) + b to the models in Figure 2, for three different sets of metallicity and age ranges. Prior to the fit the models are binned at fixed metallicity (e.g., Figure 4). Fit-type "all" in the first row corresponds to a fit to all points 0.0004 <Z < 0.05 and 2 <τ <12 Gyr, with binning as shown in Figure 4. The fit in the second row discards models with the smallest τ (oldest age). The fit in the third row discards the lowest metallicity Z = 0.0004 but keeps all ages. The fit over the restricted range in e-folding τ (second row) should more realistically depict the trend for galaxies with bursty SFHs (see Figure 3).
Download table as: ASCIITypeset image
Considering that the ages of either early- or late-type galaxies (ETGs and LTGs) are expected to each fall within narrower ranges than the full range considered at each Z, the errors on the parameters of our optimal relation between ϒ3.6 and [3.6]–[4.5] color are even conservative. Fits only to models in Figure 2 with ages >7 Gyr (<7 Gyr), as would be representative of ETGs (LTGs), yield best-fit parameters a = 3.86 ± 0.82 and b = 0.18 ± 0.07 (a = 4.07 ± 0.67 and b = 0.09 ± 0.06).
For completeness we note that the spread in ϒ3.6 with age at fixed metallicity is larger the nearer the population is observed to the start of star formation. Also, this relation between ϒ3.6 and [3.6]–[4.5] does not account for dust extinction.
In addition, our best-fit relation predicts a change in ϒ3.6 by 0.2 dex for every 0.05 mag difference in color, slightly larger than typically emerges from standard single (optical)–color relations (see Z09; Bell & de Jong 2001). We emphasize, though, that by passing from optical colors to NIR-only colors, the stellar tracer changes from main-sequence stars to red giants, and we can expect the latter to show much less variation than the former for the same evolution in a given population.
4.4. Color-independent ϒ3.6
Over the color range −0.14 < [3.6]–[4.5] < −0.04, the 3.6 μm mass-to-light ratio for the oldest stars spans ∼0.3 dex, driven primarily by metallicity. Using the [3.6]–[4.5] color to constrain the metallicity, the only lingering uncertainty in ϒ3.6 is due to variation in the population age, which contributes an rms of 0.06–0.08 dex uncertainty at a given metallicity (see Figure 4). To reduce the uncertainty in ϒ3.6 to any greater degree would require better constraints on the population age. According to the trends described in Section 4.1, this would be possible using an optical color, but only by also incorporating a realistic model of the dust to account for extinction and reddening (as well as the scattering of light by dust).
On the other hand, we can leverage the age–metallicity relation (AMR) characteristic of old stellar populations to place a constraint on the age at a given metallicity. With the [3.6]–[4.5] color tracing both the metallicity and the age, the uncertainty in ϒ3.6 can be reduced. The AMR even suggests that a constant ϒ3.6 may be fairly reasonable, given that the relation between ϒ3.6 and Z is almost orthogonal to the relation between ϒ3.6 and τ. As such, old stellar populations across the Hubble sequence seem to be well described with a constant ϒ3.6. Indeed, according to Figure 2, old, metal-rich populations have comparable ϒ3.6 to younger, more metal-poor populations (compare ϒ3.6 at Z = 0.05, τ = 4 Gyr, with Z = 0.004, τ = 12 Gyr).
We confirm the implied independence of ϒ3.6 on color by adopting the relation between the ages and metallicities of elliptical galaxies measured by Gallazi et al. (2005) across the stellar mass range 8.91 <log M*/M☉ < 11.91. This supplies an estimate of the age at a given assumed metallicity, which we then translate back to the quantities ϒ3.6 and [3.6]–[4.5] color using metallicity-dependent linear fits of the relation between each quantity and population age from the set of models in Figure 2. Over the range of Gallazi et al. (2005) measured metallicities (from 0.002 ≲ Z ≲ 0.02), ϒ3.6 exhibits much less variation with color than implied in Figure 2. The AMR is consistent with a constant  = 0.6 for a Chabrier IMF22, good to within 0.06 dex. The uncertainty stems from the dispersion around the mean value over the adopted metallicity range, together with propagated errors due to the uncertainty in the fitted AMR represented by the intrinsic 1σ spread in the Gallazi et al. (2005) measurements.
The relation between old stellar age and metallicity allows us to know ϒ3.6 even better than suggested by the full grid of models in Figure 2. Uniformly weighted, those models are consistent with an average constant (color-independent) ϒ3.6 = 0.6 (Chabrier) and an estimated uncertainty 0.11 dex. But while our  incorporates a realistic intrinsic spread in the relation between age and metallicity as measured by Gallazi et al. (2005), it should be used with caution.
The existence of an AMR in stellar populations depends on the history of star formation in these systems. We have assumed that the AMR measured for the old stellar populations in elliptical galaxies can be applied to the old stellar populations in late-type galaxies (isolated from younger populations at 3.6 μm). This implicitly assumes that late-type disks had similar formation and evolutionary histories as present-day ellipticals, up to the point when the latter underwent quenching (and an associated morphological change), whereas the former continued to form stars.
For systems in which an AMR in the stellar populations is not likely (e.g., due to an atypical evolutionary history), we therefore recommend either adopting the more conservative uncertainty of 0.11 dex on the constant ϒ3.6 = 0.6 or using the [3.6]–[4.5] color-dependent relation in Section 4.3, which is preferred when color information is available.
The same applies locally within stellar systems, given indications that a link between age and metallicity persists within disks (e.g., MacArthur et al. 2004). This implies that ϒ3.6 will be relatively flat within a galaxy with population gradients (as well as that a single ϒ3.6 can be applied to galaxies of all types). The observed 2D [3.6]–[4.5] color distribution can be used to assess which ϒ3.6 and uncertainty may be most appropriate. An implied smooth, monotonic variation in metallicity ([3.6]–[4.5] color) throughout the system may indicate that  can be reliably applied; otherwise, the color-dependent relation should be adopted. In cases where color information is compromised (either because of contamination from nonstellar emission or data quality), we advocate the use of the most conservative estimate, log ϒ3.6 = −0.22 ± 0.11 dex.
The remarkable single, color-independent ϒ3.6 implied by the existence of an AMR within (and among) galaxies turns out to be a particular advantage for generating mass maps from our ICA maps of the old stellar light. As noted in Section 2.2, it may not be possible to retain full 2D color information tracking age or metallicity gradients in galaxies with pervasive nonstellar emission (Meidt et al. 2012a). The old stellar light map can nevertheless be converted to stellar mass with ∼15% accuracy (adopting the single, global [3.6]–[4.5] color that is retained; M. Querejeta et al., in preparation).
5. COMPARISON WITH ALTERNATIVE APPROACHES
In the previous section we defined a relation between ϒ3.6 and [3.6]–[4.5] for the oldest stars, the scatter about which is driven by age variation. At the same time, the AMR may favor a color-independent ϒ3.6. Together, these suggest that ϒ3.6 can be estimated to within ∼0.06–0.1 dex (∼15%–30%; depending on whether ϒ3.6 is taken to depend on [3.6]–[4.5] color). Remarkably, the uncertainty introduced by unconstrained age variations greatly improves upon the typical uncertainties associated with stellar M/L at shorter wavelengths using a single (optical–NIR) color (∼0.2 dex; Bell & de Jong 2001). Our uncertainty is even comparable to that achieved by using two colors to assign the M/L (∼0.05–0.1 dex; Zibetti et al. 2009). Moving to longer wavelengths and using only one color defined between 3.6 and 4.5 μm already achieves an accuracy similar to that which can be obtained with state-of-the-art techniques that use double the information (and which rely on dust models that may themselves not be entirely realistic). Below we compare our own ϒ3.6 to several other estimates specific to the 3.6 μm band.
5.1. LMC-based Calibration of ϒ3.6
Recently, Eskew et al. (2012) assembled an estimate of ϒ3.6 by using resolved measurements of the SFH of the LMC (Harris & Zaritsky 2009) to measure the mass in regions sampling throughout the map of 3.6 μm brightness. They find that mass is well traced by 3.6 μm flux and, based on the relation between the two, estimate ϒ3.6 = 0.53, with an uncertainty of ∼30%. Then, finding that the scatter about the relation tends to correlate with the [3.6]–[4.5] color, they fit the additional relation

attributing some part of the trend with [3.6]–[4.5] to the presence of either younger stellar populations (<1 Gyr) or dust emission (traced at 8 μm).
These estimates are reassuringly consistent with our own, although the second, in terms of [3.6]–[4.5] color, suggests a different (much weaker) color dependence than we found in Section 4.1. This may be expected, given that the fairly uniform metallicity of the LMC would restrict the range in [3.6]–[4.5] color. But if all of the color variation stems from age variation in this case (ages range from 12 Gyr to <1 Gyr in the LMC; Harris & Zaritsky 2009), then the shallower color dependence may suggest either that ϒ3.6 is weakly dependent on young populations, in particular, or that dust emission acts to remove the steeper trend we find.
5.2. ϒ3.6 in the Presence of Nonstellar Emission
There are several techniques to estimate the 3.6 μm M/L in the presence of nonstellar emission,  , based on global colors and total masses. Zhu et al. (2010) link SDSS masses with Spitzer luminosities and colors in SWIRE. Jarrett et al. (2013) use the Zhu et al. (2010) Two Micron Sky Survey (2MASS) relations to derive K-band masses and link these to WISE luminosities and colors for a small sample. Both relations extend redder than [3.6]–[4.5] = 0 and parameterize a dependence on [3.6]–[4.5] that is nearly the reverse of what we find. Zhu et al. (2010) also suggest that
  is much more sensitive to SFH than metallicity, contrary to our findings.
These calibrations primarily reflect the fact that, as the nonstellar emission tracing young stellar populations makes an increased fractional contribution to the integrated 3.6 and 4.5 μm, the global [3.6]–[4.5] color reddens (even independent of the dust properties) and the total luminosity increases, thus reducing the mass-to-light ratio.
The fractional contribution of nonstellar emission to the integrated light of a galaxy can be increased due to, e.g., an enhanced star formation rate (SFR) (at fixed mass) or an intrinsically less massive stellar component (at fixed SFR). Both of these cases would be associated with redder [3.6]–[4.5] colors and thus a lower M/L. But at the local level, the [3.6]–[4.5] color in galaxies also reflects real changes in the dust properties (PAH versus larger grains and the physical state of the dust; see Paper I), rendering the above estimates ineffective. For mapping the 2D stellar mass distribution, we advocate first removing the nonstellar emission and then applying the ϒ3.6 derived in this work.
6. DISCUSSION
6.1. Stellar Population Models and IMF
The relation between ϒ3.6 and [3.6]–[4.5] color presented here, while robust, still hinges on the assumed stellar population model and IMF. The J − H colors of old stellar populations, to which our [3.6]–[4.5] colors are tied, are fairly consistent from model to model (Bruzual 2007), even as predictions for optical–NIR colors like V − K vary by ∼0.3 mag at fixed age. In contrast, discrepancies in the NIR M/L of populations with (exponentially) declining SFHs emerge at all ages, as a result of differences in the treatment of stars in the AGB phase that occurs at Simple Stellar Population ages ∼1 Gyr. Depending on the model, predictions for the NIR contribution of AGB stars at this intermediate age are as low as 30% (BC03) or as high as 70% (Maraston 2005; and see the 2007 version of the BC03 models, hereafter CB07). As a result, ϒH predicted by CB07 and BC03 differ by ∼0.1 dex at all ages (Zibetti et al. 2009), with CB07 predicting a lower M/L.23 The larger NIR contribution of AGB stars at intermediate ages predicted by the Maraston (2005) models would imply a similarly lowered M/L. In these cases, ϒ3.6 would be reduced by ∼0.1 dex across all [3.6]–[4.5] colors.
We have opted to use the BC03 models for this work, given recent evidence suggesting that the assumed AGB prescription may be the most realistic. The NIR spectra of post-starburst galaxies studied by Zibetti et al. (2012) do not exhibit the strong molecular absorption predicted by Maraston (2005) models. A lower NIR contribution from AGB stars, as in the BC03 models, seems to provide the best fit to the SEDs of post-starburst galaxies analyzed by Kriek et al. (2010). A similarly low contribution is inferred for AGB stars in ∼1 Gyr old clusters in M100, arguably due to the extinction of the AGB by the circumstellar dust shell produced during this phase (Meidt et al. 2012b; which leads to reprocessed emission detected at mid-IR wavelengths). We therefore argue that the relation we derive based on BC03 models is optimal and that the uncertainties stemming from the properties of stellar populations are representative.
Only the uncertainty arising with the assumed IMF will dominate the lingering uncertainty in ϒ3.6 due to age or SFH. The Chabrier IMF, for one, entails an increased fraction of giants to dwarfs at low turnoff mass MTO, effectively decreasing the total M/L below the traditional Salpeter-based value (although the heavier main sequence will partially compensate in this case). Generally, the choice of the IMF will introduce systematic variation in log ϒ3.6 by 0.05 dex to 0.3 dex (see Bell & de Jong 2001; Z09; Bernardi et al. 2010). Given that the uncertainties on ϒ3.6 associated with the IMF exceed those arising with the stellar population, it should be possible to use ϒ3.6 to explore variation in the IMF, e.g., with global galaxy parameters.
6.2. Dust Emission
The presence of nonstellar emission is another potential source of discrepancy. We can expect the (positive) trend between ϒ3.6 and [3.6]–[4.5] color to weaken or even reverse (Jarrett et al. 2013) when dust contributes to the [3.6]–[4.5] color, and the mass-to-light ratio is therefore  =
=  . In such cases, our strictly stellar log ϒ3.6 = −0.23 ± 0.1 dex can still be useful and can even provide an estimate for the fractional contamination by dust emission since
where, e.g.,  is estimated with the observed dust reddened [3.6]–[4.5] following Jarrett et al. (2013).
We emphasize, again, that our estimate for ϒ3.6 here is most appropriate for 2D maps where the nonstellar emission has been removed and which thus arguably trace a uniformly old stellar population. Uncorrected 3.6 μm maps would most certainly require a more highly color-dependent M/L (at least locally) given the contribution from nonstellar emission. Without removing such emission, which can locally contribute as much as 30% (Paper I), then applying our color-independent stellar ϒ3.6 = 0.6 will result in significant overdensities, e.g., at the locations of dusty spiral arms. The overestimation in 2D stellar mass surface density exceeds the uncertainty associated with our optimal estimate of ϒ3.6.24 The local effect of the contaminants can be quite large and should be kept in mind, e.g., when estimating the stellar mass in individual structural components mapped at 3.6 μm. The global contribution from dust will be smaller, introducing ∼10% overestimation in the total mass (Paper I).
6.3. Future Advances
In Section 4.4 we discussed the use of the AMR in old stellar populations to reduce the uncertainty in ϒ3.6 due to age variations left unconstrained by the [3.6]–[4.5] color, as in Figure 4. As an alternative, age constraints are possible using optical colors dominated by younger stars, with the incorporation of a realistic dust model to account for extinction and reddening (as well as the scattering of light by dust; e.g., Zibetti et al. 2009). Ideally, some part of the constraint on the dust model would come from the far-IR dust emission itself. SED fitting with MAGPHYS (da Cunha et al. 2008), which samples throughout the combined dust and stellar SED, can provide a dust-free view of the properties of the stellar population and is potentially very powerful when applied pixel by pixel.
On the other hand, it might be possible to use the information on the dust emission contained in the IRAC bands (which can be isolated with ICA). Because this is primarily emission from the smallest grains (PAH and the hottest dust), it would be necessary to first define a relation between these grains and the bulk of the dust.
7. SUMMARY AND CONCLUSIONS
We have shown that the information contained in IRAC images at 3.6 and 4.5 μm is optimal for estimating stellar masses of nearby galaxies. At 3.6 μm we combine an intrinsically modestly varying stellar M/L with the ability to constrain variations in the properties of the stellar population via the [3.6]–[4.5] colors of old stars. We achieve an uncertainty as low as 0.06 dex by using the [3.6]–[4.5] color to constrain the metallicity dependence of the stellar M/L; more modest unconstrained age variations at these long wavelengths contribute an uncertainty that is comparable to, if not below, that which can be achieved at shorter wavelengths, where the effects of dust extinction or reddening and young stars are present. Much of the uncertainty normally introduced with the use of SPS models at long wavelengths (λ ≳ 2.2 μm) is reduced by using the observed colors of GLIMPSE giants to relate the NIR colors of SPS models to realistic [3.6]–[4.5] colors.
Our preferred method of assigning the stellar M/L uses the [3.6]–[4.5] color to account for the increase in the brightness of giant stars with increasing metallicity (traced by [3.6]–[4.5] color). We define a relation between [3.6]–[4.5] color and ϒ3.6 that extends across the full range of [3.6]–[4.5] colors exhibited by galaxies across the Hubble sequence.
This relation is designed to be applied to the light from old stars alone, i.e., when [3.6]–[4.5] colors reflect genuine variation in the properties of the old stellar population. This makes it applicable to early-type galaxies, with little ongoing star formation (and minimal dust extinction or reddening), or in late-type galaxies, where nonstellar contaminating emission is isolated from the old stellar light with ICA (Paper I).
Remarkably, the existence of an AMR in old stellar populations may even lead to a preference for a single, color-independent ϒ3.6 = 0.6, good to an accuracy of 0.06 dex. We recommend adopting a more conservative 0.1 dex uncertainty on ϒ3.6 = 0.6 given a suspected atypical evolutionary history or when it is not possible to correct for the presence of nonstellar emission (which leads to characteristically red [3.6]–[4.5] colors). In this case, additional uncertainty in the stellar mass estimate can arise as a result of the contribution from the nonstellar emission, which can be as large as 30% locally (i.e., an uncertainty comparable to that associated with the stellar M/L).
Either of the two estimates for ϒ3.6 presented here (with or without [3.6]–[4.5] color information) marks a significant improvement in our view of how the stellar mass is distributed in and among galaxies. With greater confidence in the stellar M/L we also gain much-needed leverage on the dark matter content of galaxies, as well as the opportunity to explore variations in the IMF with global galaxy properties. We anticipate successfully implementing our preferred approach, one that yields the smallest uncertainty in stellar mass, to galaxies in S4G; future work will first remove the contribution from nonstellar emission in S4G 3.6 μm images with ICA and then use the [3.6]–[4.5] color of the old stellar light to assign ϒ3.6 (M. Querejeta et al., in preparation).
Thanks to Mariya Lyubenova for fruitful discussion and the entire S4G team. E.A., A.B., J.K., G.vdV., M.Q., S.M., and E.S. acknowledge financial support of the DAGAL network from the People Programme (Marie Curie Actions) of the European Union's Seventh Framework Programme FP7/2007-2013/ under REA grant agreement number PITN-GA-2011-289313. K.S., J.-C.M.-M., and T.K. acknowledge support from the National Radio Astronomy Observatory, which is a facility of the National Science Foundation operated under cooperative agreement by Associated Universities, Inc.
APPENDIX: IRAC COLORS OF GIANT STARS
The GLIMPSE survey of the galactic midplane (Benjamin et al. 2003; Churchwell et al. 2009), which combines 2MASS JHK with Spitzer/IRAC imaging observations, furnishes the opportunity to calibrate an empirical relation between the NIR colors of giant stars and their [3.6]–[4.5] colors (specific to the IRAC bands). From all catalogued GLIMPSE objects detected simultaneously in the J, H, K, 3.6, and 4.5 micron bands brighter than apparent m3.6 = 11 mag, we select candidate giant stars by initially imposing the following criteria:


The nearest dwarf stars that match these criteria have sufficiently different spectral properties in the NIR at fixed V − K color (bluer J − H colors; Bessell & Brett 1988, hereafter BB88) that our classification criteria (described below) should naturally select against them. But to prevent contamination from stars reddened by foreground dust, as well as "infrared excess" sources with nonphotospheric dust emission, we impose an additional requirement K−[8] < 0.1 (Origlia et al. 2010; Indebetouw et al. 2005). This limit to reprocessed dust emission (reradiated at longer wavelengths) also helps avoid misclassifications of dust-reddened giants (Origlia et al. 2010).
To classify the giants we impose three constraints per spectral type that must be simultaneously satisfied. The giant spectral type is defined over a narrow bin ±0.05 mag in width around each of three cataloged NIR colors (J − H, H − K, and J − K) in the classification by BB88, adopting the transformation to 2MASS colors defined by Carpenter (2001). The bin width is set to the average photometric color error reported in the GLIMPSE catalog for all three colors, which is also the typical color difference between BB88 spectral types. By imposing these strict constraints in combination with our limit on reprocessed dust emission, we aim to select against dust-reddened stars that appear to match the typical NIR colors of giants.
Each spectral type (defined according to temperature) contains a mix of ages and metallicities. Because we are sampling the Rayleigh–Jeans tail, the relations between the NIR colors of giants remain robust to changes in metallicity, keeping the ratio of colors nearly independent of color. As demonstrated in Figure 5, this also appears to remain true for the mid-IR [3.6]–[4.5] color in relation to any given NIR color, given the fact that it tracks CO absorption in the 4.5 μm band (and therefore reflects more than just a temperature dependence on metallicity). Although there is some nonlinearity,25 We can fit the 15 total spectral classes with the following linear relation:

Table 2 lists the best-fit linear relations between other NIR colors and [3.6]–[4.5] color.

Figure 5. Mean [3.6]–[4.5] color and its error for each of the 15 spectral classes against the J − H color of each class of giants. Each bin contains hundreds of stars. The solid black line shows our best-fit linear relation between the [3.6]–[4.5] and J − H colors of GLIMPSE giants sorted by spectral type (Table 2).
Download figure:
Standard image High-resolution imageTable 2. Best-fitting Relations between the NIR and [3.6]–[4.5] Colors of Giant Stars in GLIMPSE
| Color | a | b | δa | δb |
|---|---|---|---|---|
| J − H | −0.223 | 0.053 | 0.013 | 0.007 |
| J − K | −0.165 | 0.049 | 0.01 | 0.008 |
| H − K | −0.604 | 0.031 | 0.054 | 0.031 |
Notes. Parameters of the best-fit relation [3.6]–[4.5] = a (color)+ b to 15 giant spectral classes defined in BB88.
Download table as: ASCIITypeset image
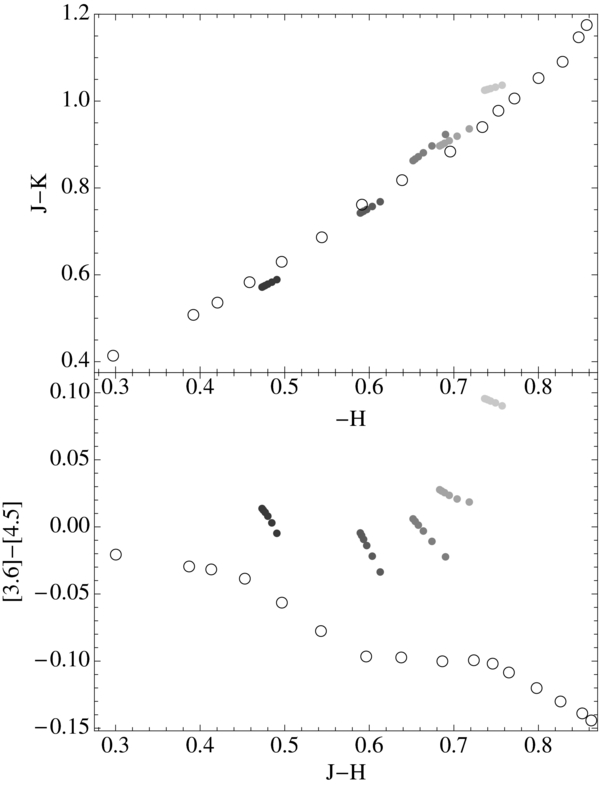
Again, because we are sampling the Rayleigh–Jeans tail, we expect the relations between NIR giant colors to remain robust to changes in metallicity (although the individual colors themselves may vary), and this appears to be true for our empirical calibration of the [3.6]–[4.5] color for each spectral type. This also implies that we can use these relations to cast the NIR colors of synthesized stellar population models in terms of the [3.6]–[4.5] color. Indeed, in Figure 6 we show the NIR colors of the 15 BB88 spectral types together with those of synthesized stellar populations that span a range of metallicities and ages (first introduced in Section 3.2 in the main text). The close agreement stems from the fact that the colors of our old synthesized stellar populations are dominated by the colors of giants, which have much higher luminosities than dwarf stars (as much as two orders of magnitude).
Figure 6. Comparison between the NIR colors of giant stars (open circles) and BC03 SPS models (filled circles) considered in Figures 1 and 2. The gray scaling of the model points varies with SPS metallicity from low (black) to high (light gray). At each metallicity, a range of ages is shown (see Figure 2).
Download figure:
Standard image High-resolution image
Footnotes
- 20
More specifically, with time since the start of the last episode of star formation.
- 21
Dust emission reddens [3.6]–[4.5] and, as shown in Paper I, this is responsible for the distribution of observed [3.6]–[4.5] colors in nearby galaxies varying between −0.01 and ∼0.3.
- 22
With a Salpeter IMF this corresponds to ϒ3.6 = 1.07.
- 23
In synthesized populations with continual star formation the asymptotic giant branch is continually populated, but the stars there are dominated by main-sequence stars at all but the youngest ages. At old ages, the variation from BC03 to CB07 remains minor (and nearly uniform), given the predominance of main-sequence stars over AGB stars in the population (Zibetti et al. 2009).
- 24
The errors associated with the presence of nonstellar contaminant emission are comparable to the 0.1–0.25 dex uncertainty in stellar M/L estimates based on single-color M/L relations or the 0.1–0.4 dex uncertainty owing to the choice of the AGB prescription or IMF adopted in the models (Z09).
- 25
The plateau in [3.6]–[4.5] color in the range 0.55 <J − H < 0.75 (spectral class K0–K5; Figure 5) may reflect the genuine behavior of CO absorption because it echos the trend in the equivalent width of the 12CO absorption band at λ = 2.29 μm with the giant spectral class demonstrated by Cesetti et al. (2013). But because the (photometric) [3.6]–[4.5] color uncertainty is on the order of 0.02 mag for these GLIMPSE objects, this behavior corresponds to only modestly significant departures in [3.6]–[4.5] color away from our adopted linear relation.