


ABSTRACT
Simultaneous radio, optical (both photometry and polarimetry), X-ray, and γ-ray observations of the radio-loud narrow-line Seyfert 1 (RL-NLSy1) galaxy J0849+5108 are presented. A massive three-magnitude optical flare across five nights in 2013 April is detected, along with associated flux increases in the γ-ray, infrared, and radio regimes; no comparable event was detected in the X-rays, though this may be due to poor coverage. A spectral energy distribution (SED) for the object using quasi-simultaneous data centered on the optical flare is compared to the previously published SEDs for the object by D'Ammando et al. The flare event coincided with a high degree of optical polarization. High amplitude optical microvariability is clearly detected, and is found to be of comparable amplitude when the object is observed in both faint and bright states. The object is also seen to undergo rapid shifts in polarization in both degree and electric vector position angle within a single night. J0849+5108 appears to show even more extreme variability than that previously reported for the similar object J0948+0022. These observations appear to support the growing claim that some RL-NLSy1 galaxies constitute a sub-class of blazar-like active galactic nuclei.
Export citation and abstract BibTeX RIS
1. INTRODUCTION
SDSS J084957.97+510829.0 (hereafter J0849+5108) is a moderate redshift (z = 0.5847) active galactic nucleus (AGN) located just south of a prominent foreground spiral galaxy. The object was first identified as an "eruptive BL Lacertae object" when it underwent a massive four magnitude optical flare in 1975 (Arp et al. 1979). This flare occurred over the course of one month or less. The low temporal resolution of the observations reported in Arp et al. (1979) prevented any tighter conclusions on the true time scale of the outburst. Later, the Sloan Digital Sky Survey (SDSS) allowed the optical spectrum of the object to be examined in detail (Zhou et al. 2005), where it was seen to possess strong Fe ii emission, FWHM (Hβ) ≈ 1710 km s−1, and [O ii]/Hβ ≈ 0.32 during an optically faint state. By the standard definitions (Osterbrock & Pogge 1985; Goodrich 1989), these characteristics are all typical of a narrow line Seyfert 1 galaxy (NLSy1). Still later, the object's radio-loudness parameter, defined as R = (Flux5GHz/FluxB), the ratio between the luminosities in the 5 GHz and optical B bands (Kellerman et al. 1989), was found to have a value of R ≈ 1440, or log (R) = 3.16 (Yuan et al. 2008). This places J0849+5108 well within the very radio loud regime, defined as R > 100. This is atypical of most NLSy1s; only 2.5% of such objects reach this radio loudness threshold, and most (93%) are considered to be radio-quiet, having R < 10 (Komossa et al. 2006). Most recently, the launch of the Fermi space telescope has allowed the object to be confirmed as a variable γ-ray source (D'Ammando et al. 2012); this same study also constructed a spectral energy distribution (SED) for the object, finding it to possess a double-peaked structure.
This collection of observational characteristics suggests that J0849+5108 straddles the border between two classes of AGNs. On the one hand, the emission line properties of the object are indicative of an NLSy1. On the other hand, extreme radio loudness, large amplitude optical variability, and a double peaked SED are very rare among NLSy1s. However, these anomalous characteristics are common, or even definitive, to a second class of AGN known as blazars. Like all other AGNs, these objects are thought to consist of an accreting super massive black hole (SMBH) imbedded in the center of a host galaxy. Radio-loud AGNs, such as blazars, are thought to also contain a relativistic jet oriented perpendicular to the plane of the accretion disk. The unique property of blazars is that this jet happens to lie almost directly along the line of sight to the observer.
The combination of blazar-like and Seyfert-like observational properties suggests that J0849+5108 is an NLSy1 hosting a relativistic jet that happens to share the specific orientation of blazars. This is of particular interest since AGNs with blazar-like orientations have historically been found to be hosted by elliptical galaxies, whereas Seyferts are normally hosted by spiral galaxies. Other research groups have identified a number of very radio loud NLSy1s with similar properties, indicating that J0849+5108 may be one example of an entirely new class of high-energy, blazar-like AGNs (Foschini et al. 2009; Yuan et al. 2008; Abdo et al. 2009).
One of the hallmark characteristics of blazar activity, however, has been neglected in regards to J0849+5108 and similar objects: microvariability. Blazars are well-known for their ability to show significant brightness variations on timescales of a few hours or even minutes (Miller et al. 1989), and are commonly seen to do so. In contrast, such behavior is very rare among other types of AGNs. A detection of microvariability in J0849+5108 will further confirm its blazar-like nature.
In addition, blazars also show significant optical polarization, and this polarization is also often highly variable (Angel & Stockman 1980). While J0849+5108 is already known to reach levels of polarization greater than 10% (Moore & Stockman 1981), this paper links the changing polarized behavior of the object to its optical brightness state. Finally, publicly available γ-ray data from the Fermi γ-ray space telescope and radio data from the Owens Valley Radio Observatory (OVRO) will be used to relate any observed optical activity to changes in other wavelength regimes.
2. OBSERVATIONS
2.1. Radio Data
Since late 2007, the 40 m radio telescope at OVRO has been engaged in a near continuous blazar monitoring program in the 15 GHZ regime designed to compliment γ-ray observations of the same sources detected by Fermi (Richards et al. 2011). Starting with a core sample of 1158 objects—including J0849+5108—the program now encompasses over 1700 AGNs. The entire sample is observed at an approximate biweekly cadence. The instrument makes use of a dicke switched dual-beam receiver and utilizes a "double switching" method of observation. This technique involves collecting signals from a target object in one beam while the other observes the background sky as a reference; the true target signal is considered to be the difference between the two beams. This background subtraction allows for noise contributions such as atmospheric variation or ground spillover to be minimized. The target and background sky are then switched to the opposite beam and a second measurement is taken. A single data point thus consists of two observations averaged together.
Repeated observations of 3C 286 are used in determining the absolute flux density of all objects observed under the OVRO blazar monitoring program; this galaxy is both bright and known to be stable in brightness (Richards et al. 2011). For the purposes of calibration, 3C 286 is assumed to have a total flux density of 3.44 Jy (Baars et al. 1977) at an uncertainty of 5%. As of the time of this writing, 334 observations of J0849+5108 had been collected over the course of the monitoring program. The object has shown an average flux density of 0.280 ± 0.015 Jy, with a total range of approximately 0.4 Jy.
2.2. Optical Photometry
All optical data presented in this paper were obtained at the Lowell observatory in Flagstaff, Arizona. The 31 inch NURO, 42 inch Hall, and 72 inch Perkins telescopes were used to acquire standard Johnson R-band optical images across five observing sessions starting in 2013 January and ending in 2013 May, for a total of 560 observations across 29 nights. The object was observed for at least two hours during 21 of these nights, thus allowing for the detection of microvariability if present. Observing sessions typically lasted on the order of one week and were spaced roughly one month apart, centering around the new moon.
For each telescope, 10 bias frames were taken at the beginning of every night of observation and then combined into a single master bias. In a similar manner, a set of 10 flat fielding images were obtained at least once per observing session, then combined into a master flat frame. The master bias and master flat frames were then applied to all science images taken during the same observing session using standard IRAF tools. No dark frames were obtained due to the fact that the CCD cameras of all three telescopes are cooled using liquid nitrogen to the point that the dark current is considered negligible.
Optical magnitudes for the object were determined through the use of differential photometry using a 7'' aperture radius. Seven in-field stars were selected for use in this analysis. These stars were chosen almost entirely at random, the only criteria for selection being that they were of comparable brightness to J0849+5108 itself and that they were isolated from other background objects. In order to find the true apparent magnitudes of these seven stars, the object field of view was observed during a photometric night and at nearly the same airmass as several stars taken from the Landolt list of equatorial stars of known magnitude (Landolt 1992), allowing for a straightforward derivation based on the observed magnitudes of the Landolt objects using the equation
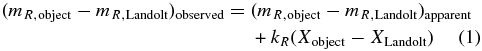
where mR, object refers to the observed and apparent magnitudes of the in-field check star, mR, Landolt refers to the observed and apparent magnitudes of a Landolt equatorial star, kR is the extinction coefficient in the R band, and X refers to the airmass. Given that the object and Landolt fields were observed at very nearly the same airmass, the last term of Equation (1) is essentially zero, allowing for a simple derivation of the apparent magnitude of the in-field check star. This process was identical to the one presented in a previous paper for stars in the field of the similar object SDSS J094857.32+002225.5 (hereafter J0948+0022; Maune et al. 2013).
Once the apparent magnitudes of the in-field stars had been derived, it was necessary to verify that none of them demonstrated intrinsic variability of their own, since this could lead to false detections of variability in the object itself. This was done by treating each star as an unknown object and rederiving their magnitudes based on the other six. In all seven instances, the in-field star was found to be non-varying across the observing session to within the associated uncertainty. The selected stars are indicated in Figure 1. The calculated apparent magnitudes and associated uncertainties of these stars may be found in Table 1.

Figure 1. Finding chart for J0849+5108 with the object highlighted. The field of view is 13 5 × 135. Note the foreground spiral galaxy just north of the object. See Table 1 for comparison star magnitudes.
Download figure:
Standard image High-resolution imageTable 1. Comparison Star Information for Figure 1
| Star Number | Magnitude | Uncertainty |
|---|---|---|
| 1 | 15.79 | 0.02 |
| 2 | 14.44 | 0.02 |
| 3 | 15.87 | 0.02 |
| 4 | 15.24 | 0.02 |
| 5 | 14.29 | 0.02 |
| 6 | 15.00 | 0.02 |
| 7 | 14.19 | 0.02 |
Note. All magnitudes are in the R band.
Download table as: ASCIITypeset image
2.3. Optical Polarimetry
In addition to standard imaging capability, the PRISM instrument of the Perkins telescope is equipped with a rotating half-waveplate polarimeter, allowing for the performance of photopolarimetry. As above, these data were exclusively taken in the R band. Polarimetry observations were only obtained under photometric conditions; otherwise, assuming the prevailing weather still allowed for observations, differential photometry was performed on the object instead. This allowed for eight observations across seven nights spanning from 2013 January 8 to May 14, overlapping with three of the five photometry observing sessions.
Photopolarimetric observations were constructed from a series of either two or three measurements of the Q and U Stokes parameters. Each measurement was derived from a series of four images, each image taken with the wave plate at a different instrumentational position angle (0°, 45°, 90°, and 135°). Image reduction was virtually identical to the process outlined in the previous section for the photometry data, except that a set of flat-fielding images had to be taken for each position of the wave plate. These images were then combined into four master calibration files and applied to all science images obtained at the matching wave-plate position in the manner described earlier.
In order to account for instrumentational polarization, unpolarized standard stars taken from the Schmidt list of stellar standards (Schmidt et al. 1992) were also observed at least twice during each observing session. For the Perkins telescope, this offset is typically on the order of 0.5% or less (Jorstad et al. 2010). Polarized standards taken from the same source were also observed for use in calibrating the instrumentational position angle.
In order to correct for both interstellar and instrumentational polarization, the average percent polarization observed for the seven stars detailed in Section 2.2 was subtracted from the observed polarization of the object. The fact that the polarimeter had a wide enough field of view to observe these stars also allowed for a simultaneous measurement of the optical brightness of the object.
Photopolarimetric data obtained for this investigation can be found in Table 2.
Table 2. Photopolarimetric Observations of the Object
| Julian Day | R Magnitude | Polarization | EVPA |
|---|---|---|---|
| 2456300.9 | 17.49 (0.01) | 04.09 (0.50) | −40.85 (20.51) |
| 2456301.9 | 17.77 (0.01) | 05.00 (3.65) | +41.60 (19.26) |
| 2456393.7 | 16.55 (0.01) | 09.97 (1.26) | −11.07 (02.25) |
| 2456394.7 | 16.11 (0.01) | 03.06 (0.84) | +11.10 (00.45) |
| 2456394.8 | 16.23 (0.01) | 05.80 (0.78) | −25.39 (04.26) |
| 2456401.7 | 14.46 (0.01) | 12.23 (0.43) | −00.04 (00.74) |
| 2456425.7 | 14.78 (0.01) | 10.98 (0.28) | +62.63 (01.53) |
| 2456426.7 | 15.44 (0.01) | 06.30 (0.36) | +50.36 (01.14) |
Notes. Columns are (1) fractional julian day of observation, (2) optical R magnitude, (3) percent polarization, and (4) electric vector position angle in degrees. Associated uncertainties are shown in parenthesis. Optical measurements that lack a corresponding polarization measurement are not shown.
Download table as: ASCIITypeset image
2.4. X-Rays
The X-Ray Telescope (XRT) onboard the Swift observatory was used to collect data on 2013 April 22. Processing was done using v6.14 of the HEASOFT software package. Counts were extracted in the 0.5–10 keV energy range from a region 30'' in diameter surrounding the source. Background counts were extracted from an equally sized source-free region of the chip. No contamination was seen from the nearby spiral galaxy. Spectral response files were created using the task xrtmkarf, and the spectrum was modeled as a power law plus absorption. This yielded an acceptable fit, with a photon index of Γ = 2.6 ± 0.9.
Optical and UV images from the Ultraviolet and Optical Telescope (UVOT) were also processed. Fluxes and magnitudes were obtained from the uvotsource task, using an extraction region 3'' in size, which limited contamination from the nearby spiral galaxy. Measurements were taken in the UVOT w2, w1, and m2 filters, along with standard UBV filters.
2.5. Gamma Rays
Gamma-ray data were obtained through the Fermi-LAT public data server. The Large Area Telescope (LAT), on board the Fermi γ-ray Space Telescope, is a pair-conversion detector sensitive to γ-rays in the 20 MeV to several hundred GeV energy range (Atwood et al. 2009). The instrument has worked almost continuously in the all-sky-survey mode since its launch in 2008 June, which allows coverage of the entire γ-ray sky approximately every three hours. The data were reduced and analyzed using ScienceTools v9r31p1 and instrument response functions P7SOURCE_V6. The likelihood analysis procedure as described at the FSSC Web site4 was used throughout this paper. Photon fluxes were calculated using data from JD 2456293.5 to JD 2456524.5 (2013 January 1 to August 20).
The γ-ray data used in this paper were downloaded from the Fermi science center Web site on 2013 August 22 and cover a region on the sky 10° in radius, centered on the optical location of J0849+5108, and in an energy range of 0.1–300 GeV. The only data corresponding to the source class (evclass = 2) were utilized, with a 52° cut-off rock angle of the spacecraft. An additional cut, utilizing an angle of 100° from the zenith was imposed in order to minimize the contamination due to γ-rays coming from Earth's upper atmosphere. Photon fluxes and spectral fits were derived using an unbinned maximum likelihood analysis, which was accomplished using the ScienceTool gtlike.
This paper uses the test statistic (TS) to determine the significance of the γ-ray signal from J0849+5108. The TS is defined as TS = 2Δlog(likelihood), where likelihood refers to the likelihood ratio test as described in Mattox et al. (1996). The source model used to reduce the data consisted of all the known γ-ray point sources located within a 15° radius of the object of interest. Initial values for all spectral parameters for these sources were taken from the LAT 2 yr Point Source Catalog (Nolan et al. 2012), while the spectral model (power law) and initial values for the target were taken from D'Ammando et al. (2012). The "Prefactor" and "Index" (γ) attributes of the target were left as free parameters during the likelihood fit, as were those of several of the objects in the field. Further details concerning the likelihood analysis procedure used in this paper can be found in Eggen et al. (2013).
3. RESULTS
The second panel of Figure 2 presents the overall optical variations detected for J0849+5108 during the 2013 observing session. As with all optical light curves that will be presented in this paper, diamond data points represent data from Lowell's 31 inch telescope, triangles represent data from the 42 inch, and squares represent data from the 72 inch. Unique to this figure is optical data derived from combining polarimetric images back into photometry, which are represented as X's. The object exhibits a remarkable range in magnitude, brightening from a minimum of R = 18.57 in February to a maximum of R = 14.46 in April, a more than four magnitude change in just two months. Of particular interest are the final five nights of the April observing session (shown in greater detail in Figure 3), in which the object undergoes a major flare of three magnitudes, including a variation of over one magnitude between two successive nights (17 April and 18 April). These results are comparable to the previously mentioned event detailed in Arp et al. (1979), in which J0849+5108 was observed in a passband approximating the Johnson V band and was seen to undergo a four magnitude flare on a timescale as short as one month.

Figure 2. Observational data from 2013 January–August. Panels from top to bottom are radio flux in Jy from OVRO, optical R-band behavior, percentage of optical polarization, electric vector position angle (EVPA) for each polarized optical data point, photon count(s) from Swift's XRT instrument, γ-ray data in units of 10−7 photons cm−2 s−1. γ-ray data are presented in daily time bins during the large flare event beginning in mid-April and in weekly time bins otherwise. All figures are plotted on the same time axis. The dotted lines indicate a period of time in which a gradual rise was seen in the IR; see the text for details.
Download figure:
Standard image High-resolution image
Figure 3. Optical and γ-ray behavior of the object during the April flare event; this is a closer view of data presented in Figure 2. Optical data is presented in both magnitudes and flux (Jy); squares represent data obtained from Lowell's 72 inch telescope and triangles represent data taken from the 42 inch. The γ-ray flux is plotted in two-day bins.
Download figure:
Standard image High-resolution imageThe optical variability behavior of the object can only be described as extreme. Not only does J0849+5108 undergo large amplitude brightness changes within a single night (typically on the order of 0.3–0.4 mag), these events are also incredibly common. At the 3σ level, the object demonstrates a duty cycle (defined as the ratio between the number of nights spent in an active versus inactive state) of 100%. That is, for every night in which the target was monitored for at least two hours—thus giving the object a reasonable amount of time to exhibit a significant change in flux—microvariability was observed. Perhaps more tellingly, these short timescale variations are typically not minor events; even when doubling the detection threshold to the 6σ level, J0849+5108 still shows a duty cycle of 81%.
Previous studies (Ferrara 2000; Carini et al. 2003) have found that the expected duty cycles of radio-quiet narrow-line Seyferts, radio-quiet broad-line Seyferts, radio-loud Seyferts, and even high energy peaked blazars (HBLs) fall very short of this value, being on the order of 4%, 10%, 19%, and 45% respectively (Miller & Noble 1996; Ferrara 2000; Carini et al. 2003). Of all AGNs, only low energy peaked blazars (LBLs) commonly demonstrate comparable duty cycles, on the order of ~80% (Miller & Noble 1996). It should be further noted that the radio-quiet narrow-line Seyferts observed by Ferrara demonstrated an amplitude of variability no greater than a few hundredths of a magnitude within a single night. This indicates that J0849+5108 is a remarkably variable object even when compared to blazars, and compares favorably to the similar radio-loud NLSy1 J0948+0022, first found to be blazar-like by (Zhou et al. 2003). The short-timescale behavior of J0948+0022 was previously investigated in Maune et al. (2013), and was found to have a duty cycle of 57%. This corresponds to a 6σ detection level; at the time of publication, the authors did not have an automated, non-biased method of determining whether or not a night showed microvariability beyond visually examining the light curves, and therefore chose to be highly cautious in claiming detections of the presence of microvariability. This has since been rectified. At the 3σ level more commonly used in scientific literature, J0948+0022 shows a duty cycle of 91%, slightly less than that of J0849+5108.
In addition to these extreme brightness variations the object is significantly polarized, demonstrating a range of polarization of 3.1%–12.3%. Interestingly, the highest polarization observed for J0849+5108 appears to occur when the object is in the brightest optical state (Figure 2), indicating a not-unexpected link between activity in the magnetic field—and therefore the jet—with the overall brightness of the object. Finally, it should be noted that while polarimetric data were only collected multiple times within the same night on one occasion, there was a significant (beyond the uncertainty) change in the detected level of optical polarization, rising from 3.06 ± 0.84% to 5.80 ± 0.78%. This was accompanied by a large change in EVPA as well. It is therefore likely that optical microvariability is accompanied by similarly rapid changes in optical polarization.
Figure 2 also shows that there was a large increase in γ-ray flux that corresponded to the abrupt increase in optical brightness seen in 2013 April. Before this event, J0849+5108 was below the γ-ray detection threshold for the Fermi telescope when using weekly data bins; only upper limits could be determined at this time. During the optical event, the γ-rays also underwent a sudden flare of activity and remained in a detectable, albeit faint, state for over a month afterward. It should be noted that the optical flux also appears to have remained in a bright state during this time, although it is possible that the object dimmed and then brightened again between observing sessions. The events of the April flare can be seen in more detail in Figure 3, in which the γ-ray data are plotted in two-day bins.
Interestingly, the radio data do not show the same flaring behavior in April as the γ-ray and optical regimes do. Although there was a noticeable increase in flux during this time, the peak radio flux was not reached until June 22, 65 days after the first γ-ray spike. In addition, the increase in radio flux was a far more gradual build up. It should also be noted that at this time the object was the brightest it has ever been in the history of OVRO's monitoring program with an absolute flux of 0.53 ± 0.01 Jy; only once before, on 2009 December 9, had this level of intensity ever been reached. This peak intensity is essentially double the flux that was observed in the radio during the time of the γ-ray and optical flares.
Though the raw data were unavailable to the authors, astronomers at the National Institute for Astrophysics, Optics and Electronics in Mexico further reported a slow, ∼30% increase in infrared flux between 4 April and 5 May (Carrasco et al. 2013). This time frame is bounded by the vertical dashed lines in Figure 2. In addition, by May 17 (29 days after the original flare in the γ-rays) the object had undergone a three-fold increase in flux, reaching peak values of H = 13.57 ± 0.05 and k = 12.57 ± 0.11 mag.
Finally, the radio, optical, and γ-ray data described above were combined with near-ultraviolet and X-ray data obtained from Swift to create a quasi-simultaneous SED for J0849+5108. This SED is shown in Figure 4 and details the appearance of the object during the 2013 April flare event. All observations are within five days of the time of the peak observed optical flux. The Swift data covers an energy range of 0.5–10 keV in the X-rays; unfortunately, only low exposure (7 ks) data was available during the time of the flare, resulting in a poor quality X-ray spectrum. No claim as to the slope of the spectrum in this regime is made due to this issue. Instead, the X-ray data is plotted as a single data point with bars indicating the energy range.

Figure 4. SED of J0849+5108 during the time of the April flare event. The data used to construct this figure were obtained from OVRO (2013 April 24), Swift (UVOT and XRT, 2013 April 22), and Fermi-LAT (2013 April 20). XRT data ranges from 0.5 to 10 keV. The optical R-band data point was obtained from Lowell, and represents the average magnitude observed for the night of 2013 April 19.
Download figure:
Standard image High-resolution imageFor purposes of comparison, two SEDs of the object during previous active and inactive states are shown in Figure 5, along with the data from Figure 4. This figure is reprinted from (D'Ammando et al. 2013). For the remainder of this discussion, the SED appearing in Figure 4 will be referred to as the April SED, the data plotted in red circles in Figure 5 will be referred to as the quiescent SED, and the data plotted in green squares in the same figure will be called the active SED.

Figure 5. SED of J0849+5108 during previous active (green squares) and quiescent (red circles) states. This figure was taken from Figure 5 of D'Ammando et al. (2013). For ease of comparison, the same data appearing in the previous figure has been superimposed as black triangles.
Download figure:
Standard image High-resolution imageIn the synchrotron/optical-UV peak, the slope of the April SED is much steeper than that of the quiescent SED, but nearly matches that of the active one. The latter statement is somewhat curious, as the peak observed flux in the April SED is significantly higher than that presented in the active SED; one would therefore expect the April SED to have a steeper slope. This may be due to the fact that the Swift optical and UV data for the April SED was taken several days after the peak R-band observations at Lowell, giving the higher frequency bands observed by Swift time to settle into a lower flux state. This is suggested by the large gap between the R band and other optical data in Figure 4. Alternatively, the difference may simply be due to the fact that the active SED lacks an R-band data point. Perhaps the model presented in Figure 5 was incorrect in assuming the active SED would turn over so quickly, but instead should have risen to similarly high fluxes.
At the higher energy Compton peak the slope of the April SED is again much steeper than what is observed for the quiescent state, but in this case the slope is also much steeper than what is seen in the active state as well. The highest flux values seen in the April SED are comparable to that of the active SED, but rapidly fall below those of the quiescent one. Overall, it appears that the high energy peak of the April SED is shifted to slightly lower energies than either of the SEDs presented in Figure 5, with the sharp cutoff in flux appearing at frequencies of magnitude ν = 1024 Hz, whereas both the quiescent and active SEDs experience a cutoff frequency of approximately ν = 1025 Hz. This is somewhat surprising: given that the April SED depicts a flaring event, one would normally expect the peak to be shifted to higher frequencies rather than lower ones. This discrepancy may be explained by the fact that in a truly quiescent state the γ-ray emission of J0849+5108 is non-detectable; the object only occasionally rises above background levels. This implies that the γ-ray emission seen in the quiescent SED is actually in a somewhat elevated state. Given that the γ-ray emission of J0849+5108 had been in a non-detectable state immediately prior to what is shown in Figure 4, it is possible that both of the SEDs unique to Figure 5 show more active states in the γ-ray regime than what is shown in the April SED. In that case, the shift of the Compton peak to lower frequencies in the April SED would actually be expected. To be clear, this would not indicate an error in the work of D'Ammando et al., but would simply reflect the reality that the object must be somewhat active in order to be detected in the γ-rays at all; certainly the object was in a relatively inactive state when the quiescent SED was constructed when compared to the active SED.
In summary, J0849+5108 appears to have been in a quiescent state at the beginning of 2013 across the electromagnetic spectrum. This persisted until mid-April, at which time there was a sudden flaring event in the optical and γ-rays. The lower energy regimes experienced more gradual rises at this time, with the infrared showing a more abrupt rise in flux nearly one month later, and the radio band reaching historic flux levels after two months. This may indicate a true time lag between passbands, but such a conclusion cannot be firmly stated using only the data presented in this paper.
4. CONCLUSIONS
As proposed by Urry & Padovani (1995) and Padovani & Giommi (1995), blazars are typically divided into two classes based upon the location of the synchrotron peak of a given object's SED. Low energy peaked BL Lacertae objects (LBLs) are blazars with synchrotron peaks in the infrared regime. High energy peaked BL Lacertae objects (HBLs) are blazars that instead peak in the ultraviolet. The SED of J0849+5108 has previously been constructed by (D'Ammando et al. 2012), where it appears to show a synchrotron peak in the infrared, indicating that the object is most similar to an LBL. This agrees with what is found in Figure 4 of this paper. If the object is indeed blazar-like, then this statement suggests certain predictions about the optical behavior of the object that can be tested, as there are distinct observational differences between HBLs and LBLs in the optical regime.
On short (intra-night) timescales, HBLs show a distinct lack of any optical variations larger than 0.15 magnitudes (Miller & Noble 1996). In contrast, LBLs frequently display nightly optical variations of 0.2 mag or more, though low-amplitude events are still more common than larger ones. As seen in Figure 6, regardless of state, J0849+5108 is capable of nightly variations of over 0.3 mag, further indicating a more LBL-like nature.

Figure 6. Top: microvariability data from the night of the peak observed brightness during the April flare event on the night of greatest brightness (centered on JD = 2456401.7). Bottom: microvariability data taken in February, during a period of minimum observed brightness (centered on JD = 2456341.7). For ease of comparison, both light curves have been normalized to a 10 hour observing window and a half magnitude differential scale. Error bars are shown, but are typically comparable in size to the data points.
Download figure:
Standard image High-resolution image
The long-term behavior of the object also supports this conclusion. With only rare exceptions such as Markarian 421, HBLs appear to demonstrate a more limited range of optical variability when compared to LBLs (Campbell 2004). On the timescales of several years, HBLs have only shown a total range of 2 mag or less, whereas LBLs have been known to vary by as much as 5 mag or more. As mentioned in Section 3, J0849+5108 underwent a 4 mag increase in brightness across the 2013 observing session, well above what is typically demonstrated by HBLs. Therefore, over both short and long timescales, J0849+5108 appears to demonstrate the type of behavior that would be expected for a blazar with an SED similar to an LBL.
In Eggen et al. (2013), the doubling/halving timescale (τ) of J0948+0022 was found to be a remarkably rapid 3.99 ± 0.15 hr using the equation

where F(t) and F(t0) are the flux values at times t and t0. This determination was possible due to the large amplitude (0.75 mag or more on the most active nights), high cadence intra-night optical data available for that object. While the data for J0849+5108 are similarly well-sampled, the object unfortunately shows a maximum intra-night optical amplitude that is roughly half that of J0948+0022, though on longer timescales of months or years it is J0849+5108 that has the larger range. This means that no individual night showed enough activity to make a determination of τ. However, data from the large amplitude flare in 2013 April shown in Figure 3 do allow an upper limit of one to two days for the doubling/halving timescale to be made, which is in agreement with D'Ammando et al. (2013).
In addition, by observing a blazar-like object in an optically faint and an optically bright state, it is possible to distinguish the physical origin of any observed microvariability (Miller et al. 2011). This is because the existence of microvariability in blazars is typically explained as a result of physical processes occurring in either the accretion disk surrounding the central SMBH or in the relativistic jet. If microvariability occurs within the disk, it would presumably be caused by a multitude of relatively small, regional events such as hot spots or obscurations that all independently contribute to the total flux in an almost chaotic fashion (Mangalam & Witta 1993). In this case, the amplitude of any observed intra-night fractional variability would be expected to be state-dependent, as larger, long-term brightness increases are expected to be caused by events within the jet. Therefore, microvariability would be most prominent when a blazar is in an optically low state, and suppressed when in an optically bright state. If, on the other hand, both microvariability and long-term trends are caused by events in the relativistic jet, then the amplitude of the microvariability would scale with the object brightness and therefore be state-independent. As can be seen in Figure 6, the latter case is true for J0849+5108, indicating a jet origin of the observed microvariability.
As a final point, in blazers, the γ-ray and optical behavior that is reported in this paper is usually accompanied by the appearance of superluminal features in the parsec-scale jet (Marscher et al. 2010; Jorstad et al. 2013). This encourages monitoring of very-radio-loud NLSy1s such as J0849+5108 with the Very Long Baseline Array to aid in understanding the relationship between jet power and high energy production, as well as mechanisms for the origin of γ-rays in AGNs.
The authors acknowledge the staff at Lowell Observatory for the hard work and support that made this research possible. We also thank Svetlana Jorstad of the Institute for Astrophysical Research at Boston University for her helpful commentary and observations. This work was funded by the PEGA RPE grant at Georgia State University.