


ABSTRACT
We investigate the effects produced mainly by broadband soft X-rays up to 2 keV (plus fast (∼keV) photoelectrons and low-energy (∼eV) induced secondary electrons) in the ice mixtures containing H2O:CO2:NH3:SO2 (10:1:1:1) at two different temperatures (50 and 90 K). The experiments are an attempt to simulate the photochemical processes induced by energetic photons in SO2-containing ices present in cold environments in the ices surrounding young stellar objects (YSO) and in molecular clouds in the vicinity of star-forming regions, which are largely illuminated by soft X-rays. The measurements were performed using a high-vacuum portable chamber from the Laboratório de Astroquímica e Astrobiologia (LASA/UNIVAP) coupled to the spherical grating monochromator beamline at the Brazilian Synchrotron Light Source (LNLS) in Campinas, Brazil. In situ analyses were performed by a Fourier transform infrared spectrometer. Sample processing revealed the formation of several organic molecules, including nitriles, acids, and other compounds such as H2O2, H3O+, SO3, CO, and OCN−. The dissociation cross section of parental species was on the order of (2–7) × 10−18 cm2. The ice temperature does not seem to affect the stability of SO2 in the presence of X-rays. Formation cross sections of new species produced were also determined. Molecular half-lives at ices toward YSOs due to the presence of incoming soft X-rays were estimated. The low values obtained employing two different models of the radiation field of YSOs (TW Hydra and typical T-Tauri star) reinforce that soft X-rays are indeed a very efficient source of molecular dissociation in such environments.
Export citation and abstract BibTeX RIS
1. INTRODUCTION
The UV and X-rays produced by stars may induce chemical changes in the surrounding matter (circumstellar and interstellar gas, solid-phase molecules (icy grains), planets, and other orbiting bodies), enhancing the chemical complexity of these environments (e.g., Tielens & Hollenbach 1985; Maloney et al. 1996; Goicoechea et al. 2004; Henning & Semenov 2013, and references therein). Complex molecules have been detected by astronomical observations in such environments (e.g., Johnson & Quickenden 1997; Gibb et al. 2000, 2004; Boogert et al. 2008). In the case of newborn stars, also called young stellar objects (YSOs), the material falling toward the stars makes the emission of X-rays even more intense than in stars in the main sequence (e.g., Imanishi et al. 2002; Siebenmorgen & Krügel 2010). Such X-ray photons are capable of traversing large column densities of gas before being absorbed (Casanova et al. 1995; Koyama et al. 1996; Goicoechea et al. 2004; and Imanishi et al. 2001). The X-ray-dominated regions in the interface between the ionized gas and the self-shielded neutral layers that surround the YSOs could influence the selective heating of the molecular gas and ice grains. The complexity of these regions possibly allows a combination of different scenarios and excitation mechanisms to coexist.
As discussed by Schleicher et al. (2010 and references therein), X-rays have much smaller cross section than UV photons and can thus penetrate larger columns. Specifically, photons with energies around 1 keV penetrate a typical column of 2 × 1022 cm−2, a 10 keV photon penetrates 4 × 1025 cm−2, and high-energy photons (hard X-rays) with energies around 100 keV can penetrate a column density around 1 × 1029 cm−2. For comparison, a typical UV photon can penetrate roughly ∼1021 cm−2. Therefore, assuming that 2 keV X-rays (maximum photon energy employed in this work) can penetrate column densities up to NH < 1024 cm−2 (Cecchi-Pestellini et al. 2009) and considering the relation between visual extinction and hydrogen column density, AV (mag) = 0.5 × 10⁻²¹ NH (cm−2), or the relation between the reddening and hydrogen column density, E(B – V) (mag) = 0.15 × 10⁻²¹ NH (cm−2) (Güver & Özel 2009), the maximum penetration depth of such X-rays corresponds to Av ∼ 500 mag or E(B − V) ∼ 150 mag. In the scenario of YSOs, this large Av value indicates very dense regions deep in the protostelar disk.
The photochemical complexity increases as the energy of the incoming photons increases, which leads neutral molecules to excited states, radicals, and ions at higher energies. In addition, in the case of X-rays, the produced high-energy (∼keV) photoelectrons and low-energy (∼eV) induced secondary electrons also represent an extra source of molecular processing. The domain of each set of reactions depends on the absorption cross section of each molecule involved. For example, as discussed by Pilling et al. (2009), in the case of ices containing CH4 and N2, the photochemical regime below 9 eV is governed by neutral–neutral or exited-neutral processes; for energies between approximately 10 and 14 eV, the chemical pathway involves neutral–radical as well as radical–radical; and for photon energies higher than ∼15 eV, the reaction involving ionic species dominates the photochemistry, which also increases the reaction rates due to the decrease of the activation barrier of the reaction routes.
Laboratory works have been performed in an attempt to simulate these chemical processing in astrophysical ices (or/and gas) employing different ionizing sources and analytical techniques (e.g., Gerakines et al. 2001; Boechat-Roberty et al. 2005, 2009; Bernstein et al. 2004; Pilling et al. 2006, 2007b, 2007a, 2009, 2011a, 2011b; Andrade et al. 2009; Ciaravela et al. 2010; Fantuzzi et al. 2011; Jimenez-Escobar et al. 2012; Chen et al. 2013). Recently, radiative-transfer models containing laboratory data of processed ices in the infrared (bombarded by cosmic ray analog) were employed with success to simulate the energy spectral distribution (SED) as well as the images, in different wavelengths, of the YSO Elias 29 (Rocha & Pilling 2015). The results obtained by the authors corroborate the idea of chemical changes being induced by interaction between ices (as well as gas) with incoming ionizing radiation in such astrophysical environments. However, considering that the molecular abundances of astrophysical ices can largely vary from object to object (e.g., Gibb et al. 2004), and only the most abundant species are well quantified in space, laboratory simulations of such ices always present a small point of view of the entire cosmological picture. For a detailed review of astrophysical ices, see Boogert et al. (2015).
In this paper, we experimentally investigate, for the first time, the effects of ionizing broadband photons from 6 to 2000 eV (mostly soft X-rays and their induced fast (∼keV) photoelectrons and slow (∼eV) secondary electrons) in an ice mixture made of H2O:CO2:NH3:SO2 at two different temperatures (50 and 90 K), which roughly simulates the physicochemical composition of some astrophysical ices. The current experiment is an attempt to simulate the photochemical processes induced by energetic photons in the SO2-containing ices that are largely illuminated by soft X-rays around YSOs (e.g., Koyama et al. 1996).
As discussed before, the current investigation also simulates the effects of high-energy photoelectrons (∼keV) and low-energy secondary electrons (∼eV) induced by soft X-rays photons in such astrophysical ices. This cannot be investigated when only UV lamps are used as the ionizing source. The employed instrumentation in this work is first reported here and will be subsidized in future experimental works.
2. EXPERIMENTAL SETUP
In an attempt to simulate the photochemical process triggered mainly by soft X-rays photons (broadband) on the SO2-containing ices present in astrophysical environments, we used the facilities of the Brazilian Synchrotron Light Laboratory (LNLS) located in Campinas, Brazil. The experiments were performed using a high-vacuum portable chamber from the Laboratório de Astroquímica e Astrobiologia (LASA/UNIVAP) coupled to the spherical grating monochromator (SGM) beamline, which was operated in the off-focus and white beam mode, producing a wide spectral range of ionizing photons (mainly from 6 eV up to 2000 eV). The beamline details can be found elsewhere (Castro et al. 1997; Rodrigues et al. 1998). A gas mixture containing roughly 76% H2O, 8% CO2, 8% NH3, and 8% SO2 was produced in a mixture chamber coupled to the experimental chamber. Two different sample temperatures were investigated (50 and 90 K).
To better identify and quantify the new species produced during the sample processing involving the minor parental species present in the simulated ices, the amount of water in the samples was reduced roughly by a faction of 10 when compared with astrophysical ices. Such reduction does not change the physical chemical process among the reagents because the water remains as a matrix for the other species. A description of the experiments is as follows: first, the gaseous mixture (roughly 10 mbar) was slowly deposited into a polished ZnSe substrate (a dish with an effective area of 28.3 mm2), previously cooled to 14 K by a helium closed cycle cryostat (ARS Inc., model CS204AB-450) inside a portable and high-vacuum chamber (called the "Stark" chamber). The gas mixture was deposited though a capillary stainless tube, with the exit located a few millimeters from the target for around 20 minutes at a background pressure in the main chamber of 2 × 10⁻⁷ mbar. After deposition, the sample holder was slowly heated at a 2 K minute−1 ramp up to the irradiation temperatures. Details of the analogue samples simulated in this work are shown in Table 1.
Table 1. Sample Characteristics
| Label | Sample Composition | Temperature During the Sample Dosing (K) | Temperature During the Irradiation (K) | Initial Column Density for H2O, CO2, NH3, SO2, respectively. (1018 molecules cm−2)a | Initial Number of Monolayes (L)b | Initial Thickness (μm)c |
|---|---|---|---|---|---|---|
| E50K | H2O:CO2:NH3:SO2 (10:1.4:1.4:1.9) | 13 K | 50 K | 3.5, 0.5, 0.5, and 0.6 | 5200 | 1.8 |
| E90K | H2O:CO2:NH3:SO2 (10:2.4:2.3:1.7) | 13 K | 90 K | 2.5, 0.6, 0.6, and 0.7 | 4400 | 1.5 |
Notes.
aEmploying the methodology described in Pilling et al. (2010a). Using the H2O band at 800 cm−1 with a band strength of 2.8 × 10⁻¹⁷ cm molecule−1 (d'Hendecourt & Allamandola 1986); using the CO2 band at 2341 cm−1 with a band strength of 7.6 × 10⁻¹⁷ cm molecule−1 (Gerakines et al. 1995); using the NH3 band at 1100 cm−1 with a band strength of 1.2 × 10⁻¹⁷ cm molecule−1 (Kerkhof et al. 1999); using the SO2 band at 1329 cm−1 with a band strength of 3.7 × 10⁻¹⁷ cm molecule−1 (Garozzo et al. 2008). The molecular ratio was calculated before any irradiation and employing column densities at the sample temperatures of 50 K and 90 K, respectively. bConsidering the Langmuir unit (1 L = 10−6 Torr s ∼ 1015 molecules cm−2) and the summed molecular column densities in the ices in the beginning of each experiment. cEmploying the methodology described in Pilling et al. (2011a, 2011b and 2011c) with a density of 1.0 g cm−3.Download table as: ASCIITypeset image
Table 2. Absorption Features Observed in the Infrared Spectra of Simulated Ices
| Wavenumber (cm−1) | Wavelength (μm) | Molecule (Vibration Mode)a | E50K | E90K | Notes and Reference |
|---|---|---|---|---|---|
| 3610 (b) | 2.77 | OHdb | unirradiated (w) | unirradiated | Pilling et al. (2010a) |
| 3365 | 2.97 | NH3 | unirradiated | unirradiated | Pilling et al. (2010a) |
| 3226 | 3.10 | ? | residue (300 K) | residue (300 K) | ⋯ |
| 3062 (b) | 3.27 | ? | residue (300 K) | residue (300 K) | ⋯ |
| 2935 (w) | 3.41 | R-CHx? | ⋯ | irradiated | ⋯ |
| 2890 (w) | 3.46 | H2O2 | irradiated | irradiated | Pilling et al. (2010a), Pilling et al. (2010b) |
| 2868 | 3.49 | ? | ⋯ | residue (300 K) | ⋯ |
| 2857 | 3.50 | ? | residue (300 K) | ⋯ | ⋯ |
| 2466 | 4.06 | SO2 (v1+ v3) | unirradiated | unirradiated | Khanna et al. (1988) |
| 2343 (s) | 4.27 | CO2 | unirradiated | unirradiated | Pilling et al. (2010a) |
| 2280 (w) | 4.39 | 13CO2 | unirradiated | unirradiated | ⋯ |
| 2166 | 4.62 | OCN− | ⋯ | Irradiated residue (180 K) | Pilling et al. (2010a) |
| 2140 | 4.67 | CO | irradiated | irradiated | ⋯ |
| 2045 (w) | 4.89 | CO3 | irradiated | ⋯ | Jacox & Milligan (1971) |
| 1720 (b) | 5.81 | H3O+ | irradiated | Irradiated residue (180K and 300 K) | Moore et al. (2007) |
| 1645 (b) | 6.08 | H2O | unirradiated | unirradiated | ⋯ |
| 1552 | 6.44 | ? RCOO− (carboxylate ion); zwiterionic amino acid ? | residue (170K ) | unirradiated (90 K) residue (180 K) | Shimanouchi (1972) |
| 1493 | 6.70 | ? | ⋯ | unirradiated (90 K) | ⋯ |
| 1470 (b) | 6.80 | ? | irradiated | irradiated | |
| 1447 (b) | 6.91 | ? | ⋯ | residue (180 K) | ⋯ |
| 1422 (b) | 7.03 | ? | residue (300 K) | residue (300 K) | ⋯ |
| 1396 (d) | 7.16 | SO3(v3) | irradiated | unirradiated (90 K) | Schriver-Mazzuoli et al. (2003b) |
| 1330 (s) | 7.52 | SO2 (v3) | unirradiated | unirradiated | Khanna et al. (1988) |
| 1338 | 7.47 | ? | ⋯ | Residue (180 K) | ⋯ |
| 1294 | 7.73 | ? | Residue (300 K) | ⋯ | ⋯ |
| 1255 | 7.97 | ? | Residue (170 K) | ⋯ | ⋯ |
| 1235 (b) | 8.10 |
 ; ; 
|
⋯ | irradiated | Moore et al. (2007) |
| 1224 | 8.17 | H2SO4 | Residue (300 K) | Residue (300 K) | Moore et al. (2007) |
| 1215 | 8.23 | SO3 (poly) ? | irradiated | Irradiated Residue (180 K) | Moore (1984) |
| 1186 (b) | 8.43 | H2SO3 | ⋯ | Residue (300 K) | Garozzo et al. (2008) |
| 1169 | 8.55 | ? | Residue (300 K) | ⋯ | ⋯ |
| 1151 (s) | 8.69 | SO2 (v1) | unirradiated | unirradiated | Khanna et al. (1988) |
| 1116 | 8.96 | ? | ⋯ | residue (300 K) | ⋯ |
| 1104 | 9.06 |
 (Sulfate); Hydrated H2SO4 ? (Sulfate); Hydrated H2SO4 ? |
irradiated | irradiated | Moore et al. (2007), Strazzulla (2011) |
| 1103 | 9.07 | NH3 | unirradiated | unirradiated | ⋯ |
| 1101 | 9.08 | Hydrated H2SO4 ? | residue (300 K) | ⋯ | Strazzulla (2011) |
| 1080 | 9.26 |

|
residue (170 K) | residue (180 K) | Zhang et al. (1993), Loeffler & Hudson (2013). |
| 1060 | 9.43 | SO3 (v1) | residue (300 K) | ⋯ | Moore (1984), Loeffler & Hudson (2013), Garozzo et al. (2008). |
| 1052 | 9.51 | ? O3;  ; H2SO3 ; H2SO3 |
irradiated | irradiated | Moore et al. (2007), Garozzo et al. (2008) |
| 1036 | 9.65 | ? O3;  (bisulfite) (bisulfite) |
Irradiated residue (300 K) | unirradiated (90 K) Irradiated | Moore et al. (2007) |
| 1029 | 9.72 | ? O3; H2SO3 | residue (300 K) | residue (300 K) | Schriver-Mazzuoli et al. (2003b), Garozzo et al. (2008). |
| 1011 | 9.89 | ? | ⋯ | unirradiated (90 K) | ⋯ |
| 980 | 10.20 |
 (Sulfate) (Sulfate) |
irradiated | irradiated | Moore et al. (2007) |
| 957 | 10.45 | H2SO4 ; 
|
⋯ | unirradiated (90 K) | Moore et al. (2007), Loeffler & Hudson (2013). |
| 895(b) | 11.17 | ? | irradiated | irradiated | ⋯ |
| 880(b) | 11.36 | ? H2SO4 | residue (170 and 300 K) | residue (180 and 300 K) | Moore et al. (2007) |
| 826(b) | 12.11 | SO3 (poly) ? | ⋯ | unirradiated (90 K) irradiated | Moore (1984) |
| 780 (b) | 12.82 | H2O | unirradiated | unirradiated residue (180 K) | Pilling et al. (2010a), Pilling et al. (2010b) |
| 658 | 15.20 | CO2 | unirradiated | unirradiated | Pilling et al. (2010a), Pilling et al. (2010b) |
Notes. b-broad, n-narrow, w-weak, s-strong, d-doublet.
a? = unidentified molecular assignment.Table 3. Dissociation Cross Sections and Dissociation Rate for Parental Species in Studied Ices Irradiated by Photons with Energies from 6 to 2000 eV (Mostly Soft X-Rays)
| E50K | E90K | |||||
|---|---|---|---|---|---|---|
| σd (cm2) | klab (s−1) | t1/2 (lab)a | σd (cm2) | klab (s−1) | t1/2 (lab)a | |
| (103 s) | (103 s) | |||||
| H2Ob | 3.0 × 10⁻¹⁸ | 3 × 10⁻⁴ | 2.3 | 7.0 × 10⁻¹⁸ | 7.0 × 10⁻⁴ | 0.9 |
| CO2 | 2.2 × 10⁻¹⁸ | 2.2 × 10⁻⁴ | 3.1 | 3.0 × 10⁻¹⁸ | 3.0 × 10⁻⁴ | 2.3 |
| NH3 | ∼6 × 10⁻¹⁸ | ∼6 × 10⁻⁴ | ∼1 | ∼2 × 10⁻¹⁸ | ∼2 × 10⁻⁴ | ∼3 |
| SO2 | 4.3 × 10⁻¹⁸ | 4.3 × 10⁻⁴ | 1.6 | 4.0 × 10⁻¹⁸ | 4.0 × 10⁻⁴ | 1.7 |
Notes. Half-life obtained in the lab is also given. The uncertainty was estimated to be around 20%.
aConsidering the half-life t1/2 = ln(2)/k, where k is the photodissociation rate in units of s−1 (see Table 3). bFor OHdb band the destruction cross sections are 5 × 10⁻¹⁸ cm2 and 8 × 10⁻¹⁸ cm2 for E50K and E90K experiments, respectively.Download table as: ASCIITypeset image
The atmosphere inside the chamber was monitored by a quadrupole mass analyzer (MKS Inc., model e-Vision 2). The pressure inside the vacuum chamber during the irradiation was below 3 × 10⁻⁸ mbar, which allows a small fraction of residual gas (mainly H2O and CO2) over the sample. Considering the abundance of 1% of such compounds in the air, a unit-sticking probability (i.e., S = 1) for both species, the layering occurring in both sides of the ZnSe crystal, and the Langmuir unit (1 torr s = 10−15 molecules cm−2 = 1 L = one monolayer), the estimated maximum value for the residual gas layering during roughly 700 minutes (initial heating + irradiation + data acquisition stages) on the side that contained the ice sample was about ∼5 × 10⁻¹⁵ molecules cm−2 = 5 L. This value is about three orders of magnitude lower than the initial ice thickness given in terms of monolayers (4–5 kL).
In situ chemical analyses of the samples were performed by a portable Fourier transform infrared (FTIR) spectrometer (Agilent Inc., model Cary 630) coupled to the experimental chamber. The spectra were taken from 4000 to 600 cm−1 with resolution of 2 cm−1.
Figure 1(a) presents a diagram of the experimental setup. A picture of the experimental hall of the Brazilian synchrotron light source (LNLS) with the Stark chamber coupled to the SGM beamline (arrow) is seen in Figure 1(b). Figure 1(c) shows, in detail, the frozen sample inside the Stark chamber ready to be irradiated by synchrotron light. The infrared (IR) beam from the FTIR and the synchrotron beam intercepted the sample perpendicularly, as illustrated in Figure 1(c). The infrared transmission spectra were obtained by rotating the substrate/sample by 90° after each radiation dose and at selected temperatures during the heating stages. Infrared spectra of non-irradiated (pristine) samples taken at the beginning and at the end of the experiments were compared.

Figure 1. (a) Diagram of the experimental setup (Stark chamber). (b) Illustration of the experimental hall of the Brazilian synchrotron source (LNLS) with the experimental chamber coupled at the SGM beamline (arrow). (c) Illustration showing the frozen sample inside the chamber and ready to be irradiated by synchrotron light. See details in the text.
Download figure:
Standard image High-resolution imageTable 1 lists the key physicochemical parameters of the ices studied. The initial column density and thickness of the samples were determined by employing the methodology described in Pilling et al. (2011a, 2011b, 2011c). The band strengths of H2O, CO2, NH3, and SO2 were taken from d'Hendecourt & Allamandola (1986), Gerakines et al. (1995), Kerkhof et al. (1999), and Garozzo et al. (2008), respectively. The initial sample thicknesses were between 1.5 and 1.8 μm. These values were estimated by measuring the area of the parent species in the IR spectra and adopting a sample density of 1.0 g cm−3.
2.1. Photon Flux
In this work, we simulate the concomitant effects of ionizing photons from vacuum ultraviolet (VUV) up to the soft X-ray range (the dominant component). In terms of energy, it corresponds to a scope from 6 eV to 2 keV. Although photons with low energy (including near-IR) reach the sample, only photons with energies higher than 6 eV promote significant changes such as photodesorption, photoexcitation, photoionization, and photodissociation processes in the ice (e.g., Orlando & Kimmel 1997; Pilling et al. 2008), and are even more intense for the soft X-ray component (>100 eV). The broadband photon energy distribution (white beam mode) was obtained by placing the monochromator at the zeroth order of reflection (the grating acts like an ordinary mirror and the white light exits from the monochromator).
Figure 2 presents the photon flux of the SGM beamline as a function of photon energy (for the current of 200 mA and off-focus mode). The black squares are the measured values for the photon flux inside the experimental chamber in a monochromatic beam configuration. The red line is the model for the transmission of the SGM beam after passing through all optical elements using the SHADOWUII code. For comparison, four other photon fluxes are presented: (i) non-attenuated photons from a T-Tauri star at 1 AU—model 1 (adapted from the model of Siebenmorgen & Krügel 2010); (ii) estimated photon flux around the young star TW Hydra at 40 AU—model 2 (adapted from Fantuzzi et al. 2011); (iii) solar flux at 1 AU (Gueymard 2004) and at (iv) 5.2 AU (adapted from Gueymard 2004). The inset figure is the Chandra ACIS-I observation of the T-Tauri star ROXs 21 at a photon energy from 0.5 to 7 keV (adapted from Imanishi et al. 2002), which indicates that soft X-rays are present in such objects. This figure illustrates that the SGM beamline is more related to the radiation distribution of YSOs than with stars in main sequence like the Sun because the X-ray component produced by the falling material in the protostars is larger. In addition, the radiation distribution of YSOs in the soft X-ray range, as shown by the observation of T-Tauri stars (e.g., Imanishi et al. 2002), has a maximum around 1 keV, which is very similar to the radiation profile of the employed synchrotron beamline. Although the y-axis units of the inset (observed spectrum) are different from those in the main figure, we superimposed the inset over the model of T-Tauri-type stars at 1 AU, respecting the x-axis, and assuming a correlation in the y-axis at around 1 keV. In this figure we can also identify the different domains of ionizing photons in terms of energy (e.g., UV from ∼3.3 to 6 eV; VUV form 6 to 100 eV; soft X-rays >100 eV).

Figure 2. (a) Photon flux of the SGM beamline as a function of photon energy (for the current of 200 mA and off-focus mode). Black squares are the measured values for the photon flux inside the experimental chamber in a monochromatic beam configuration. The red line is the model for the transmission of the SGM beam after passing through all optical elements using the SHADOWUII code. For comparison, four other photon fluxes are presented: (i) non-attenuated photons from the T-Tauri star at 1 AU (adapted from the model of Siebenmorgen & Krügel 2010); (ii) estimated photon flux around the young star TW Hydra at 40 (adapted from Fantuzzi et al. 2011); (iii) solar flux at 1 AU and at (iv) 5.2 AU (adapted from Gueymard 2004). The inset figure is the Chandra ACIS-I observation of the T-Tauri star ROXs 21 at a photon energy from 0.5 to 7 keV (adapted from Imanishi et al. 2002). See details in the text.
Download figure:
Standard image High-resolution imageThe beamline entrance and exit slit were completely opened (L = 620 μm) during the experiments to allow the maximum intensity of the beamline. This implies energy steps of roughly 0.1 eV for the incoming photons in the sample. In an attempt to increase the beam spot at the sample, the experimental chamber was placed about 1.5 m away from the beamline focus (off-focus mode). With this procedure, the measured beam spot (rectangular) at the sample was about 0.5–0.6 cm2. In addition, because the beamline was operated in the off-focus mode and the beamline slits were at maximum aperture, the homogeneity of photon flux inside this rectangular spot may be affected.
The integrated photon flux in the sample, corresponding mainly to photons from 6 eV to 2 keV, was 1.4 × 10¹⁴ photons cm−2 s−1, and the integrated energy flux was roughly 7.6 × 10⁴ erg cm−2 s−1. For comparison, the integrated photon flux at the sample in the VUV range (6–100 eV) was estimated as roughly 4 × 10⁻¹³ photons cm−2 s−1, and the integrated energy flux in this wavelength range was roughly 3 × 10³ erg cm−2 s−1. In the soft X-ray range (∼0.1–2 keV), this flux was about 1 × 10¹⁴ photons cm−2 s−1, and the integrated energy flux in this wavelength range was roughly 7 × 10⁴ erg cm−2 s−1. The determination of the photon flux at the sample was done with the following procedure: (i) measurement of the photon flux at selected energies (with bandpass of ΔE = 0.1 eV) in the soft X-rays by a photosensitive diode (AXUV-100, IRD Inc.) coupled to the experimental chamber (black squares in Figure 2); (ii) scaling the theoretical beamline transmission flux, obtained by employing the XOP/SHADOWVUI ray-tracing code software (see http://www.esrf.eu/computing/scientific/xop2.0), using the measured photon flux at these specific photon energies. Absorption around 290 eV was due to contamination with carbonaceous molecules in the last mirror of the beamline. In the current experiments, we assume an average photon energy of ∼1 keV, which gives the penetration depth up to L ∼ 2 μm, considering the soft X-ray mass absorption coefficients for water (liquid phase) of μ ∼ 4.1 × 103 cm2 g−1 taken from NIST database (see http://physics.nist.gov/PhysRefData/XrayMassCoef/) and an average sample density of 1 g cm−3. The average penetration depth L of the employed ionizing photons was derived from the relation L = 1/μρ, where μ is the mass absorption coefficient (determined mainly by atomic absorption cross sections) and ρ is the density of the material (e.g., Gullikson & Henke 1989).
In this work, we focus on the astrophysical implications of the effects of the soft X-ray component of ionizing photons in the ices in the vicinity of YSOs. Here, only the radiation coming from the host star is considered; therefore, neither the effects of UV and X-rays coming from the interstellar environment nor those originating from the interaction between cosmic rays and matter were considered. To take into account the fluctuation of the photon flux as a result of the natural energy loss (evolving currents from 250 to 130 mA) of the electrons that generate the synchrotron light and also their orbit corrections during the irradiations, in this paper we adopt an average integrated photon flux from 6 eV to 2 keV, of about 1 × 10¹⁴ photons cm−2 s−1, with an average energy flux of 6 × 10⁴ erg cm−2 s−1 = 3.7 × 10¹⁶ eV cm−2 s−1. This procedure introduces an estimated error of less than 20% influence determination of each collected IR spectrum.
Fewer X-ray irradiation experiments on astrophysical ices have been published compared with other ionizing sources such as UV, fast ions, and electrons. The previous experiments performed by our group showed that X-rays promote efficient destruction rates (with cross section measurements) in astrophysical samples at both gas and solid phases (Boechat-Roberty et al. 2005, 2009; Pilling et al. 2006, 2007b, 2007a, 2009, 2011a, 2011b; Andrade et al. 2009; Fantuzzi et al. 2011). Jimenez-Escobar et al. (2012) measured the physicochemical changes induced by soft X-rays (0.3 keV) over pure H2S ice at 8 K. Although no cross sections were determined, the authors observed the appearance of H2S2 during the photolysis and also discussed the importance of X-rays on the processing of astrophysical ices outside and inside the solar system. An overview about the employment of soft X-rays in experimental astrochemistry is presented by Pilling & Andrade (2012).
2.2. Soft X-Ray-induced Photoelectron and Secondary Electrons
In general, as discussed by Gullikson & Henke (1989), X-ray absorption occurs via the photoelectric effect so that it results in the generation of a photoelectron with energy E = hν−Eb, where hν is the soft X-ray photon energy (in this work 100 < hν (eV) < 2000) and Eb is the binning energy of the electron. Electron binding energy is a generic term for the ionization energy that can be used for species with any charge state. For the studied compounds, the highest electron binding energy within the available photon energy range is found for O K-edge electrons (∼540 eV), followed by N K-edge electrons (∼400 eV), C K-edge electrons (∼290 eV), and S L-edge electrons (∼160 eV). The weakest electron binding energies come from the valence electrons of NH3 (∼10 eV), followed by valence electrons of SO2 (∼12.3 eV), H2O (12.6 eV), and CO2 (∼13.7 eV). The values above were taken from the NIST gas phase ion energetics database (see http://webbook.nist.gov/chemistry/). The fastest photoelectrons produced by the most energetic incoming X-ray in the sample have kinetic energyies around 1990 eV (e.g., photoelectron form single ionization of ammonia).
The effect of soft X-ray-induced secondary electrons has been studied by several groups in the literature (e.g., Henke et al. 1979; Gullikson & Henke 1989; Akkerman et al. 1993; Hüfner 1995; Cazaux 2006; Pilling et al. 2009; Pilling & Andrade 2012) and is a rather complex process. As pointed out by Gullikson & Henke (1989), a simplified description can be divided into four steps.
- i.First, photoabsorption of X-ray and the generation of energetic primary electrons (see above). Such fast primary electrons lose energy by creating electron hole (e–h) pairs at a distance that is generally short compared with the penetration depth L of the incoming photon (in this work we are considering L ∼ 2 μm). Following Opal et al. (1972), the practical range of fast photoelectrons is related to its energy by E1.9. The relation between the energies of primary photoelectron and the energy of subsequent secondary electron for the parental species employed in this work (in gas phase only) is given elsewhere (Opal et al. 1972). From Monte Carlo simulations performed employing the CASINO code (see http://www.gel.usherbrooke.ca/casino/index.html), the range of 1 keV electrons is around 60 nm inside such astrophysical analog samples (Bergantini et al. 2014). For low-energy electrons (∼5 eV), the mean-free path inside such ices is around 1–2 nm.
- ii.Excitation of secondary electrons by fast primary electrons (photoelectrons). Once a secondary electron is created, it will undergo a short random walk in the material while losing energy due to the creation of phonons (e.g., Gullikson & Henke 1989). Moreover, following Gullikson & Henke (1989), each soft X-ray may induce tens of secondary electrons inside matter, and this number increases as the temperature of the target increases. The mechanism involved in the generation of the secondary electrons results from the absorption of X-ray photons, the photoelectric effect, followed by the creation of energetic photo- and Auger electrons that generate a large number of low-energy secondary electrons. For a low atomic number, the fluxes of those secondary electrons inside matter can be considered as high as the incident X-rays. Although for some Auger processes (e.g., satellite Auger) and shake up processes, in which more than one electron can be ejected from the irradiated species, the flux can be even higher than the incident photon flux (see also Ramaker et al. 1988; Hüfner 1995; Almeida et al. 2014).
- iii.Transport of the secondary electrons, including energy, to the lattice. Following Henke et al. (1979), most secondary electrons have energies below 5 eV. When captured by a molecular target inside the bulk, such electrons can induce further molecular dissociating, for example, via the dissociative electron attachment mechanism (AB + e− → AB− → A− + B). The mean-free path of such secondary electrons is much reduced in comparison with photoelectrons, and its yield can vary depending on the sample density and temperature. Gullikson & Henke (1989) experimentally demonstrated by employing soft X-rays (1487 eV) in Xe ices at very low temperatures that the mean-free path, escape depth, and secondary electron yields increase with the sample temperature.
- iv.Escape of secondary electrons reaching the surface with sufficient energy to overcome any potential barrier at the surface or be thermalyzed/captured by any molecular species or center in the bulk. In astrophysical water-rich ices (insulators), a secondary electron will undergo many collisions before it either escapes through the surface or loses enough energy so that it is unable to escape or becomes trapped by interacting with a center in the bulk.
In the case of ices at the protostellar disk of YSO, the major component of incoming electrons has energies around keV and they are mostly produced from secondary processes during the direct impact of cosmic rays matter (e.g., Bennett & Kaiser 2007). Following Kaiser (2002 and references therein), collisional cascade calculations demonstrate that each high-energy (MeV) cosmic ray particle can penetrate the entire astrophysical icy grain and induce cascades, generating up to hundreds of suprathermal particles such as these secondary electrons.
The employment of soft X-rays to simulate the processing of astrophysical ices by radiation in comparison with similar bombardment experiments using fast electrons or cosmic ray analogs also helps us to understand the effects of the secondary electrons inside matter. The production of secondary electrons is negligible when just UV or visible light is considered. Therefore, the produced energetic photoelectrons and low-energy secondary electrons discussed in this work will contribute to an increase in the chemical complexly (and its yields) of the irradiated samples and should be considered as an alternative source of electron-driven processes in such astrophysical ices.
Chen et al. (2013) and Ciaravela et al. (2010), in another set of experiments employing soft X-rays in astrophysical-related ices, have also pointed out the importance of secondary electrons, whose energy distribution depends on the energy of incoming soft X-ray photons, in the production of new species in the ice. The authors irradiated frozen methanol with 0.3 and 0.55 keV photons and observed the production of H2CO due to chemical changing of ice triggered by incoming radiation.
3. RESULTS
As discussed before, the frozen samples were prepared at 13 K and were slowly heated (2 K minute−1) to the temperature of irradiation phase (50 and 90 K). We observe some chemical differentiation in the sample for temperatures around 80 K. This physicochemical behavior is discussed in the
3.1. Irradiation Phase and Reaction Routes during Ice Processing
The evolution of the infrared spectrum at 50 K during the irradiation phase is shown in Figures 3(a) and (b) (expanded view). The bottom spectrum shows the unirradiated ice, and the uppermost spectrum was obtained at the highest photon fluence. Each spectrum has an offset for better visualization. Several new species, such as CO, H3O+, SO3, HSO3,  and
and  were identified during the photolysis. The CO3 molecule (2045 cm−1) was also formed, but it is not easily visible due to its low abundance. This species was also identified in a similar irradiation and photolysis experiment of other SO2-rich surface analogs, as discussed by Jacox & Milligan (1971). Table 2 lists the major absorption features observed in the infrared spectra of simulated astrophysical ices in this study (unirradiated sample, during the heating phase, during the irradiation phase, and in the residue at 300 K), with molecular attributions and comments.
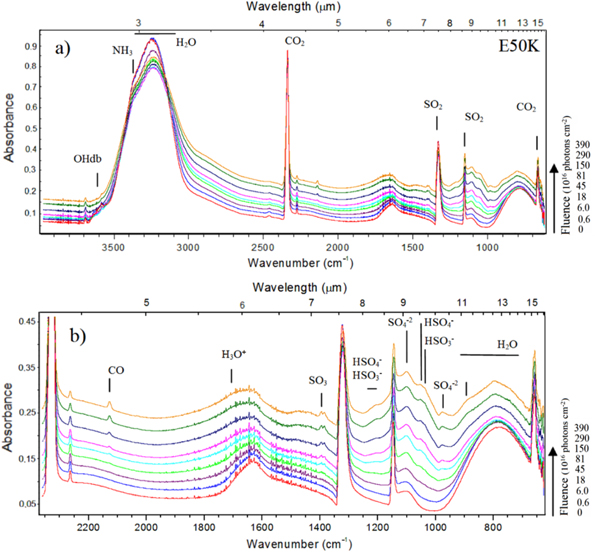
Figure 3. (a) Infrared spectrum of the frozen sample at 50 K during the isothermal irradiation, employing photons from 6 to 2000 eV (mainly soft X-rays) at different photon fluences. The bottom spectrum is the unirradiated ice, and the uppermost spectrum is the one obtained at the highest fluence. (b) Expanded view from 2380 to 610 cm−1. Each spectrum has an offset for better visualization.
Download figure:
Standard image High-resolution imageFigures 4(a) and (b) (expanded view) present the changes in the infrared spectrum of the sample irradiated at 90 K. In each figure, the bottom spectrum is the unirradiated ice and the uppermost spectrum is the one obtained at the highest photon fluence (3.6 × 10⁸ photons cm−2). Each spectrum has an offset for better visualization. The spectrum at higher photon fluences shows the formation of the cyanate ion, OCN− (2160 cm−1), which was virtually not observed in the E50K experiment. Considering the band strength of 4.0 × 10⁻¹⁷ cm molecule−1 (d'Hendecourt & Allamandola 1986), the column density for the produced OCN−, at the fluence of 3.6 × 10⁸ photons cm−2, was about 1.8 × 1016 cm−2. The clear observation of this species in the warm sample suggests that its reaction rate may mostly depend on temperature. This temperature effect on the production of OCN− was also observed in the soft X-ray irradiation of another ice mixture H2O:NH3:CO:CH4 (10:1:1:1) at two temperatures (20 and 80 K) and will be reported in a future publication (A. Bergantini & S. Pilling 2015, in preparation).

Figure 4. (a) Evolution of the infrared spectrum of the simulated samples at 90 K during the irradiation phase employing photons from 6 to 2000 eV (mostly soft X-rays). The bottom spectrum is the unirradiated ice, and the uppermost spectrum is the one obtained at the highest photon fluence. (b) Expanded view from 2380 to 610 cm−1. Each spectrum has an offset for better visualization. See details in the text.
Download figure:
Standard image High-resolution imageFor the daughter species CO (2140 cm−1) at this same fluence, the determined column density was about 1.2 × 1016 cm−2 considering the band strength of 1.1 × 10⁻¹⁷ (Gerakines et al. 1995). The doublet line of SO3 (1396 cm−1; Schriver-Mazzuoli et al. 2003b), observed in the experiment E50K, was not clearly observed in this case. The decreasing of the OHdb band at around 3610 cm−1 with the fluence is another feature observed in this figure. This effect is analogous to the compaction of amorphous ices during bombardment with fast ions (see also Palumbo 2006; Baragiola et al. 2008, and Pilling et al. 2010a). However, because the energy and momentum delivered by the impinging photons are small, we suggest that the decrease of the OHdb with the photon fluence is ruled by the dissociation (via X-rays and/or induced electrons) of dangling water inside micropores (see also Gullikson & Henke 1989; Bergantini et al. 2014; Pilling et al. 2014). Further experiments will help to clarify this issue.
Figure 5(a) presents a comparison between selected infrared spectra of two studies ices. The upper spectra set shows the results for the experiments performed at 90 K and bottom spectra set shows the results of the experiments at 50 K. The labels in each spectrum indicate: (a) deposited sample at 13 K, (b) sample after slowly heating (2 K minute−1) up to the irradiation temperature (50 or 90 K), and (c) after irradiation up to the fluence of 3.9 × 10¹⁸ photons cm−2 (for E50 K) and 3.6 × 10¹⁸ photons cm−2 (for E90 K). Figure 5(b) shows an expanded view of the 2380–610 cm−1 region in the infrared spectrum. Vertical lines indicate the bands that appear exclusively in the 90 K experiment. As discussed before, the production of OCN−, observed by the 2160 cm−1 infrared band, seems to be considerably enhanced in the sample irradiated at 90 K. The irradiation of the 90 K sample also caused high destruction (or sublimation) of the trapped CO2.

Figure 5. (a) Comparison between the experiments at 50 K (bottom spectra set) and 90 K (upper spectra set). The labels in each spectrum indicate: (a) deposited sample at 13 K, (b) sample after slowly heating (2 K minute−1) up to the temperature of the irradiation (50 or 90 K), (c) after irradiation up to the fluence of 3.9 × 10¹⁸ photons cm−2 (for 50 K) and 3.6 × 10⁻¹⁸ photons cm−2 (for 90 K). Figure (b) shows an expanded view from 2380 to 610 cm−1. Vertical lines indicate the bands that only appear in the experiment at 90K.
Download figure:
Standard image High-resolution imageThe dissociation of the parental species by ionizing photons with energies within the 6 eV–2000 eV range (mostly soft X-rays) may occur following several reaction routes, which may involve double dissociation or even triple dissociation, as well as neutral and ionic species (e.g., see the discussion in Pilling et al. 2007c; Andrade et al. 2008). Some daughter species produced due to the interaction of ionizing photons with parental species in the ice samples are listed in the reactions below (asterisks indicate excited states; only neutral species are listed):
Depending on the photon energy involved, some of the daughter species (neutral molecules, ions, or radicals) may diffuse inside the frozen sample and react with other species. As discussed by Loerting & Liedl (2000 and references therein), the formation of SO3 from sulfur dioxide is highly enhanced in the presence of oxidant species such as hydroxyl (OH) and O2, as illustrated by the reaction:

In the presence of water, the production of sulfurous acid (H2SO3) or sulfates ( ) is obtained by the reversible reaction:

However, as discussed by Strazzulla (2011), to obtain a high yield of sulfurous acid in such reaction, the water concentration must not be greater than that of SO2, otherwise the exceeding water would destroy the produced H2SO3, again yielding the SO3 molecule. Another produced species observed is the bisulfite ion (or hydrogen sulfite)  which can be produced directly from SO2 in the presence of frozen water molecules during a thermal heating process by the reaction:

During thermal heating or during the irradiation of the sample, the sulfite ion  which is the conjugate base of the bisulfite ion, can be produced by the reaction:

Because all sulfites (including bissulfite) and sulfur dioxide, which contains sulfur in the same oxidation state (+4), are reducing agents, they react with the free hydrogen atoms (and protons) produced from the dissociation of water due to ionizing radiation. This mechanism may reduce the amount of these atoms in the sample, thus reducing the amount of produced hydrocarbons in the residue.
3.2. Cross Section Determination
Figure 6(a) shows the evolution of the difference spectra (spectrum at a given fluence subtracted from the spectrum of the unirradiated sample) for the E50K experiment at several fluences. Peaks pointing upward (i.e., with positive area) indicate the production of new species. The downward pointing peaks (negative area) indicate the destroyed species (i.e., parental species).
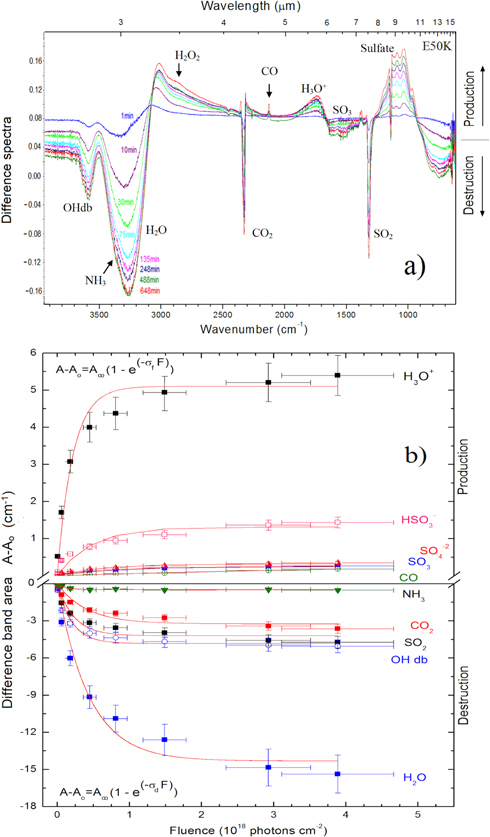
Figure 6. (a) Difference spectra for E50K experiment. Positive values for absorbance indicate the vibration modes of new products in the sample. (b) Difference band area for selected new species (upper panel) and parental species (bottom panel), as a function of photon fluence for the same experiment. Lines indicate the best fit of data employing Equation (2).
Download figure:
Standard image High-resolution imageThe numerical evolution of the abundance of a given molecular species in the ice during the irradiation (parent or daughter) can be quantified by the equation

where A, Ao, and  are the selected areas of the infrared band related to a specific vibrational mode of a given molecule at a given fluence (A), at the beginning of the experiment (A0, unirradiated sample), and at the highest fluence (
 terminal fluence). In this expression, σd,f represents the formation cross section (σf) for a new species (daughter) or the destruction cross section (σd) for parental species, both in units of cm2, depending on each case. F indicates the photon fluence in units of cm−2. Moreover, for parental species, at the terminal fluence, Equation (1) shows that the value of A – Ao →
  −Ao (i.e.,
  ). This may be associated with three different issues. (i) An incomplete soft X-ray illumination area in comparison with the probed sample by the IR beam. As discussed before, the outer border of the frozen sample may not have been fully illuminated by the incoming soft X-rays due to an eventual inhomogeneity of the beamline spot. (ii) The incoming radiation only illuminated the upper layers of the sample with the bottommost layers constantly shielded. (iii) The destroyed and produced species reached a photochemical equilibrium after a given fluence. Future investigation will help to clarify this issue.
Figure 6(b) shows the evolution of difference band areas (band area at a given fluence subtracted by the band area of the unirradiated sample) for selected new species (upper panel) and for parental species (bottom panel) as a function of photon fluence for the E50K experiment. The lines indicate the best fit for the experimental data, employing Equation (1) for both produced and destroyed species. The determined cross sections are also shown in this figure. Figures 7(a) and (b) present similar results for the experiment E90K.
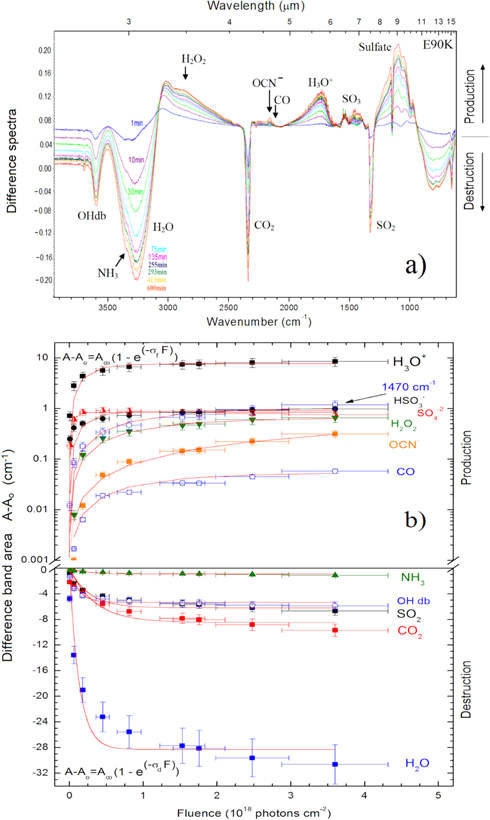
Figure 7. (a) Difference spectra for E90K experiment. Positive values for absorbance indicate the vibration modes of new products in the sample. (b) Difference band area for selected new species (upper panel) and parental species.
Download figure:
Standard image High-resolution imageThe determined values for the dissociation cross section of parental species and the formation cross sections of selected daughter species from the studied ices under the influence of ionizing photons between 6 and 2000 eV are given in Tables 3 and 4, respectively. The destruction cross section of the OHdb band in the E50K and E90K experiments are 5 × 10⁻¹⁸ cm2 and 8 × 10⁻¹⁸ cm2, respectively. An extended discussion about this will be given in the next section. Such values of the cross section are in good agreement with previous measurements employing soft X-rays in other astrophysical-related samples such as acetone ice at 10 K (Almeida et al. 2014), N2:CH4 (19:1) ice at 15 K (Pilling et al. 2009), pyrimidine ice at 130 K (Mendoza et al. 2013), solid-phase amino acids and nucleobases at 300 K (Pilling et al. 2011a), carboxylic acids (Boechat-Roberty et al. 2005; Pilling et al. 2006), methanol (Pilling et al. 2007b), benzene (Boechat-Roberty et al. 2009), and methyl formate (Fantuzzi et al. 2011).
Table 4. Formation Cross Sections and Formation Rate for Selected Daughter Species in the Studied Ices Irradiated by Photons with Energies from 6 to 2000 eV
| E50K | E90K | |||
|---|---|---|---|---|
| Molecule | σf (cm2) | klab (s−1) | σf (cm2) | klab (s−1) |
| H3O+ | 4.6E-18 | 4.6 × 10⁻⁴ | 4 × 10⁻¹⁸ | 4 × 10⁻⁴ |
| H2O2 | ⋯ | ⋯ | 9 × 10⁻¹⁹ | 9 × 10⁻⁵ |

|
2.13 × 10⁻¹⁸ | 2.1 × 10⁻⁴ | 4 × 10⁻¹⁸ | 4 × 10⁻⁴ |
| SO3 | 1.33 × 10⁻¹⁸ | 1.3 × 10⁻⁴ | ⋯ | ⋯ |

|
1.63 × 10⁻¹⁸ | 1.6 × 10⁻⁴ | 2 × 10⁻¹⁷ | 2 × 10⁻³ |
| CO | 1.63 × 10⁻¹⁹ | 1.6 × 10⁻⁵ | 9 × 10⁻¹⁹ | 9 × 10⁻⁵ |
| OCN− | ⋯ | ⋯ | 7 × 10⁻²⁰ | 7 × 10⁻⁶ |
| 1470 cm−1 | ⋯ | ⋯ | 9 × 10⁻¹⁹ | 9 × 10⁻⁵ |
Note. The uncertainty was estimated to be around 20%.
Download table as: ASCIITypeset image
From the dissociation/formation cross sections, it is also possible to calculate the dissociation/formation rate by the equation:

where ϕ indicates the photon flux in units of photons cm−2 s−1. The dissociation and formation rates for the studied species due to irradiation of photons with energies from 6 to 2000 eV in the laboratory (considering ϕlab = 1 × 10¹⁴ photons cm−2 s−1) are also listed in Tables 3 and 4. The half-life of parental species during the experiments was determined by the expression

where k is the photodissociation rate in units of s−1. These values are also listed in the Table 3.
From previous experiments employing different ices and ionization sources, we observe that the energy and the type of ionization source, whether it is photons, electrons, or ions, play the most important role in the dissociation of molecules (e.g., Pilling et al. 2010a, 2011a, 2014). However, depending on the presence of given reactive parental species in the sample, such as the SO2, the dissociation mechanisms of adjacent species in the ice may be affected due to the opening of different reaction pathways involving reactive ionic species and radicals produced by the incoming radiation. Further experiments with different molecular concentrations of parental species may help to elucidate this issue.
3.3. Energy Fluence to Reach Half-life
The energy fluence to reach the half-life  (sometimes called radiation dose to reach the half-life or half-life dose), obtained at the fluence in which the molecular abundance of a given parent species reaches half of the its initial value in the lab, is derived from the equation

where  is the half-life in units of seconds and E is the integrated energy flux in units of eV cm−2 s−1 of the incoming radiation (taken from Pilling et al. 2014).
The radiation dose to reach the half-life in the laboratory for the studied species is listed in Table 5. Considering the average penetration depth of the employed ionizing photons L ∼ 2000 nm and the sample density of 1 g cm−3, the estimated amount of "illuminated" molecules inside the sample is around 1.2 × 10¹⁷ molecules, as a first approximation, in a cylinder-shaped volume with a base area of 1 cm2 (samples area) and a height of 2000 nm (see equations in Pilling et al. 2012). From the amount of molecules exposed to radiation, we can also derive the energy fluence to reach the half-life in units of eV/molecule. This quantity is also listed in Table 5.
Table 5. Radiation Dose to Reach the Half-life (D1/2) in the Laboratory during Irradiation with Photons from 6 to 2000 eV
| E50K | E90K | |||
|---|---|---|---|---|
| D1/2 (lab)a | D1/2 (lab)b | D1/2 (lab)a | D1/2 (lab)b | |
| (1020 eV cm−2) | (104 eV/molecule) | (1020 eV cm−2) | (104 eV/molecule) | |
| H2O | 25 | 2.1 | 4 | 10.3 |
| CO2 | ∼85 | ∼7.5 | 10 | 1 |
| NH3 | 4 | 0.3 | 90 | 7.8 |
| SO2 | 10 | 0.8 | 7 | 0.6 |
Notes.
aObtained directly from experimental data at the energy fluence in which the numeric abundance of a specific molecular species reaches roughly the half-value. bConsidering the average penetration depth of ionizing photons from 6 to 2000 eV of L ∼ 2 μm and the sample density of 1 g cm−3, the estimated amount of molecules illuminated in the sample inside a cylinder-shaped volume with a base area of 1 cm2 and a height of 2000 nm is calculated to be around 1.2 × 10¹⁷ molecules (see equations at Pilling et al. 2012).Download table as: ASCIITypeset image
4. DISCUSSION AND ASTROPHYSICAL IMPLICATIONS
Generally speaking, astrophysical ices are made by the freezing out gas phase elements or small molecules (mostly H2O, NH3, CO2, CO, CH3OH, SO2, and more) onto cold grains (made initially by refractory species such as oxides, silicates and amorphous carbon—grain seed) in dense and cold interstellar and circumstellar environments. As discussed before, the abundances of such species in the ices largely vary depending on the environment. However, there is a consensus in the literature about the average ratio of the most abundant species, H2O and CO2. For example, following Gerakines et al. (1999), the CO2/H2O ratio seems to be around 19% in the vicinity of massive YSOs and 30% or higher toward low-mass YSOs. A detailed review of astrophysical ices can be seen at Boogert et al. (2015).
The presence of SO2 in star-forming regions, such as Orion, Sgr B2, and in the vicinity of YSOs, have been suggested by several authors (Snyder et al. 1975; Turner 1994; Boogert et al. 1996, 1997, 2002; Keane et al. 2001; Schilke et al. 2001; Gibb et al. 2004; Comito et al. 2005; Caux et al. 2011). As discussed by Lattanzi et al. (2011), molecules with sulfur account for about 10% of the species identified in the interstellar gas and in circumstellar envelopes, and the SO2 is one of the most prominent of these species. Zasowski et al. (2009) tried to quantify the presence of SO2 in the ices toward YSOs using infrared observations from Spitzer. Following the authors, the average composition of the ices toward Class I/II YSOs was dominated by water, with 12% CO2 (abundance relative to H2O), 14% NH3, 0.5% SO2 and other compounds. However, as discussed by Boogert et al. (1996), in the case of W33A, a high-mass YSO, the relative abundance of SO2, with respect to water, was determined to be about 1.6%. Depending on the position of such ices in the circumstellar environment of YSOs, for example, whether or not embedded in the prostostellar disk, their temperatures may be as low as ∼20 K for the high embedded grains (Av > 8 mag), or as high as 50–160 K (Av ∼ 3 mag) for the intermediated layers (midplane) of the disk (e.g., Öberg et al. 2011; Henning & Semenov 2013). Therefore, when applied to YSOs, the temperatures employed in this work (50 and 90 K) roughly simulated the ices at different regions in the midplane of the disk fully illuminated by X-rays.
As discussed before, due to the uncertainties in the real composition of astrophysical ices as well as due to its diversity, depending on the object studied, each laboratory simulation only gives a small glimpse into the big cosmological picture. Therefore, the current simulated ices (mixed ice H2O:CO2:NH3:SO2 with a ratio around 10:1:1:1 and temperatures of 50 and 90 K) and the radiation field employed (broadband soft X-rays) help us to understand the physicochemical processes over SO2-containing ices in the presence of the ionizing radiation field in these environments (which can also vary) rather than simulating specific YSOs.
Table 6 presents, for the sake of comparison, the integrated photon flux and energy flux measured in the lab at different photon energy ranges, as well as some values adopted for two ionization models of YSOs: model 1 (adapted from Siebenmorgen & Krügel 2010) and model 2 (from Fantuzzi et al. 2011) considered in this work. The solar flux 1 AU and at 5.2 AU (Jupiter's orbit) are also given (adapted from Gueymard 2004).
Table 6. Integrated Photon Flux and Energy Flux at Different Photon Energy Range Considered in This Work
| Integrated Photon Flux (cm−2 s−1) | |||||
|---|---|---|---|---|---|
| Photon Energy Range (eV) | Laba | Model 1 Typical YSO at 1 AUb | Model 2 TW Hydra at 40 AUc | Sun at 1 AUd | Sun at 5.2 AUd |
| 6–100 | 3.6 × 10¹³ | ∼5.7 × 10¹⁵ | 2.0 × 10¹¹ | 1.9 × 10¹³ | ∼4.6 × 10¹¹ |
| 100–2000 | 9.7 × 10¹³ | 7.1 × 10¹³ | 7.3 × 10¹¹ | 8 × 10⁸ | 3 × 10⁷ |
| 6–2000 | 1.3 × 10¹⁴ | 5.8 × 10¹⁵ | 9.3 × 10¹¹ | 1.9 × 10¹³ | 4.6 × 10¹¹ |
| Integrated Energy Flux (eV cm−2 s−1) | |||||
| Photon Energy Range (eV) | Laba | Model Typical YSO at 1 AUb | Model 2 TW Hydra at 40 AUc | Sun at 1 AUd | Sun at 5.2 AUd |
| 6–100 | 0.1 × 10¹⁶ | 5.4 × 10¹⁶ | ∼9.9 × 10¹² | ∼6.2 × 10¹³ | ∼4.3 × 10¹² |
| 100–2000 | 3.6 × 10¹⁶ | 8 × 10¹⁵ | 3.4 × 10¹⁴ | 2.5 × 10¹¹ | 1.5 × 10¹⁰ |
| 6–2000 | 3.7 × 10¹⁶ | 6.2 × 10¹⁶ | 3.5 × 10¹⁴ | 6.3 × 10¹³ | 4.4 × 10¹² |
Notes.
aSGM beamline at the Brazilian Synchrotron Light source (white beam mode). At sample position. bNon-attenuated photons from a T-Tauri star at 1 AU (Adapted from the model of Siebenmorgen & Krügel 2010). cAdapted from Fantuzzi et al. (2011). dSolar flux at 1 AU and a 5.2 AU (Adapted from Gueymard 2004).Download table as: ASCIITypeset image
An estimation for the photon flux (6–2000 eV) inside YSOs as a function of visual extinction (Av) employing both ionization models is presented in Figure 8(a). For model 1, we considered the non-attenuated flux ϕx (Av = 0) = 5.8 × 10¹⁵ photons cm−2 s−1 for a typical T-Tauri star at 1 AU (adapted from Siebenmorgen & Krügel 2010). For model 2, we adopt ϕx (Av = 0) = 1.5 × 10¹⁵ photons cm−2 s−1 for TW Hydra at 1 AU (adapted from Fantuzzi et al. 2011). As a first hypothesis, we assume that all the photons in this energy range are roughly equally attenuated by the gas/dust, and the relation considered between photon flux and visual extinction is given by the expression

where ϕx (Av = 0) represents the non-attenuated photon flux in units of photons cm−2 s−1 and Av is the visual extinction (considered dimensionless in this equation; adapted from Mendoza et al. 2013). In the calculations above, the central stars are considered the only source of X-rays, and we adopt the r−2 dependence with the distance as dilution factor for 10 and 100 AU.
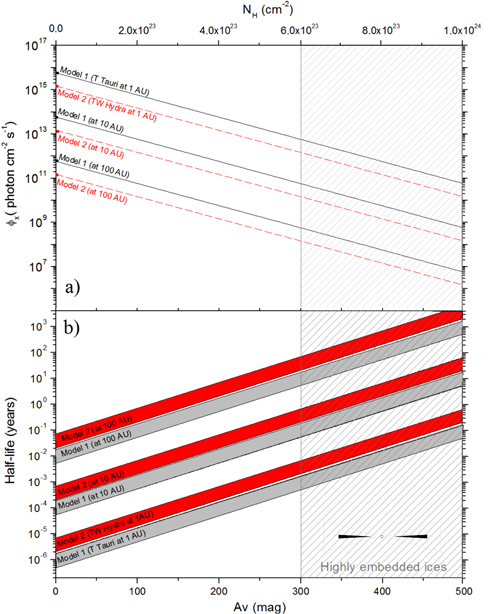
Figure 8. (a) Estimate of photon flux (6–2000 eV) as function of visual extinction considering two models of soft X-ray ionization of YSOs: model 1 (adapted from the model of Siebenmorgen & Krügel 2010 at 1 AU); model 2 (adapted from Fantuzzi et al. 2011 at 1 AU). (b) Range of half-lives of the ices studied (considering the destruction cross section in the range between (2–7) × 10−18 cm−2) as a function of visual extinction for both ionization models. See details in the text.
Download figure:
Standard image High-resolution imageConsidering the determined destruction cross section range ((2–7) × 10−18 cm−2) in this work, given in Table 3, and the flux dependence with the visual extinction described above, we estimated the half-life of the ices studied in the vicinity of YSOs. The range of half-lives as function of visual extinction considering both X-ray ionization models of YSOs is seen in Figure 8(b). Following the calculations, we observe that estimated half-lives derived in this work are stunningly low compared with the lifetimes of YSOs of ∼105–106 years (e.g., Dunham et al. 2014). However, if we considered that the denser regions of the protostelar disk may have visual extinction of hundreds of magnitudes (highly embedded ices), such half-lives will increase considerably. Such regions with extremely high visual extinction may be found in massive YSOs, as discussed in the works of Stark et al. (2006), Boorgert & Ehrenfreund (2004), and Ivezic & Elitzur (1997). Another important issue that also affects the amount and distribution of X-rays in the embedded ices is the location in which they are produced, and if their source has an extended profile or not (related with outflow and its jets).
Mendoza et al. (2013) have also employed dissociation cross section data in an attempt to evaluate the half-lives of frozen molecules illuminated by soft X-rays inside YSO environments (e.g., TW Hydra). The authors have measured the destruction of frozen pyrimidine at 130 K by photons from 394 to 427 eV (low-energy soft X-rays). The values obtained for the half-lives at 100 AU (considering n(H) < 105 cm−3) are comparable with values determined in this study.
As observed from Table 3, the determined the destruction cross section values are within a factor of ≤2 from each other, indicating a small dependence on the ice temperature in this range, except for NH3 at 50 K which is a factor of 3 larger. The results show that in both soft X-ray field models (TW Hydra or Typical T-Tauri stars), the water and SO2 molecules present in the warmer ices (90 K) are more sensitive to soft X-rays than ammonia and CO2. However, for colder ices (50 K), the most sensitive species is NH3. Additionally, the low value of half-lives estimated for both models reinforce that the idea that soft X-rays are indeed a very efficient source of molecular dissociation in such environments.
As mentioned previously, besides the direct heating promoted by ionizing field at ices in the circumstellar environment, they are also subjected to other heating processes such as grain–grain collision. Additionally, mass movements such as turbulence or convection inside the protostellar disk may induce a migration of grains from cold regions to hot regions (outwards). Therefore, along the evolution of YSOs, some ice grains embedded in the protostellar disk can be heated up to temperatures around 300 K (or higher), allowing only non-volatile species to remain in the solid phases. An investigation about the influence of such extra heating (2 K minute−1 up to the room temperature) induced by a non-ionizing source in the irradiated ices was also performed, and the main results are discussed in the
Figure 9 presents the spectra of the organic residue produced for the ices studied initially containing the mixture H2O:CO2:NH3:SO2 (roughly 10:1:1:1) at two temperatures (50 and 90 K) after irradiation and heating to room temperature. Although the ices have roughly similar initial compositions when deposited at 13 K, the different temperatures of the experiments allows for chemical differentiation (enhanced during irradiation phase). The observed chemical differences between the ices studied (observed also at the residues at 300 K) can be justified by different reaction mechanisms, reaction rates, and desorption temperatures (and rates) of daughter species, all of which are triggered by different temperatures.
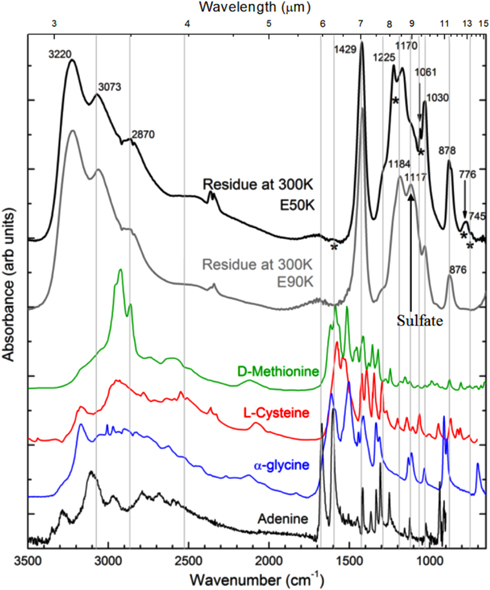
Figure 9. Comparison between the two residues of the ices studied containing the mixture H2O:CO2:NH3:SO2, after irradiation and heating to room temperature. Reference spectrum at room temperature of two sulfur-containing amino acids D-Methionine (NIST webbook) and L-Cystine (Cataldo et al. 2011), glycine (Pilling et al. 2013), and adenine (Pilling et al. 2011a) are also shown. Vertical lines indicate tentative matches between some peaks in the infrared spectra of the residues with peaks in the reference spectra of selected reference sample. Numbers indicate the apex of selected peaks. Asterisks indicate the peaks that only exist in the residue of the E50K experiment.
Download figure:
Standard image High-resolution imageFor comparison, the reference spectrum of two sulfur-containing amino acids D-Methionine (NIST webbook) and L-Cystine (Cataldo et al. 2011), the simplest proteinaceous amino acid glycine (Pilling et al. 2013), and the nucleobase adenine (Pilling et al. 2011a), all at room temperature, are also shown in Figure 8. Vertical lines indicate tentative matches between some peaks in the infrared spectra of the residues with peaks in the reference spectra. Asterisks indicate the peaks that only exist in the residuals of the E50K experiment. Such peaks may have an indirect relation to volatile species (e.g., CO, N2, H2), produced due to irradiation. These molecules may be trapped in the ice, thus participating in some chemical reactions to produce new species. The results indicate that some bands may have some contribution to the of peaks of these species. However, additional studies should be done employing other analytical chemical techniques, such as gas chromatography (GC/MS) or nuclear magnetic resonance (NMR), to precisely identify and quantify them among the chemical inventory of the residues. Therefore, the results suggest that complex molecules may be produced by soft X-rays in such extreme and cold environments.
Finally, besides the implications on the ice around YSOs, the current study may also be employed to draw the influence of soft X-rays as well as other energetic ionizing radiation in the physicochemistry of other SO2-containing ices such as the surface of the moon Europa (e.g., Elsner et al. 2002; Schriver-Mazzuoli et al. 2003b; Carlson et al. 2009).
Pilling et al. (2009), in a similar study, also using VUV photons and soft X-rays of the Brazilian synchrotron light source, detected adenine employing ex situ GC/MC and RMN analysis of the residue after the irradiation of an icy sample. The authors irradiated a mixture of N2 and CH4 in an attempt to simulate the effect of ionizing photons in the aerosol analogs of the upper atmosphere of Titan, a moon of Saturn.
5. CONCLUSIONS
In this work, we present for the first time the results of the experimental investigation of the effects produced by broadband soft X-rays (plus fast photoelectrons, low-energy-induced secondary electrons, and a minor component of VUV photons) with energies from 6 to 2000 eV, on the frozen mixtures containing H2O:CO2:NH3:SO2 (10:1:1:1) at 50 and 90 K. The experiments are an attempt to simulate the real photochemical processes induced by energetic photons in SO2-containing ices present in cold environments inside surrounding YSOs (largely illuminated by soft X-rays). The measurements were performed using a high-vacuum portable chamber from the LASA/UNIVAP coupled to the SGM beamline at the Brazilian Synchrotron Light Source (LNLS) in Campinas, Brazil. In situ sample analyses were performed by a FTIR spectrometer. Our main results and conclusions are as follows.
- i.The dissociation cross section of parental species due to the irradiation of broadband soft X-rays were on the order of (2–7) × 10−18 cm2. For CO2 and SO2, the temperature of the ices in the range studied did not significantly influence the dissociation cross sections. The values determined were around 3 × 10⁻¹⁸ cm2 for CO2 and 4 × 10⁻¹⁸ cm2 for SO2. Ammonia was the species most affected by the irradiation temperature. The destruction cross section at 50 K was roughly three times higher than the value obtained at 90 K. This may occur due to the opening of specific reaction pathways involving NH3 at low temperatures. Curiously, an opposite behavior was observed for other species that have higher dissociation cross sections at 90 K.
- ii.The infrared spectra of the irradiated samples presented the formation of several organic molecules, including nitriles, acids, H2SO4, SO3, and other organic compounds. The formation of OCN− was much enhanced with the increasing temperature of the samples. When applied to the circumstellar environment of YSOs, this suggests that the abundance of OCN− may be enhanced in the warmer regions (Av < 3), for example, in the external layers of the protoplanetary disk.
- iii.The half-life of the parental species studied in the sample, extrapolated to YSO conditions, suggests that a chemical gradient between the cold and hot regions inside protoplanetary disks may also be triggered by incoming soft X-rays. The results show that for colder ice the species most sensitive to X-rays was ammonia. For warmer ice (T ∼ 90 K), the most sensitive species was water. The low value of half-lives obtained employing two different models of the radiation field of YSOs (typical T-Tauri star and TW Hydra) reinforces that soft X-rays are indeed an very efficient source of molecular dissociation in such environments.
- iv.While heating to room temperature after the irradiation of both samples, sulfur dioxide remained visible in the infrared spectrum (trapped in the ice) until temperatures of 195–200 K. Such high temperatures, higher than the sublimation temperature of water ice, indicate that at least a fraction of SO2 must remain in ices toward YSOs after an extra heating produced, for example, by an energy delivered during grain–grain collision or cosmic ray heating. Due to this difference in the sublimation temperature between H2O and SO2, in such possible heating scenarios, the molecular ratio SO2/H2O may increase the production of sulfurous-bearing molecules, such as SO3, and also increase the probability of the sulfur-containing biomolecules. The IR spectrum of the residues after heating to room temperature presented some bands that match peaks in the reference spectra of selected sulfur-bearing amino acids, glycine, and adenine. However, additional experiments should be done employing other analytical chemical techniques, such as gas chromatography (GC/MS) or NMR, to precisely identify and quantify them among the chemical inventory of the residues.
The current experimental investigation reveals the importance of soft X-rays and induced electrons in the chemical modification of simulated astrophysical ices. Moreover, this study confirms previous results, which showed that the organic chemistry on the ices around YSOs could be very complex, temperature-dependent, and extremely rich in prebiotic compounds (triggered by incoming radiation field).
The authors acknowledge the Brazilian agencies FAPESP (Projects JP 2009/18304-0 and DR 2012/17248-2) and CNPq (Research fellowship 304130/2012-5) as well as the FVE/UNIVAP for financial support. We thank MSc. Will R. M. Rocha for fruitful discussions as well as the staff at UNIVAP and LNLS for technical support.
APPENDIX: THERMAL HEATING BEFORE AND AFTER IRRADIATION
A.1. Heating Phase before Irradiation: Sample Preparation
Figure 10 presents different spectra of the experiment labeled E50K and E90K before the irradiation phase, during the slow heating (2 K minute−1) from 13 K (temperature of the frozen sample production) up to the temperature of the irradiation phase: 50 K and 90 K, respectively. Figure 10 (bottom panels) show an expanded view from 1800 to 610 cm−1. The labels identify the specific infrared bands of the molecular species (H2O, CO2, NH3, SO2) in the spectra. Such bands are associated with different molecular vibration modes of the frozen species (e.g., Pilling et al. 2010a, 2010b, 2011a). In all panels, the uppermost spectrum is the warmer spectrum. As observed in the figure for the E50K experiment, the heating from 13 to 50 K apparently did not affect the infrared spectrum of the sample. However, for the E90K experiment, some chemical reactions were triggered during the heating process (mainly when temperatures reached around 80 K). The vertical bars in these figures indicate the new infrared bands associated with the produced species in the ice sample due to heating. The new infrared peaks identified in the spectrum appeared at the wavenumbers 1552, 1493, 1395, 1295, 1035, 1011, 1011, 957, and 826 cm−1.
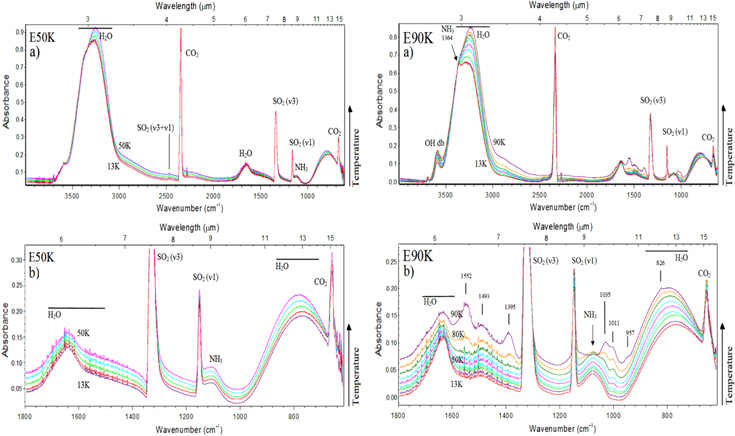
Figure 10. (a) Evolution of the unirradiated infrared spectrum sample of the E50K (left) and E90K (right) experiment during the thermal heating (2 K minute−1) from the initial temperature of 13 K to the temperature of the irradiation phase. (b) Expanded view from 1800 to 610 cm−1.
Download figure:
Standard image High-resolution imageFollowing Schriver-Mazzuoli et al. (2003b), the peak at 1395 cm−1 can be attributed to sulfur trioxide (SO3). The peak around 1552 cm−1 is tentatively attributed to carboxylate ion (RCOO−), or even amino acid zwitterions (Shimanouchi 1972). The feature at 1035 cm−1 was attributed to ozone (O3) and/or to hydrogen sulfite ion (bissultite ion)  by Moore et al. (2007) in similar experiments. The presence of sulfuric acid (H2SO4) and the disulfite ion (
 ) can be attributed to the small peak at 957 cm−1 (e.g., Moore et al. 2007; Loeffler & Hudson 2013). The disulfite ion is a dimer of the bisulfite ion (
 ) and may also be transformed back into the bisulfite ion in the presence of acids of free protons (Eagleson 1994). The disulfite ion also arises from the addition of sulfur dioxide to the sulfite ion (
 ). A similar chemical alteration was also observed by Loeffler & Hudson (2010) during thermal processing of SO2-containing ices.
It is import to note that the water ratio employed in the ices studied is small compared with the one present in astrophysical ices, and the observed chemical changes associated with sulfur dioxide reaction, triggered by temperature enhancement, may have a minor contribution in real astrophysical scenarios. Future experiments containing different abundances of water in the ice may help to clarify this issue. During the initial heating of the unirradiated samples, the chemical ratio of the parental species changed slightly in comparison with the samples at 13 K. This occurs due to the sublimation of the weakly bonded molecules, and became more evident in the E90K experiment, which also allowed phase transition of the trapped ammonia (Zheng et al. 2009) and SO2 (Schriver-Mazzuoli et al. 2003a). In addition, the presence of strong OH dangling bonds (OHdb) at around 3610 cm−1 indicates that the E90K sample presented a higher degree of porosity (see also Palumbo 2006; Pilling et al. 2010a, 2010b). No significant change in this band was observed during the heating from 13 to 90 K.
A.2. Heating Phase after Irradiation: Residue Preparation
Figure 11(a) presents the IR spectra collected at specific temperatures during the heating of the irradiated sample at 50 K (E50K experiment) at the final fluence of 3.9 × 10¹⁸ photons cm−2, obtained after 648 minutes of continuous irradiation with synchrotron light. During this heating stage, some infrared bands vanish as a result of molecular sublimation and chemical changing. However, other IR bands appear as well, illustrating the formation of new species. For example, the following bands appeared at 1420 cm−1 at the temperature of 160 K; 1250 cm−1 at 172 K; 880 cm−1 and 780 cm−1 at 183 K; 1040 and 1230 cm−1 at 265 K. Such bands and their tentative molecular assignments are listed in Table 2. The second uppermost spectrum in this figure represents the residue at room temperature, and the uppermost spectrum represents the residue after a second cooling down cycle to 13 K. In this re-cooled sample spectrum, some bands observed in the residue at 300 K have changed to a sharper profile, indicating that some phase transitions may have occurred. Figure 11(b) presents IR spectra collected at specific temperatures during the heating of the bombarded simulated sample at 90 K in the final fluence of 3.6 × 10¹⁸ photons cm−2, obtained after 600 minutes of continuous irradiation with synchrotron light. During the heating, SO2 and CO2, which are the remaining parental species, desorbed completely in temperatures above 200 K and 260 K, respectively. In addition, at temperatures above 200 K, new features arose in the IR spectrum in the wavenumbers 880, 1429, 2871, and 3073 cm−1. A list of the new bands observed in the spectra during the heating and their tentative molecular assignments are shown in Table 2. As discussed before, SO3 was one of the molecules produced during the irradiation. This species was also observed in the residue at room temperature (e.g., 828, 1060, 1215, 1396 cm−1). In a similar set of experiments involving the processing of SO2-rich ices by fast protons, the SO3 molecule was also observed (Moore 1984; Strazzulla 2011).
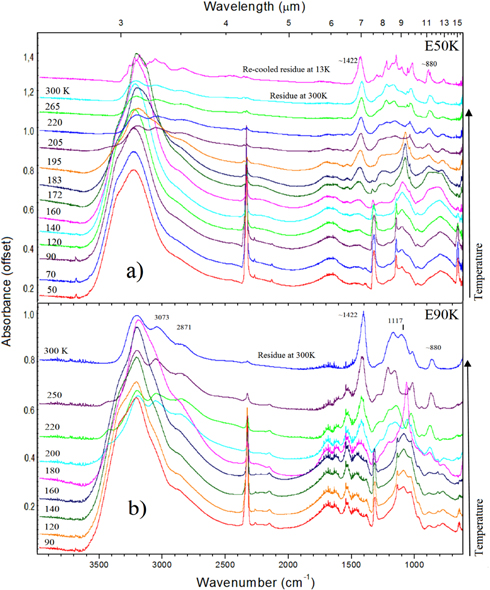
Figure 11. Changes in the IR spectrum of the irradiated samples during the slow heating up to room temperature. (a) Irradiated sample at 50 K (final fluence of 3.9 × 10¹⁸ photons cm−2) during heating to 300 K. The uppermost spectrum is the residue at 300 K after cooling down again to 13 K (re-cooled sample). (b) Irradiated sample at 90 K (final fluence of 3.6 × 10¹⁸ photons cm−2) during the heating to 300 K. See details in the text.
Download figure:
Standard image High-resolution imageBecause water is the most abundant species in the current simulation, during the heating, minor parental species are still trapped in the matrix, and besides some desorption at specific temperatures, most of them also desorbed at the desorption temperatures of water molecules, around 160–190 K (see also the discussion in Collings et al. 2004). Following the authors, the desorption temperatures of pure CO2, NH3, and SO2 ices at low pressure are around 80, 90, and 100 K, respectively. Therefore, during the heating stage, a fraction of such species is expected to diffuse, react, and also desorbed from the sample at these specific temperatures.
The infrared spectra of irradiated samples during the final heating stage to room temperature helps us to understand what may happen in the surface chemistry when these ices are exposed to external or internal heating process. When associated with Europa ices, such heating mechanisms may, for example, be ruled by tidal forces and/or asteroid/comet impact. As discussed before, for the ices in the disk of YSOs, this heating may be produced by grain–grain collision, delivered comic ray energy, or by the absorption of IR and visible photons from the host star. In both situations, if the sample temperature is heated to values higher than 180–200 K, the chemistry of this region will change drastically (mainly due to the water sublimation and the opening of reaction pathways on the ice). As observed in Figure 11(b), this seems to be more enhanced for the E90K experiment than for the 50 K experiment, when we make a comparison between spectra below 180 K with that obtained above 200 K.
Figures 12(a) and (b) present a comparison between the IR spectra of the solid residue at 300 K (non-volatile molecules) and the IR spectra of the irradiated sample at low temperature, for the experiment E50K and E90K, respectively. The difference spectrum (obtained from the subtraction between spectrum of the irradiated sample at low temperature and the spectrum of the residue at 300 K) is also shown. This difference spectrum shows bands with positive and negative area. Such bands represent different sets of molecular species: positive profiles indicate volatiles species (parental species and daughter species produced due to the irradiation and also during the heating phase); negative profiles indicate only the vibration modes of the non-volatiles species produced during the heating phase (e.g., bands at 1422, 1190, and around 880 cm−1).
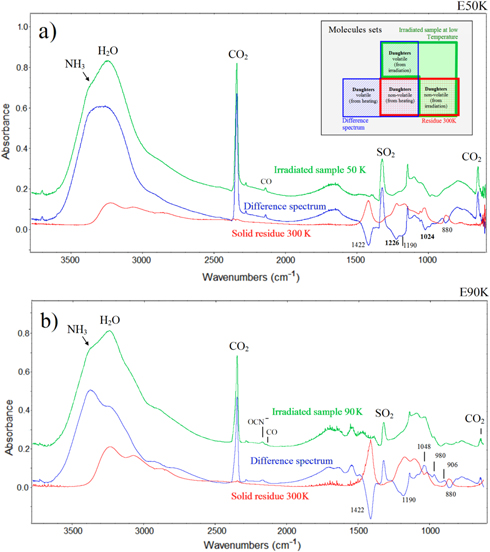
Figure 12. Comparison between the infrared spectrum of solid residue at 300 K (non-volatile molecules) and the spectrum of the irradiated sample at low temperatures. Difference spectrum (obtained from the subtraction between the spectrum of the irradiated sample at low temperature and the IR spectrum of the residue at 300 K). (a) Experiment E50 K. (b) Experiment E90 K. The inset figure indicates the family of species observed in each spectrum. See details in the text.
Download figure:
Standard image High-resolution image
The inset in Figure 12(a) indicates the family of species observed in each spectrum. For example, in spectra of the irradiated samples at low temperatures, we observe infrared features of the volatile parental species combined with features from volatiles and non-volatiles produced by daughter species. In the infrared spectrum of the solid residue at 300 K we observe the IR features of the non-volatile species, produced due to the irradiation, as well as the non-volatile species produced during the slow heating to room temperature after the irradiation phase.
The results indicate that during the final (thermal) heating, we observe non-volatile species with peaks in the infrared spectrum at 1226 and 1024 cm−1 only in the E50K experiment. This suggests that besides the particularities in the surface chemistry induced by irradiation, there is an additional factor that is clearly induced by thermal and non-ionizing heating.