
Abstract
Ti-substituted BiLaFeO3 ceramics having compositions Bi0.8La0.2Fe1−xTixO3 (x = 0.0, 0.05, 0.1, 0.15) were synthesized by the conventional solid-state reaction method. Powder x-ray diffraction investigations performed at room temperature show that the crystal structure is rhombohedral for x = 0.0, 0.05; tetragonal for x = 0.15; and a phase boundary occurs at x = 0.1. In the Rietveld refinement good agreement between the observed and calculated pattern was observed. Dielectric response of these samples was analysed in the frequency range 1 kHz–5 MHz at different temperatures. A decrease in the values of real (ε') and imaginary (ε'') parts of dielectric constant with Ti substitution indicates reduced conductivity and hence enhanced resistivity in doped samples. Stability of dielectric constant and conductivity with temperature is considerably improved with Ti substitution. Magnetic measurements were carried out at room temperature up to a field of 20 kOe. Magnetic properties of Bi0.8La0.2FeO3 ceramics are considerably improved on Ti substitution along with a significant opening in the room temperature M–H hysteresis loop. Higher values of remanent magnetization (Mr) 0.1373 and 0.1487 emu g−1; coercivity (Hc) 4.856 and 5.904 kOe are observed for samples with x = 0.1 and 0.15, respectively. This is due to the structural phase transition from rhombohedral to tetragonal.
Export citation and abstract BibTeX RIS
1. Introduction
Multiferroic materials, in which electric and magnetic orderings coexist in a single phase, have attracted a lot of attention. These materials have great potential for creation of magnetoelectric and magneto-optical devices [1]. Simultaneous occurrence of electric and magnetic orderings in the same phase has made multiferroic materials a boon for the future technology in information storage and sensors [2–4]. However, there is a scarcity of materials exhibiting multiferroic behaviour. Theoretical studies have shown that the usual atomic-level mechanisms driving ferroelectricity and ferromagnetism are mutually exclusive, because they require empty and partially filled transition metal orbits, respectively [5]. Also, known single-phase magnetic ferroelectrics usually have low magnetic ordering temperatures, thus constricting the possibilities for their applications. From this point of view, the most interesting results are expected for the BiFeO3-based perovskite materials. BiFeO3 (BFO) with perovskite structure has been considered as one of the more fascinating multiferroics because of its ferroelectric transition (at about 1100 K) and antiferromagnetic Néel temperature (at about 640 K) are well above room temperature (RT) [6, 7]. Thus BFO is one of the most popular objects in modern material science and an excellent candidate for use in ferroelectric non-volatile memories and high performance electronics [8]. But unfortunately, BFO has some inherent problems. In BFO, magnetic ordering is of antiferromagnetic type, having a spatially modulated spin structure with an incommensurate long-wavelength period of 62 nm which cancels the macroscopic magnetization and also inhibits the observation of the linear magnetoelectric effect [8–11]. In addition, the bulk BFO is characterized by serious current leakage problems due to the existence of a large number of charge centres caused by oxygen ion vacancies and Bi2O3 evaporation during sintering process which makes it difficult to achieve high resistivity. These problems limit the use of BFO for fabrication of multifunctional devices [12]. In order to overcome these problems, many attempts have been made recently, which include (i) doping rare earth lanthanide ions (La3+, Nd3+or Sm3+) [13–20] or divalent ions (Ca2+, Sr2+, Ba2+, Pb2+) [21–24] at the A site of BFO for substituting part of Bi3+ or with ions of Nb5+, Mn4+, Cr3+, Ti4+ at the B site for substituting part of Fe3+; [25–28] (ii) synthesizing BiFeO3 nanoparticles with grain size below 62 nm to achieve ferromagnetism by destroying spiral spin structure; [9] (iii) depositing ultra-thin BiFeO3 single layer or multilayer films to enhance ferroelectric property; [29, 30] (iv) fabricating high quality single crystal of BiFeO3 to solve non-stoichiometric problems [31]. Among these approaches, it has been proved that La substitution is an efficient way to improve the ferroelectric as well as ferromagnetic properties of BFO. Addition of La reduces significantly the volatilization of bismuth oxide and hence improves oxygen ion stability in the lattice [12, 13]. Among various kinds of doping reported at B site, Ti substitution is found especially attractive. It could not only decrease the leakage current significantly but also induces a remanent magnetization in BFO [32, 33]. Therefore, it is interesting to study the effect of co-substitution of La and Ti on BFO in order to have the combined advantages of the two. So far there are only a few reports on the co-doping effect of La and Ti in BFO focusing on electronic transport mechanism, ferroelectric and impedance behaviour [34, 35] but none about the Rietveld refinement of La and Ti co-doped BFO. Analysis of the published data and further studies show that spontaneous magnetization revealed in doped BFO samples can be attributed to the presence of structural phases with other symmetry type than that in BFO, i.e. R3c [36, 37]. Therefore in this work, Bi0.8La0.2Fe1−xTixO3 ceramics have been prepared by conventional ceramic technology and the Rietveld refinement has been carried out to understand the correlation of crystal structure with dielectric and magnetic properties.
2. Experimental
The polycrystalline multiferroics samples having compositions Bi0.8La0.2Fe1−xTixO3 (x = 0.0, 0.05, 0.1, 0.15) were synthesized by the conventional ceramic technology using high purity analytical grade Bi2O3, Fe2O3, La2O3 and TiO2 (purity ⩾99.0%) reagents. These materials were carefully weighed in stoichiometric proportion, mixed thoroughly and ground in an agate mortar until a homogeneous mixture was formed. The compacted mixtures of reagents taken in desired cation ratios were first calcined at 993 K for 2 h and grinding was again carried out for 1 h to get more homogeneous mixture. Final sintering was carried out at 1073 K for 3 h at heating rate 5 K min−1. All the compounds were allowed to cool naturally after sintering. The crystal structure of the samples (sintered powder) was determined from x-ray diffraction (XRD) data. XRD patterns were collected at RT using a Rigaku Miniflex-II diffractometer with Cu Kα radiation in the 2θ range (10°–120°) at slow scanning rate of 1° min−1. A Si (640c) powder was used as a standard sample to correct the zero point shifts for the measured diffraction data. Simulation of crystal structure based on the measured XRD data was processed using the Rietveld structure refinement software (GSAS + EXPGUI). Microstructure of the surface was observed using scanning electron microscopy (SEMTRACmini of NIKKISO). Dielectric characterization of samples was carried out with an impedance/gain phase analyser (Newton's 4th Ltd) in the frequency range 1 kHz–5 MHz in the temperature range 313–573 K. For dielectric measurements, powdered sample was pressed to form pellets (of 13 mm diameter and 1 mm thickness) by applying a pressure of 10 ton using a pellet press. The pellets were precalcined at 993 K for 2 h and grinding was again carried out for 1 h to get more homogeneous mixture. Final sintering was carried out at 1073 K for 3 h at a heating rate 5 K min−1. As-sintered pellets were then polished and coated uniformly with silver paste on both sides for making electrodes. Magnetic evaluation was carried out at RT up to a field of 20 kOe using vibrating sample magnetometer (Lakeshore VSM 7410).
3. Results and discussion
3.1. Structural analysis
Figure 1 shows the XRD patterns of Bi0.8La0.2Fe1−xTixO3 (x = 0.0, 0.05, 0.1, 0.15) samples. A very small amount of impurity phase Bi2Fe4O9, as labelled by '•', was detected in the sample for x = 0.15. This could not be removed even by longer calcination times which could also lead to more volatization of Bi2O3. Minor impurity phases observed have also been reported to form during the synthesis of BFO; La-doped BFO and co-substituted BFO ceramics [13, 15]. The observed impurity phase is neither magnetic nor ferroelectric at RT. Therefore, its presence will not affect ferroelectric and ferromagnetic properties of the system. XRD peak intensity ratios observed in XRD pattern suggest polycrystalline behaviour with good crystallinity of these samples. The existence of splitting peaks around 31° and 52° for x = 0.0 suggests the distorted rhombohedral R3c structure which is consistent with those reported by Du et al [38]. For x = 0.0 ceramic the peaks (1 0 4) and (1 1 0) are clearly split, but with Ti substitution this peak splitting decreases. The observed disappearance of peak splitting (1 0 4)/(1 1 0) in the XRD pattern is a common feature for Ti substitution [39, 40]. The intensity of peaks observed around 2θ ≈ 39° and 52° for x = 0.0 ceramic gradually decreases and merges partially to form a broadened peak with the increase in Ti content which is also reported by Gu et al [39]. Splitting of peaks around 22° and 45° takes place with the increase in Ti content which suggests phase transition from rhombohedral to tetragonal. For detailed structure analysis, structural parameters obtained from XRD pattern were further refined using GSAS+EXPGUI program [41, 42]. It is known that the RT phase of BFO is a rhombohedrally distorted perovskite structure described by space group R3c. Rhombohedral cell is very close to the cubic one (angle α in the rhombohedral cell is about 89.4°). In this structure, cations are displaced from their centrosymmetric position along the pseudocubic [1 1 1]C axes [21]. The unit cell can also be described in a hexagonal frame of reference with hexagonal c-axis parallel to the diagonals of the perovskite cube. Therefore, the miller indices (h k l) of diffraction peaks in figure 1 are referred to as hexagonal axes rather than rhombohedral axes. The lattice parameters 'a' and 'c' were calculated using (1) as given below

where θ is Bragg's angle and λ is the wavelength of x-rays used. The strong peaks (0 1 2) and (1 1 0) were used for such calculations. Calculated values of lattice parameters 'a' and 'c' from (1) were used as the initial parameters during the refinement and these parameters were further refined. The Rietveld refinement requires that intensities as well as the shapes of diffraction peaks must be reproduced. To model a crystal structure with the Rietveld refinement, we must fit a large number of experimental parameters in addition to the crystallographic parameters. The Rietveld refinement of the XRD patterns for the x = 0.0 and 0.05 samples (figures 2(a) and (b), respectively) was performed using same space group, i.e. R3c and the structural model allowed us to reproduce all the observed peaks. The initial Rietveld refinement was carried out by zero point shift, the unit cell and background parameters. The background was modelled using cosine Fourier series and peak shapes were described by pseudo-Voigt functions. After a good match, the peak positions were achieved, the peak profile parameters including the peak symmetry were refined. The Rietveld refinement of the XRD pattern for the x = 0.1 sample (figure 2(c)) was performed using both space groups, i.e. R3c and P4mm separately. But none of these give satisfactory results. Then refinement was carried out by combining R3c and P4mm space groups. Fairly good values of reliable factors were obtained using this combination of two phases (i.e. R3c + P4mm). Refinement pattern for the x = 0.15 sample (figure 2(d)) was best fitted with space group P4mm. Therefore, with the increase in Ti content, there is a continual change in crystal structure from rhombohedral to tetragonal and phase boundary occurs at x = 0.1. Refined structural parameters along with profile R-factors are listed in table 1 and different bond lengths and bond angles are given in table 2. It is clear from table 1 that there is a continual decrease in lattice constants, and hence volume, with increase in Ti content. This volume contraction is due to small difference in ionic radius of Ti4+ (0.604 Å) and Fe3+ (0.645 Å). The change in the value of c/a with Ti substitution shows a change in crystal anisotropy.
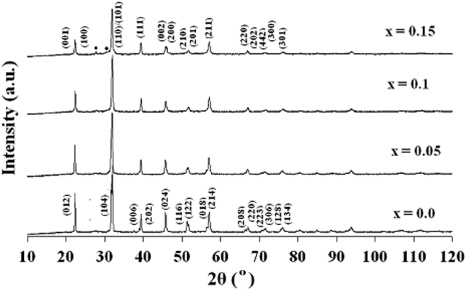
Figure 1. XRD patterns of Bi0.8La0.2Fe1−xTixO3 (x = 0.0, 0.05, 0.1, 0.15) samples at RT. The diffraction peaks corresponding to impurity phase Bi2Fe4O9 are marked as '•'.
Download figure:
Standard image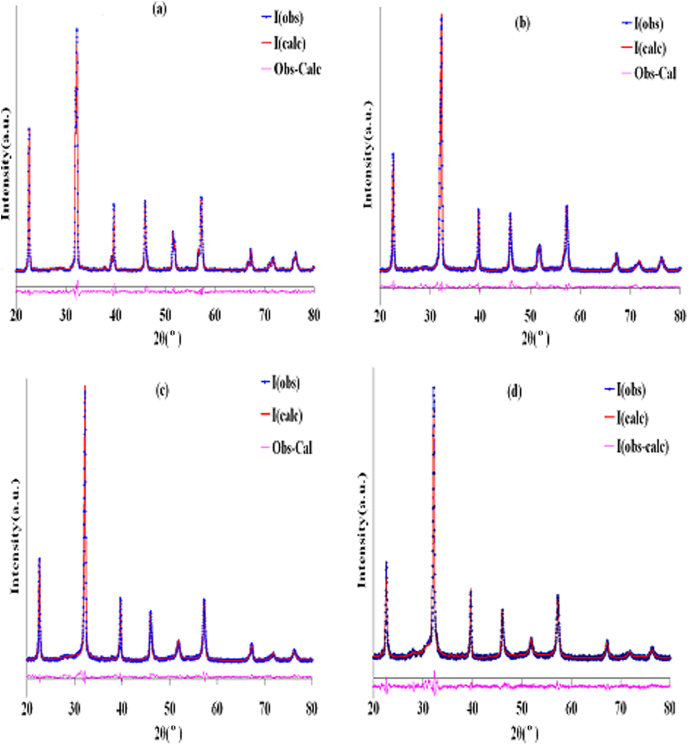
Figure 2. The observed, calculated and difference Rietveld refinement XRD patterns of Bi0.8La0.2Fe1−xTixO3: (a) x = 0.0, (b) x = 0.05, (c) x = 0.1 and (d) x = 0.15 samples.
Download figure:
Standard imageTable 1. Refined structural parameters of Bi0.8La0.2Fe1−xTixO3(x = 0.0, 0.05, 0.1, 0.15) samples.
| Positional coordinates | ||||||
|---|---|---|---|---|---|---|
| Structural model | Cell parameters | Position | x | y | z | R-factor (%) |
| Sample with x = 0.0 | ||||||
| R3c | a = 5.5796 Å | 6a | 0 | 0 | 0.2266 | Rp = 3.40 |
| c = 13.8381 Å | 6a | 0 | 0 | 0 | Rwp = 4.65 | |
| V = 62.182 Å3 | 18b | 0.9160 | 0.6625 | 0.4355 | χ2 = 2.54 | |
| c/a = 2.480 | ||||||
| Sample with x = 0.05 | ||||||
| R3c | a = 5.5758 Å | 6a | 0 | 0 | 0.2399 | Rp = 3.16 |
| c = 13.8075 Å | 6a | 0 | 0 | 0 | Rwp = 4.20 | |
| V = 61.961 Å3 | 18b | 0.8491 | 0.6199 | 0.4426 | χ2 = 2.21 | |
| c/a = 2.476 | ||||||
| Sample with x = 0.1 | ||||||
| R3c (51%) | a = 5.5742 Å | 6a | 0 | 0 | 0.2306 | Rp = 2.82 |
| c = 13.7737 Å | 6a | 0 | 0 | 0 | Rwp = 3.71 | |
| V = 61.773 Å3 | 18b | 1.7317(17) | 1.0714(27) | 0.4263(12) | χ2 = 1.71 | |
| c/a = 2.471 | ||||||
| P4mm (49%) | a = 3.9304 Å | 1a | 0 | 0 | 0.1627(10) | |
| c = 3.9702 Å | 1b | 0.5 | 0.5 | 1.6254(5) | ||
| V = 61.332 Å3 | 1b | 0.5 | 0.5 | −0.3541(9) | ||
| c/a = 1.010 | 2c | 0.5 | 0.0 | 0.9126(9) | ||
| Sample with x = 0.15 | ||||||
| P4mm | a = 3.9355 Å | 1a | 0 | 0 | 0.097(0) | Rp = 3.72 |
| c = 3.9477 Å | 1b | 0.5 | 0.5 | 0.5625(14) | Rwp = 5.00 | |
| V = 61.143 Å3 | 1b | 0.5 | 0.5 | −0.5548(0) | χ2 = 2.99 | |
| c/a = 1.003 | 2c | 0.0 | 0.0 | 0.6133(0) | ||
Table 2. Different bond lengths and bond angles of Bi0.8La0.2Fe1−xTixO3 (x = 0.0, 0.05, 0.1, 0.15) samples obtained from refinement.
| Bond length (Å) | Bond angle (°) | ||
|---|---|---|---|
| Sample x = 0.0 | |||
| Bi–O | 2.454(5), 2.392(5) | Bi–O–Bi | 111.929(0) |
| Fe–O | 1.918(4), 2.180(4) | Bi–O–Fe | 110.220(0), |
| 100.476(2) | |||
| Sample x = 0.05 | |||
| Bi–O | 2.285(6), 2.627(5) | Bi–O–Bi | 107.158(0) |
| Fe–O | 2.011(3), 2.059(5) | Bi–O–Fe | 103.360(2), |
| 99.294(2) | |||
| Sample x = 0.1 | |||
| Bi–O2 | 2.520(7), 2.520(7) | Bi–O2–Bi | 103.000(4), |
| Fe–O1 | 0.220(10) | Bi–O2–Fe | 98.800(13) |
| Fe–O2 | 2.027(23), 2.027(23) | O1–Fe–O2 | 104.200(25) |
| Sample x = 0.15 | |||
| Bi–O2 | 2.830(16), 2.745(16) | Bi–O2–Bi | 91.966(7) |
| Fe–O1 | 0.46(6) | Bi–O2–Fe | 94.00(11) |
| Fe–O2 | 1.984(15), 1.984(15) | O1–Fe–O2 | 95.80(16) |
The average particle size for all the samples was calculated from XRD peak broadening using the Debye Sherrer formula;

where D is the crystallite size, K (constant) = 0.89, β is the full width at half maxima (in radian) and θ is Bragg's angle. Effects of strain, instruments and other defects were ignored in the calculations. The values are found to be 33 nm, 31 nm, 28 nm and 26 nm for the x = 0.0, 0.05, 0.1 and 0.15 samples, respectively. The particle size gradually decreases with increasing concentration of Ti. This variation is further supported by SEM results.
Figure 3 exhibits the SEM micrographs of the surface morphologies of all prepared samples. Ti4+ ion plays the role of donor in BFO and the addition of Ti4+ requires charge compensation by filling of oxygen vacancies. Therefore, reduction of particle size with Ti substitution may be related to the suppression of oxygen vacancies due to charge compensation mechanism [26].
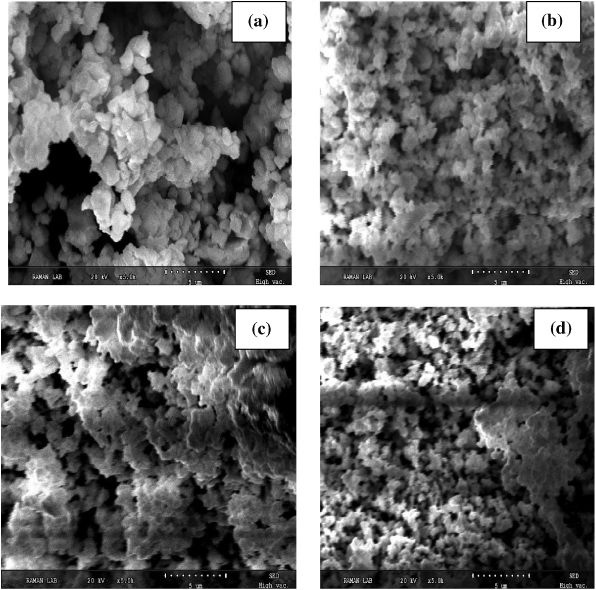
Figure 3. SEM micrographs of Bi0.8La0.2Fe1−xTixO3 (a) x = 0.0, (b) x = 0.05, (c) x = 0.1 and (d) x = 0.15 samples.
Download figure:
Standard image3.2. Dielectric properties
Figures 4(a)–(d) show the temperature dependence of real (ε') and imaginary (ε'') (inset) parts of dielectric constant at different frequencies for all the prepared samples. It clearly reflects an active role of Ti substitution in modifying dielectric behaviour of Bi0.8La0.2FeO3 multiferroic. It is clear from the figures that at a particular temperature all the samples show decreasing trend in both ε' and ε'' values with increasing frequency and reaches a nearly constant value at higher frequencies. The large value of ε' at lower frequency is due to interfacial dislocations pile ups, oxygen vacancies, grain boundary effects etc, while the decrease in ε' at higher frequency is natural because of the fact that any species contributing to polarization is found to show lagging behind the applied field at higher and higher frequencies. According to the Maxwell–Wagner model [43, 44], the dielectric material with heterogeneous structure can be imagined as a structure consisting of well conducting grains separated by high resistive grain boundaries. In this case, the applied voltage on the sample drops mainly across the grain boundaries and a space charge polarization is build up at the grain boundaries. The space charge polarization is governed by the available free charges on the grain boundary and the conductivity of the sample. Koops [45] proposed that the effect of grain boundaries is predominant at lower frequencies (i.e. higher dielectric constant for thinner grain boundaries) and grains are effective at higher frequencies. Figure 4(a) shows that both ε' and ε'' increase with the increase in temperature but an anomaly at around 463 K is observed. At low temperatures, the electric dipoles cannot orient themselves with respect to the direction of the applied field and therefore contribute weakly to the polarization resulting in low value of ε'. As temperature increases most of the electric dipoles get enough exciting thermal energy to be able to follow up the changes in the external field. This enhances the contribution of the dipoles to the polarization mechanism leading to an increase in the value of ε'. At higher temperatures, due to an increase in the number of charge carriers and their mobilities, the enhanced conductivity causes an increase in ε'' associated with conduction losses. It is well known that in perovskites, the oxygen vacancies
 could be formed in the process of sintering due to the escape of oxygen from the lattice [46].
 comes mainly from Bi volatility and the transition from Fe3+ to Fe2+ which can be described by equations (3) and (4):


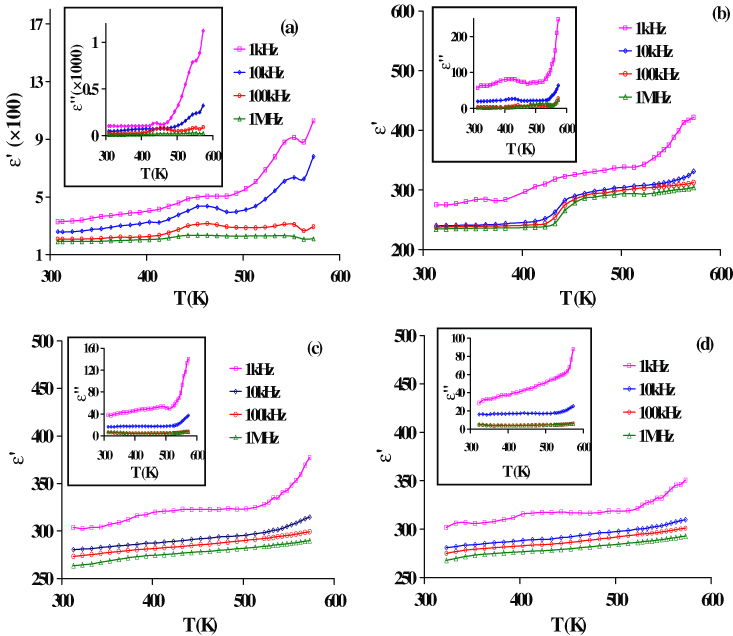
Figure 4. Temperature dependence of real (ε') and imaginary (ε'') parts of dielectric constant of Bi0.8La0.2Fe1−xTixO3 (a) x = 0.0, (b) x = 0.05, (c) x = 0.1 and (d) x = 0.15 samples at different frequencies.
Download figure:
Standard imageOxygen vacancies formed during sintering could interact with Fe3+/Fe2+ giving rise to hopping conduction between Fe3+ and Fe2+ ions, which give rise to an anomaly as shown in figure 4(a). This type of anomaly has also been reported by Catalan and Scott [8] and they have observed that this anomaly is not intrinsic type but due to charge defects. This can be interpreted as if this anomaly was not due to charge defects then it should also appear for Ti-substituted samples. But no such anomaly was observed for samples with x = 0.10 and 0.15. Therefore, this anomaly may be attributed to transient interaction between oxygen ion vacancies and Fe2+/Fe3+ redox couple. A similar type of peak is also reported in yttrium-doped BFO [47]. The absence of such an anomaly in Ti-substituted samples may be due to suppression of charge defects by the charge compensation mechanism due to higher valence of Ti4+ than Fe3+. At higher temperatures a remarkable increase in ε' manifests the occurrence of the Maxwell–Wagner effect in Bi0.8La0.2FeO3 sample [40]. However, in Ti-substituted samples (x = 0.1, 0.15) such behaviour is not so remarkable. Therefore, stability of dielectric constant with temperature is considerably improved with the increase in Ti content. A decrease in the values of ε'' with Ti substitution indicates reduced conductivity and hence enhanced resistivity in doped samples.
The phenomenon of conductivity dispersion in solids is generally analysed using Jonsher's power law,

where σdc is the dc conductivity due to excitation of electron from a localized state to the conduction bands, 'A' is pre-exponential factor and 's' is the fractional component (0 ⩽ s ⩽ 1); both 'A' and 's' are temperature and material dependent. The exponent 's' represents the degree of interaction between mobile ions with the lattice and coefficient 'A' determines the strength of polarizability. For random hopping of carriers 's' is equal to zero (frequency-independent conductivity) and tends to approach one as the correlation increases. Figure 5 depicts the frequency dependence of conductivity at various temperatures for all the samples. It is observed that the conductivity remains almost constant at lower frequencies but exhibits dispersion for higher frequencies which is well in accordance with equation (5). The experimental σ(ω) has been fitted by equation (5). A good overlap of the theoretical fitted values with experimental data is observed (figure 5). The values of 'A' and 's' obtained by fitting are listed in table 3. For the sample with x = 0.0 (figure 5(a)), σ(ω) shows temperature- and frequency-dependent behaviour in the whole frequency range. This temperature dependence decreases with an increase in Ti doping. For the sample with x = 0.15 (figure 5(d)), σ(ω) is almost independent of temperature in the whole studied frequency range. From table 3 and figure 5 it is clearly observed that stability of both 'A' and 's' parameters against temperature increase with the increase in Ti doping.

Figure 5. Variation of conductivity σ(ω) with frequency for Bi0.8La0.2Fe1−xTixO3: (a) x = 0.0, (b) x = 0.05, (c) x = 0.1 and (d) x = 0.15 samples at different temperatures.
Download figure:
Standard imageTable 3. 'A' and 's' parameters obtained from fitting of σ(ω) for Bi0.8La0.2Fe1−xTixO3 samples.
| x = 0.0 | x = 0.05 | x = 0.1 | x = 0.15 | |||||
|---|---|---|---|---|---|---|---|---|
| T(K) | A | s | A | s | A | s | A | s |
| 313 | 1.74 × 10⁻⁹ | 0.69 | 1.15 × 10⁻⁸ | 0.59 | 1.23 × 10⁻¹⁰ | 0.96 | 2.08 × 10⁻¹⁰ | 0.89 |
| 393 | 1.15 × 10⁻⁹ | 0.85 | 8.13 × 10⁻⁹ | 0.61 | 1.24 × 10⁻¹⁰ | 0.93 | 2.04 × 10⁻¹⁰ | 0.89 |
| 513 | 3.09 × 10⁻⁸ | 0.63 | 1.99 × 10⁻¹⁰ | 0.91 | 6.31 × 10⁻¹⁰ | 0.85 | 5.62 × 10⁻¹⁰ | 0.87 |
| 573 | 1.29 × 10⁻⁷ | 0.62 | 1.90 × 10⁻¹⁰ | 0.94 | 8.13 × 10⁻¹⁰ | 0.84 | 5.37 × 10⁻¹⁰ | 0.85 |
3.3. Magnetic properties
Figure 6(a) shows the RT M–H hysteresis loops of Bi0.8La0.2Fe1−xTixO3 (x = 0.0, 0.05, 0.1, 0.15) ceramics. It is obvious that non-zero remanent magnetization (Mr) and coercive field (Hc) are observed for all the samples. Magnetization curves were not saturated with the field up to 20 kOe. However, an enhancement in magnetization with the increase in Ti content is observed. Figure 6(b) shows the variation of measured remanent magnetization (Mr) as a function of Ti concentration. Mr is found to increase with the increase in Ti concentration and the corresponding values for x = 0.0, 0.05, 0.1 and 0.15 samples are 0.0048 emu g−1, 0.0119 emu g−1, 0.1373 emu g−1 and 0.1487 emu g−1, respectively. The value of Mr observed in x = 0.0 sample is consistent with the reported value for the same composition of La-modified BFO sample [48]. The appearance of remanent magnetization in Bi0.8La0.2FeO3 (x = 0.0) sample is attributed to the suppression of the spiral spin structure with 20% La doping. However, the spiral spin structure is not completely destroyed with 20% La doping. With 5% Ti doping (x = 0.05), remanent magnetization increases slowly and may be attributed to the collapse of space-modulated spiral spin structure. It is observed from structural analysis that with Ti substitution, FeO6 octahedron gets distorted and Bi–O, Fe–O bond distances and Bi–O–Fe angles get altered (table 2). The change in the bond lengths and bond angles is known to influence the magnetic properties of oxide systems, having indirect exchange interactions. Sometimes, structural distortion may associate with structural transformation (change in space group) or partial modification or change in bond length between oxygen with A (Bi) and B (Fe) site metal ions. Currently in Bi0.8La0.2FeO3 ceramic, Ti substitution (up to 5%) does not promote any major structural transformations and space group. Only partial change in unit cell volume (R3c symmetry) is observed (table 1). This partial change (reduction) in unit cell volume with Ti substitution may cause internal structure distortion relating to the change in bond lengths between the Bi–O, Fe–O and bond angle of Bi–O–Fe within the defined unit cell volume. With further increase in Ti concentration (x = 0.1), there is a sharp increase in Mr value (figure 6(b)). Structural analysis suggests that for x = 0.1 there is coexistence of rhombohedral and tetragonal phases. Both the bond length and bond angles change drastically from one cell to another in the vicinity of phase boundaries. This drastic structure change may result in a modification on the short range canted G-type antiferromagnetic order of the nearest neighbour Fe3+ spins in the rhombohedral structure. This may give a net magnetization (figure 6(a)). For the x = 0.15 sample, the crystal structure transforms from rhombohedral to tetragonal which results in a further increase in Mr. Therefore, Ti substitution (x = 0.1, 0.15) results in structural phase transition wherein the spin cycloid might be destructed and homogeneous spin structure is formed, so that the latent magnetization locked within the cycloid might be released and significant increase in Mr value is observed. The corresponding values of coercive field (Hc) are 1.805 kOe, 2.161 kOe, 4.856 kOe and 5.904 kOe for the x = 0.0, 0.05, 0.10 and 0.15 samples, respectively. The strong coercive force should mainly result from the magnetic anisotropy. The possibility of Mr and Hc values in the present samples whether from destruction of spin cycloid by phase transformation or caused by other factors such as Fe2O3 and/or Bi2Fe4O9 impurity phase cannot be ignored. The clarification is as follows: the samples have larger values of coercivities compared with Fe2O3 [<100 Oe] [49]. Therefore, it is quite unlikely that magnetization observed is a result of small Fe2O3 impurity phase. Also the impurity phase Bi2Fe4O9 observed in the sample with x = 0.15 (figure 1) is paramagnetic at RT with Curie temperature (Tc = 264 K) well below RT, contributes nothing to magnetic properties in the samples at RT. Therefore, an increase in Mr with Ti substitution results from continuous collapse of space-modulated spin structure due to phase transformation of Bi0.8La0.2FeO3 sample from rhombohedral to tetragonal.

Figure 6. (a). RT M–H hysteresis loops of Bi0.8La0.2Fe1−xTixO3 samples. (b) Concentration (x) dependence of remanent magnetization (Mr).
Download figure:
Standard image4. Conclusions
In this work the effect of Ti substitution on the crystal structure, dielectric and magnetic properties of the Bi0.8La0.2FeO3 multiferroic has been reported. Bi0.8La0.2Fe1−xTixO3 (x = 0.0, 0.05, 0.1, 0.15) ceramics were synthesized by the conventional solid-state reaction method. XRD patterns indicate the structure phase transition from rhombohedral (x = 0.0, 0.05) to tetragonal (x = 0.15) and occurrence of phase boundary at x = 0.1. The Rietveld analysis shows that XRD pattern for x = 0.1 is well fitted with the combination of both rhombohedral and tetragonal phases. A decrease in the values of real (ε') and imaginary (ε'') parts of dielectric constant with Ti substitution indicates reduced conductivity and hence enhanced resistivity in doped samples. Stability of dielectric constant and conductivity with temperature is considerably improved with Ti substitution. A significant enhancement in magnetization for Ti-doped samples is observed. The values of remanent magnetization (Mr) are 0.1373 emu g−1 and 0.1487 emu g−1 and the corresponding values of coercive field (Hc) are 4.856 kOe and 5.904 kOe for x = 0.1 and 0.15 samples, respectively. It is the structure phase transition that is responsible for the significantly enhanced magnetic properties of the x = 0.1, 0.15 samples, because it destroys the spin cycloid and releases the locked magnetization. The improved magnetic properties for x = 0.1 and 0.15 samples suggest that these materials can act as promising candidates for data storage media.
Acknowledgments
The authors are grateful to DST, New Delhi (FIST Scheme), for providing XRD facilities.