
Abstract
Lead-free (1 − x)Bi0.5Na0.5TiO3–xBi0.5K0.5TiO3 [(BNKTx); x = 0.18, 0.20, 0.22, 0.24] piezoelectric ceramics were prepared via conventional solid-state reactions. Phase characterization using x-ray diffraction showed coexistence of perovskite rhombohedral and tetragonal polymorphs as anticipated for compositions across the morphotropic phase boundary (MPB). Electrical and electromechanical properties were studied as a function of x. Permittivity and polarization figures were comparable to the best values previously reported. Largest piezoelectric and high field electromechanical responses were obtained for BNKT0.20 samples, considered to have optimum MPB phases. This material exhibited giant field-induced strains of 0.13% and 0.38% under electric fields of 1 and 2.4 kV mm−1 at room temperature by a phase-change mechanism. Figures are comparable to those reported for other BNT-based systems, but under significantly lower driving fields, which is a clear advantage for actuation.
Export citation and abstract BibTeX RIS
1. Introduction
Ferroelectric (FE) perovskite materials have found extensive applications in electrical devices such as piezoelectric motors and generators, transducers, sensors and actuators. So far, the lead-based perovskites, namely Pb(Zr,Ti)O3 (PZT) and PZT-based compounds as well as Pb(Mg1/3Nb2/3)O3 (PMN) and its associated solid solutions, have been proved to be excellent piezoelectric and electrostrictive ceramics [1–3]. Despite their superior electromechanical properties, lead-based materials need to be replaced by lead-free compounds due to environmental issues related to the toxicity of lead. Different families of FE perovskites such as niobates, tantalates and titanates have been considered as possible replacements [4, 5], among which Bi0.5Na0.5TiO3 (BNT) based materials and, especially its solid solution with Bi0.5K0.5TiO3 (BKT), stand out for their enhanced properties at the morphotropic phase boundary (MPB) [6].
Bismuth sodium titanate (BNT), discovered by Smolenskii et al [7], is a FE material which undergoes two successive polymorphic phase transitions upon heating, from a room temperature (RT) rhombohedral (R3c) to a tetragonal (P4bm) structure at ∼300 °C (TR−T), and to a cubic
 phase at ∼540 °C [7–10]. The material also suffers depolarization at ∼185 °C, above which antiferroelectric (AFE) behaviour is reported by some authors, and shows a maximum in dielectric permittivity at ∼320 °C [11–13], that signals the ferroelectric-to-paraelectric transition. The relationship between crystal structure and electrical features, specifically the structural origin of the polarization loss, is the focus of intensive research [14]. In relation to the RT FE phase, BNT exhibits a remanent polarization of Pr = 38 µC cm−2 and a coercive field of Ec = 73 kV cm−1 [7]. The high value of coercive field and the relatively high electrical conductivity of this material are considered to be its principal drawbacks [6, 15]. The former makes domain switching and thus poling difficult and the latter results in high dielectric loss (tan δ). In order to overcome these problems, suitable modifier compounds are sought after, which can form a MPB with BNT. This would not only decrease the coercive field, but also enhance the electromechanical response significantly. Compounds such as barium titanate (BT), sodium niobate (NN), potassium niobate (KN) and bismuth potassium titanate (BKT) all possess perovskite structure and form solid solutions with BNT [16, 17]. Tetragonal structures, and lone pair A-site cation oxides are preferred [18], hence bismuth potassium titanate (BKT) is especially promising.
This compound was also discovered by Smolenskii et al in 1961 [7]. The RT tetragonal phase has a remanent polarization of ∼22 µC cm−2 [19], and undergoes the FE transition at ∼380 °C [20]. Polymorphic phase transitions have not been reported, yet a depolarization temperature has been observed at ∼310 °C analogously to BNT [19]. Most importantly, its solid solution with BNT; (1 − x)Bi0.5Na0.5TiO3–xBi0.5K0.5TiO3 (BNKTx) presents a MPB for x values in the 0.16–0.20 range [6, 20].
The resultant compound BNKTx is a complex FE oxide with the perovskite structure, the three cations: Bi+3, Na+ and K+ all occupying the A-site of ABO3 structure with the atomic ratio of the Bi+3 to the combined (Na+, K+) ions being always unity. In analogy with PZT, the MPB compositions of BNKT exhibit superior piezoelectric properties [20]. In spite of this, an in-depth study of its high electric field electromechanical response, that is the actuation characteristics, has not been carried out. Hiruma et al [17] reported figures for the RT high-field (to 9 kV mm−1) effective piezoelectric coefficient
 across the MPB with a maximum value of 291 pm V−1 for x = 0.22. However, neither the strain curves nor the field dependence were addressed.
In the present work, we report the high-field electromechanical response of high-quality BNKTx ceramic materials across its MPB. Piezoelectric charge (d33) coefficients significantly larger than those previously reported were obtained after poling. Strain under increasing electric fields and at temperatures between RT and the depolarization temperature is presented as a function of composition. Furthermore, mechanisms responsible for the very high strain are discussed.
2. Experimental procedure
(1 − x)(Bi0.5Na0.5)TiO3–x(Bi0.5K0.5)TiO3 samples abbreviated to BNKTx with x = 0.18, 0.20, 0.22 and 0.24 were prepared using a conventional ceramic route. Raw materials, Bi2O3 (99.9%, Aldrich), Na2CO3 (99.95%, Aldrich), K2CO3 (>99.0%, Aldrich) and nano-sized TiO2 (Degussa—75% anatase, 25% rutile), were used. The powders were weighed according to the molar ratios in the chemical formula and milled in a planetary mill at 180 rpm for 2 h in ethanol. Zirconia jar and balls were employed. The milled powder was dried and calcined at 850 °C for 2 h. The calcined powder was reground for 3 h, and then, uniaxially pressed at 250 MPa into pellets of 13 mm diameter and 1 mm thickness. The compacts were sintered at 1150 °C for 2 h in closed alumina crucibles using heating/cooling rates of 5 °C min−1. After removal of the surface layer of the sintered pellets, density measurements were carried out by the Archimedes method.
X-ray diffraction (XRD) of the sintered ceramics was carried out using a Siemens D500 powder diffractometer with Cu Kα radiation. A 2θ range from 20° to 50° was scanned in steps of 0.05° with a counting time of 3 s/step. Ceramic microstructures were characterized with a field-emission scanning electron microscope (NOVA Nano SEM 230). Samples were polished using Al2O3 particle suspensions with sizes down to 0.1 µm, followed by thermal etching at 800 °C for 20 min. Chemical composition was controlled by energy dispersive x-ray spectroscopy (EDXS, Oxford INCA 250).
Silver paste electrodes were sintered on the surfaces of the ceramic discs at 600 °C for 1 h for the electrical and electromechanical characterizations. The temperature dependence of the dielectric permittivity was measured on heating at 2 °C min−1 over several frequencies between 0.1 and 1000 kHz using an HP 4284 A precision LCR meter. The polarization versus electric field (P–E) hysteresis loops were recorded at RT. Voltage sine waves of 0.1 Hz was applied using a combination of synthesizer/function generator (HP 3325B) and a high voltage amplifier (TREK model 10/40) and the charge was measured by a home built charge-to-voltage converter. For piezoelectric characterization, the ceramic specimens were poled under 4 kV mm−1 at 150 °C for 15 min. The piezoelectric coefficient (d33) was measured after 24 h with a Berlincourt type meter. The transverse piezoelectric coefficient (d31) was also obtained by complex analysis of piezoelectric radial resonances of the discs by an automatic iterative method described elsewhere [21]. The actuation characteristics were characterized by measuring the direct longitudinal deformation of the discs under positive (parallel to the polarization) fields up to 2.4 kV mm−1. Driving voltages of biased sine waves at a frequency of 0.1 Hz were applied by a combination of a digital signal generator (NI-SCXI 1302) and a bipolar operational power supply/amplifier (KEPCO BOP 1000 M), while deformation was measured with a linear variable differential transducer.
3. Results and discussion
3.1. Phases and microstructure
The XRD patterns of the BNKTx samples with different values of x are shown in figure 1(a), indicating only perovskite phases for all samples (Miller indices in the figure correspond to the pseudocubic symmetry). The splitting of the (1 1 1) reflection in the 39°–41° 2θ range (figure 1(b)) is due to rhombohedral symmetry (assigned to the (1 1 1)/
 reflections) like that of BNT, whereas the peak splitting of (0 0 2)/(2 0 0) in the 45°–48° 2θ range (figure 1(c)) is due to tetragonal symmetry like that of BKT. The splitting of both peaks indicates the coexistence of perovskite rhombohedral and tetragonal polymorphs at these MPB compositions in the BNKTx solid solutions as anticipated [6]. By increasing x from 0.18 to 0.24, the potassium-to-sodium ratio is raised, and the diffraction peaks are systematically shifted towards lower 2θ angles as seen in figures 1(b) and (c), indicating the lattice expansion [20]. Not surprisingly, the percentage of tetragonal phase increases with x.
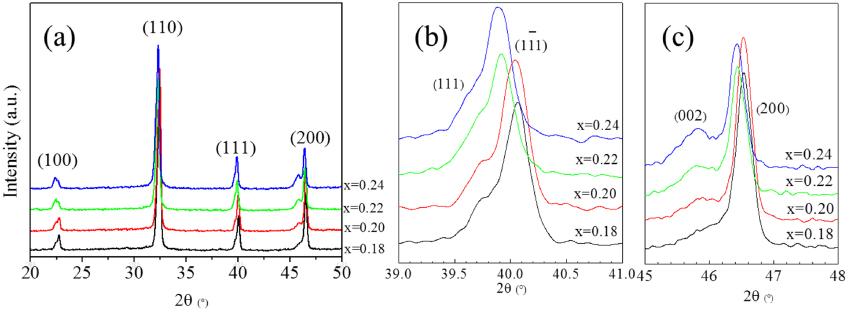
Figure 1. XRD patterns of the BNKTx ceramics (x = 0.18–0.24) in the 2θ ranges of (a) 20°–50°, (b) 39°–41° and (c) 45°–48°, Miller indices are indicated.
Download figure:
Standard image High-resolution imageFigure 2(a) shows a typical microstructure of the BNKT0.20 sample. Since all the samples were prepared using the same processing parameters, particularly, sintering temperature and soaking time, significant differences in grain size distribution or porosity across the MPB region were not found; that is, a dense and homogeneous microstructure with an average grain size of about 1 µm was consistently obtained. EDXS standardless chemical analysis indicated nominal composition (spectrum for BNKT0.20 is given in figure 2(b) as an example). However, this technique is not sensitive enough to detect the small deviations in K/Na ratio among the different samples. The density values of all sintered bodies, relative to the theoretical densities, are above 98%, except for BNKT0.24 that was 95%. These relative densities are presented in table 1.

Figure 2. (a) SEM micrograph and (b) EDXS spectrum of the BNKT0.20 sample.
Download figure:
Standard image High-resolution imageTable 1. Dielectric permittivity (εr), losses (tan δ), and frequency independent depolarization temperature (Td) all at 10 kHz, temperature of maximum permittivity (Tm) at 1000 kHz, relative density, electromechanical planar coupling factor (kp), longitudinal (d33), transverse (d31) and effective
piezoelectric coefficients determined for the BNKTx ceramics (x = 0.18–0.24).
| Composition | x = 0.18 | x = 0.20 | x = 0.22 | x = 0.24 | References |
|---|---|---|---|---|---|
| Relative density (%) | 98.2 | 98.5 | 98.7 | 95.5 | 97.6 [44] |
| εr (at RT) | 1344 | 1743 | 1518 | 1209 | 1030 [6], 1140 [20], 945 [38] |
| tan δ (at RT) | 0.048 | 0.053 | 0.060 | 0.056 | 0.076 [20], 0.020 [38] |
| Td (°C) | 130 | 100 | 71 | 65 | — |
| Tm (°C) | 271 | 284 | 313 | 320 | — |
| d33 (pC N−1) | 150 | 195 | 160 | 125 | 134 [20], 168 [17], 190 [44] |
| d31 (pC N−1) | −34 + 1.077i | −39.56 + 1.031i | −37.56 + 2.286i | −28 + 1.872i | — |
 |
560 | 1320 | 440 | 360 | 291 [17] |
| kp (%) | 26.71 | 27.03 | 22.47 | 15.41 | 35.24 [44] |
3.2. Dielectric properties
Figure 3 shows the temperature dependence of dielectric permittivity (εr) and losses (tan δ) for all ceramic samples at different frequencies, namely 0.1, 1, 10, 100 and 1000 kHz. In all cases, the maximum of dielectric permittivity (εm) is partially masked with a dielectric relaxation, which is better seen in the tan δ curves. This type of dielectric response overlapping with the FE transition anomaly is often observed in perovskite-type oxides, and it is attributed to the presence of defects in the material, such as oxygen vacancies and Maxwell–Wagner type polarization mechanisms due to blocking of mobile ions at interfaces and/or grain boundaries [22].
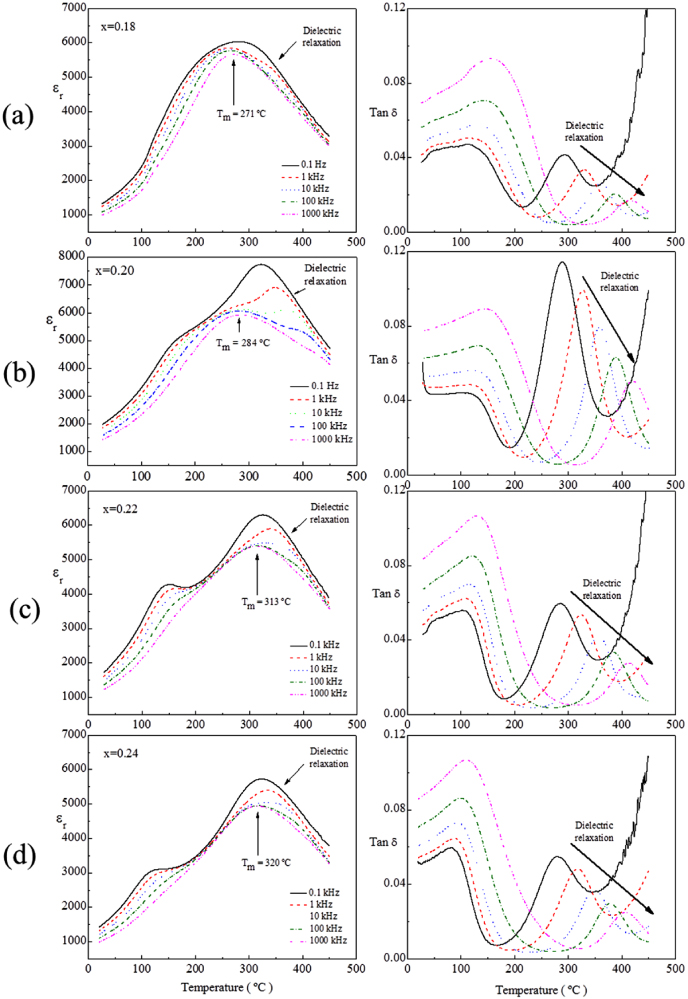
Figure 3. Temperature dependence of εr and tan δ of the BNKTx samples at 0.1–1000 kHz frequency interval for x values of (a) 0.18, (b) 0.20, (c) 0.22 and (d) 0.24.
Download figure:
Standard image High-resolution imageFigure 4 shows the results of an Arrhenius-type analysis of the dielectric loss maxima for this dielectric relaxation above Tm, using the following equation:

where Ea is the activation energy, kB the Boltzmann parameter, T is the absolute temperature and ω = 2πf. Results showed activation energies about 2.5 eV with no systematic dependence on the composition. This value is far beyond those usually reported for oxygen vacancy ionization [23], and it could be rather associated with the release of ionic defects trapped at the domain walls when the material undergoes the FE transition [24].
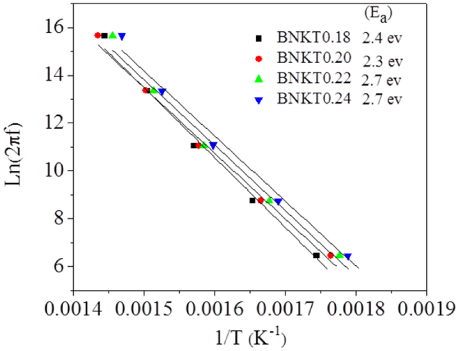
Figure 4. Ln (2πf) as a function of (1/T) of the BNKTx ceramics (x = 0.18–0.24).
Download figure:
Standard image High-resolution imageNevertheless, and back to the transition, the temperature of maximum permittivity (Tm) can be clearly distinguished in the curves at 1000 kHz, a frequency at which the relaxation has shifted well above Tm. On the other hand, the permittivity curves in all cases, aside from the peak of maximum permittivity, exhibit a lower temperature shoulder which is the least pronounced for the BNKT0.18 sample. It is observed that an increase in the potassium-to-sodium ratio results in higher Tm values, which are also tabulated in table 1. Note that BNT and BKT show the FE transition at 300–320 °C and 380 °C, respectively, so an increase across the solid solution is expected.
The broad maxima observed in the permittivity curves might indicate the existence of a diffuse phase transition or even a high temperature relaxor state in the BNKTx system, as previously reported [25]. In fact, a modified Curie–Weiss law can be applied as

where C and γ are the Curie constant and the diffusion exponent, respectively [26]. γ ranges between 1 and 2 for FE materials. When γ = 1, the above relation reduces to the simple Curie–Weiss law and the material is a classic perovskite FE and when it approaches 2, a relaxor-type FE behaviour is obtained. Intermediate values are associated with diffuse phase transitions. The ln((1/εr) − (1/εm)) versus ln(T − Tm) is plotted in figure 5 for BNKTx at 1000 kHz. The slopes of the lines (γ values) for different compositions lie in the 1.83–1.98 interval which is very close to the value for relaxor ferroelectrics.
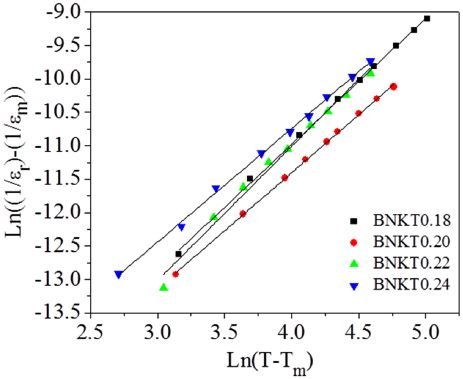
Figure 5. ln((1/εr) − (1/εm)) as a function of ln(T − Tm) of the BNKTx ceramics (x = 0.18–0.24) at 1000 kHz.
Download figure:
Standard image High-resolution imageIn relation to the lower temperature anomaly, it has been previously associated with the depolarization event, and a number of different methods have been suggested to define the characteristic temperature (Td) for a ceramic sample [27, 28]. Unfortunately, a consensus has not been reached but the work of Hiruma et al [29] provides a good basis for estimating the values of Td from the first peak of tan δ curves in fully poled samples. Figure 6 illustrates the plots of the dielectric permittivity versus temperature for both the poled and unpoled BNKTx samples at the frequency of 10 kHz. There is a discontinuity in tan δ versus temperature which manifests itself as a spike in poled samples at lower temperatures. These spikes, unlike the first maxima in tan δ curves of the unpoled samples are frequency independent and better indicators of the depolarization temperatures (Td) according to these authors [17]. It is observed that an increase in the potassium-to-sodium ratio results in lower Td values, which are also tabulated in table 1.
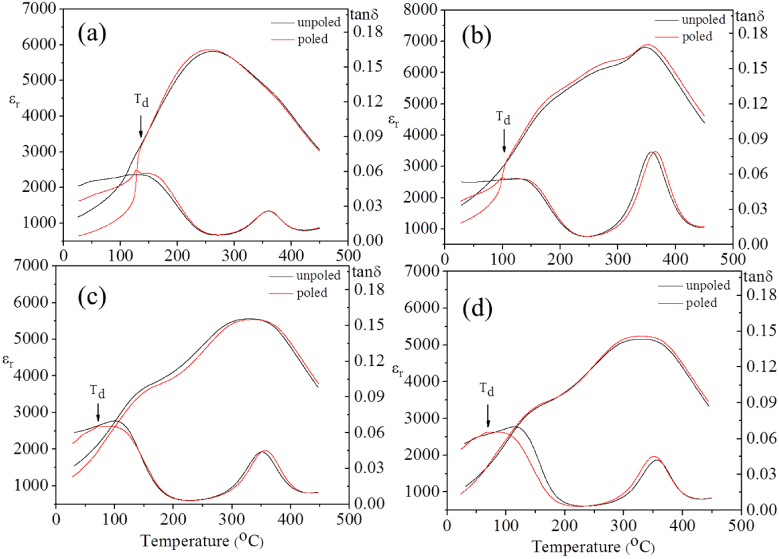
Figure 6. Temperature dependence of εr and tan δ of both poled and the unpoled BNKTx samples at 10 kHz for x values of (a) 0.18, (b) 0.20, (c) 0.22 and (d) 0.24.
Download figure:
Standard image High-resolution imageIn table 1, the values εr and tan δ for all the compositions at RT have been compared with similar reports. The reported values are for the samples in the unpoled state. Note that permittivity values are significantly higher than those in the literature, while comparable losses are observed, which suggest the high quality of the samples. Note that dispersion is not caused by electrical conduction for losses increase with frequency—a characteristic typical of relaxor systems. This suggests the existence of different scale domains within the FE phase, a phenomenon widely observed in relaxor-based ferroelectrics such as Pb(Mg1/3Nb2/3)O3–PbTiO3 [30]. A maximum of permittivity occurs at x = 0.20, where the MPB is thought to be placed.
3.3. FE properties
The P–E hysteresis loops of BNKTx samples for different values of x are plotted in figure 7(a). The measurements were carried out on the unpoled samples. Conventional loops close to saturation were obtained for all samples except for BNKT0.24, for which a pinched loop was plotted. The coercive field (Ec) is observed to systematically decrease with x, from 3.2 kV mm−1 for x = 0.18 down to 1.3 kV mm−1 for x = 0.24, with an abrupt reduction for x = 0.22 (see figure 7(b)), from which pinched loops start to develop. Remanent polarizations between 28 and 37.5 µC cm−2 are obtained, with a maximum for x = 0.20. Like permittivity figures, these values are significantly larger than those previously reported for BNKT system [6]. It is observed that increasing the potassium-to-sodium ratio, in general, results in thinner hysteresis loops. In several reports, the presence of AFE order in BNT-based ceramics has been presumed to be the cause of the pinched loops [31, 32]. However, similar loops have also been reported in relaxor systems such as PLZT and PMN-0.1PT, at the onset of FE long-range order [33, 34].
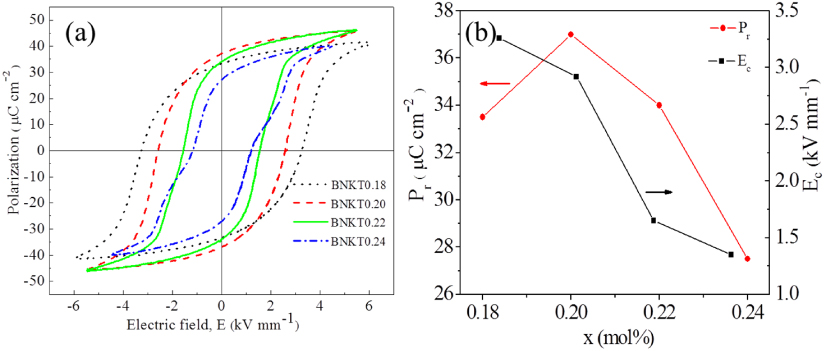
Figure 7. (a) Polarization hysteresis loops (P–E) of the BNKTx ceramics for different values of x, (b) remanent polarization (Pr) and coercive field (Ec) as functions of x in the BNKTx at RT.
Download figure:
Standard image High-resolution imageIn these perovskite ferroelectrics, the pinched loops are not attributed to the presence of AFE phases but rather to the presence of a 'non-polar' or 'weakly polar' phase converting to a polar phase upon the application of the electric field [33]. With regard to the significant values of Pr, even for the BNKT0.24 (figure 7), the constriction may be due to the presence of a non-polar or weakly polar phase in the BNKT system. Indeed, there has been no solid confirmation of a FE–AFE transition in BNT-based ceramics above Td. It is possible that the constriction in the hysteresis loop of BNKT0.24 is due to electromechanical interaction between the polar and non-polar regions [35, 36]. As a matter of fact, the latest works on BNT-based system relate the depolarization event to a destruction of FE long-range order at a transition to a non-identified short-range polar state [37]. Whatever the mechanism, pinched loops correlate with the continuous decrease of the depolarization temperature.
3.4. Electromechanical properties
The longitudinal and transverse piezoelectric coefficients (d33, d31) and the electromechanical planar coupling factor (kp) of all compositions have been compared with those of previous reports in table 1. Figures favourably compare with previously reported values for the system, as permittivity and polarization ones did [17, 38]. To estimate the suitability of BNKTx for actuator applications the strain responses of the samples under unipolar electric field were measured. Figure 8(a) shows the unipolar electric field–induced strain curves of ceramics for different values of x under 1 kV mm−1. Induced-field strain shows a maximum for x = 0.20, like the d33 piezoelectric coefficient, confirming this composition to be the MPB one. A strain as high as S = 0.13%, was obtained for x = 0.20 under this field. The corresponding effective piezoelectric coefficients
as a function of increasing field are plotted in figure 8(b). Note the remarkable value of 1000 pm V−1 under 0.2 kV mm−1 that increases up to 1320 pm V−1 under 1 kV mm−1. This value is significantly higher than those of soft PZT and approaches those of textured PMN-PT [39].
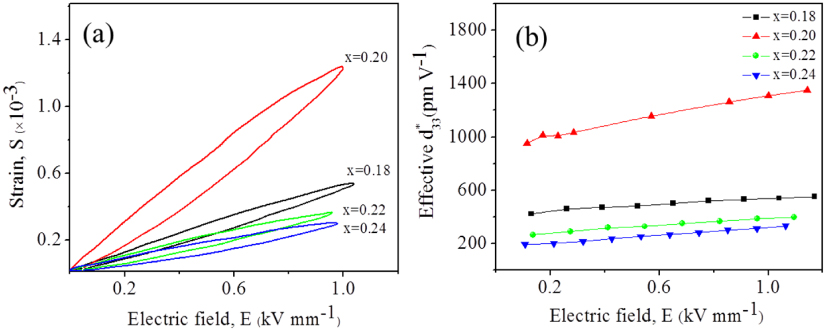
Figure 8. (a) The unipolar strain (S–E) loops, (b) the effective piezoelectric coefficient values
of BNKTx ceramics (x = 0.18–0.24).
Download figure:
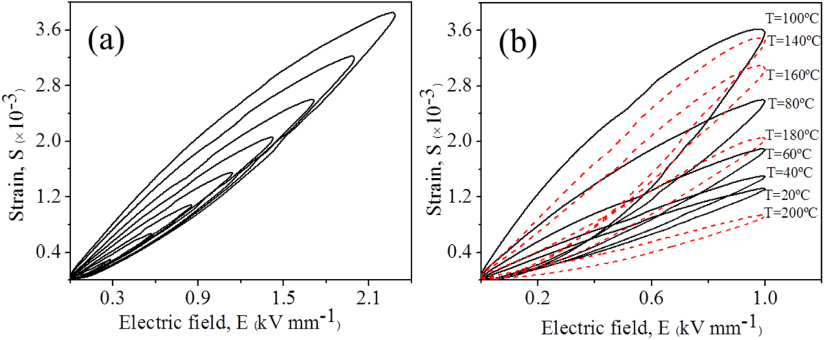
Standard image High-resolution imageThe x = 0.20 composition was further tested under higher electric fields (figure 9(a)) and as a function of temperature (figure 9(b)). An outstanding strain level of 0.38% was obtained under 2.4 kV mm−1 at RT
 of 1650 pm V−1). Furthermore, a similar strain can be developed at 100 °C under only 1 kV mm−1. This is the temperature at which strain is maximum, and it is also the depolarization temperature for this composition. Giant strains as high as 0.45%, have been reported for lead-free compositions such as BNT–BT–KNN under an electric field of 8 kV mm−1 [31], BNT–KN under 9 kV mm−1 (0.4%) [17], and BNT–SrTiO3 under 6 kV mm−1 (0.29%) [40].
Figure 9. The unipolar (S–E) loops of the BNKT0.20 ceramic (a) at RT and (b) at different temperatures.
Download figure:
Standard image High-resolution image
This giant strains in BNT-based systems are thought to occur for compositions with depolarization temperature close to RT, associated with an electric field induced phase change between the short-range polar state and long-range FE order [41]. Similar strain levels have been obtained here for BNKT0.20. The S–E curves (figure 9(b)) show the typical features of a phase-change electromechanical response; an initial increase of slope with temperature at a fixed electric field up to Td showing a large hysteresis which then decreases with increasing temperature [42]. Therefore, one can assume that the same mechanism is active in the BNKT system, as already suggested [43]. The development of such high strain at a much lower electric field for this system is a major novelty, which is a clear advantage for actuation.
It is not clear at this point why BNKT is able to deliver the phase-change strain at a much lower electric field than other materials. Indeed, previous reports for BNKT0.20 [43] or BNKT0.22 [45] indicate much larger threshold fields. This might be related to an effect of microstructure or even defect chemistry that has not been addressed up to now. The low-temperature FE state has clearly an important role because larger strains might be expected for x = 0.24 than for 0.20 because of its lower depolarization temperature. The RT phases of BNKTx across the MPB have been recently shown to present large complexity with a hierarchical structure at different scales [46]. Effects of grain size on phases have been described in lead-containing MPB systems [47]. Therefore, the electromechanical response of a specific BNT-based system seems to result from a delicate interplay between composition, defect chemistry and microstructure.
4. Conclusions
Lead-free BNKTx piezoceramics with x ranging between 0.18 and 0.24 have been synthesized using a conventional solid state reaction ceramic method. It has been established that all compositions exhibit pure perovskite ferroelectric phase. The dielectric, ferroelectric, and piezoelectric properties of the samples were investigated and it was found that BNKT0.20 showed optimum properties. Although a range of x = 0.16–0.20 has previously been suggested as the MPB region [6], our results indicate that x = 0.20, indeed, constitutes the best choice for the MPB composition in the system. The dielectric studies suggest that BNKTx at the MPB region might be a relaxor ferroelectric. They also show well-defined depolarization temperatures which decrease with an increase in BKT content, confirmed by the evolution of the ferroelectric hysteresis loops. A very large phase-change electromechanical response with a strain as high as S = 0.13% was obtained at 1 kV mm−1 for BNKT0.20. Larger strain (S = 0.38%) could be attained at higher fields (2.4 kV mm−1) or temperatures (100 °C). These driving fields are significantly lower than those previously reported for BNT-based systems with similar giant electric field induced strain, and are a clear advantage for actuation.
Acknowledgments
Research was funded by Materials & Energy Research Center (MERC) (PhD Project Grant No 488973) and the Spanish former MICINN (now MINECO) through project MAT2011-23709. A M acknowledges support from MERC to go to Spain and Spanish National Research Council for the six-month period spent at the Instituto de Ciencia de Materiales de Madrid.