

Abstract
Cold atmospheric pressure plasma (CAP) inactivates bacteria and virus through in situ production of reactive oxygen and nitrogen species (RONS). While the bactericidal and virucidal efficiency of plasmas is well established, there is limited knowledge about the chemistry leading to the pathogen inactivation. This article describes a chemical analysis of the CAP reactive chemistry involved in the inactivation of feline calicivirus. We used a remote radio frequency CAP produced in varying gas mixtures leading to different plasma-induced chemistries. A study of the effects of selected scavengers complemented with positive control measurements of relevant RONS reveal two distinctive pathways based on singlet oxygen and peroxynitrous acid. The first mechanism is favored in the presence of oxygen and the second in the presence of air when a significant pH reduction is induced in the solution by the plasma. Additionally, smaller effects of the H2O2, O3 and  produced were also found. Identification of singlet oxygen-mediated 2-imidazolone/2-oxo-His (His +14 Da)—an oxidative modification of His 262 comprising the capsid protein of feline calicivirus links the plasma induced singlet oxygen chemistry to viral inactivation.
Export citation and abstract BibTeX RIS
1. Introduction
Bacteria, including those resistant to antibiotics, can be inactivated successfully in vitro and in vivo using cold atmospheric pressure plasma (CAP) [1–3]. Recently, effective virucidal activity of CAP has also been reported [5, 6]. CAP generates ultraviolet light (UV), electric fields and a complex mixture of reactive oxygen and nitrogen species (RONS), many of which are potent to inactivate bacteria [1, 3]. While the bactericidal and virucidal efficiency of plasmas is well established there is on ongoing debate about the chemical action pathway leading to pathogen inactivation by CAP. This is partly due to the complex mixture of RONS produced by CAPs. The inactivation mechanisms of virus by CAP are unexplored [6]. The key species produced by plasmas believed to be involved in pathogen inactivation are 1O2, •OH,  /
/ , H2O2, O3, •NO, ONOOH/ONOO−,
  ,
,  and HNO2 [1, 3, 7–11]. While fundamental studies of RONS interaction with pathogens in the context of CAP are limited, there exist a large number of studies of specific ROS interactions with bacteria and viruses [12–16], especially pertaining to antimicrobial and antiviral photodynamic therapy [17–20].
In this work, we present a detailed study of the virucidal inactivation mechanisms of remote radio frequency CAP produced in varying gas mixtures. For the particular remote plasma used in this work the virucidal action is due to the complex mixture of RONS produced. UV and electric fields are not involved in the inactivation process [3]. Feline calicivirus (FCV), a surrogate to norovirus, is used in this study as a model for non-enveloped ribonucleic acid (RNA) viruses. An analysis is made of the key reactive oxygen and nitrogen species (RONS) responsible for the virucidal action of the plasma and two modes of action will be identified. The identified species are linked with proteomics results of the modified amino-acids of the capsid protein of the virus.
2. Materials and methods
2.1. Virus and antiviral assay
Strain 255 of FCV was used. The virus was grown and titrated in Crandell–Reese feline kidney (CRFK) cells. The propagation and purification of the virus are described in detail in [5]. Virus titers were calculated by the Kärber method [21] and expressed as log10 TCID50 /0.1 ml (Log the 50% tissue culture infectious dose/0.1 ml).
2.2. Chemicals
Titanium sulphate, sulphuric acid, hydrogen peroxide, potassium permanganate, oxalic acid, rose Bengal (RB), xanthine, xanthine oxidase (XOD), sodium hydroxide, ethylenediaminetetraacetic acid (EDTA), phosphate buffer solution (PBS), hydrochloric acid, ferrous sulphate, sodium nitrate, sodium nitrite, methanol, uric acid assay kit (MAK077) were purchased from Sigma Aldrich. Scavengers—L-histidine, D-mannitol, sodium azide, SOD (S 7446), sodium pyruvate, ascorbic acid and uric acid- were purchased from Sigma Aldrich. Carboxy 2-phenyl-4,4,5,5-tetramethulimidazoline-1-oxyl-3-oxide (PTIO) (C-7921), SOSG (S-36002), fluorescein (F 1300), Griess assay kit (G-7921) were purchased from Molecular Probes/Life Technologies.
2.3. Plasma generation system
The plasma source used in this study was a radio-frequency (RF) atmospheric pressure plasma jet. It has been previously described in [3]. The plasma was ignited in argon (with 1% admixture of molecular gases) blown through a 1.9 mm quartz tube at 1.5 standard liters per minute (slm). A schematic of the setup is shown in figure 1. The RF power (13.56 MHz) was modulated at a frequency of 20 kHz with a duty cycle of 20%. The power of the jet was 2.5 W and the visible plasma region of the jet was not in contact with the liquid. In this study, four different gas mixtures—Ar, Ar + 1% O2, Ar + 1% air and Ar + 0.27% H2O—were used. In the case of Ar + 0.27% water, part of the argon flow was sent through a bubbler containing sterile distilled water to humidify the argon gas feed. Aliquots (100 μl) of FCV suspended in sterile distilled water or NaCl-Tris-EDTA buffer (NTE) were placed in 96 well microtiter plates and then exposed to various plasmas. The distance between the nozzle of the jet and the surface of virus suspension was kept constant at 11.25 mm. Plasma-treated and non-treated (control) samples of FCV were titrated and compared to determine the amount of inactivated virus after a two hours of incubation of the virus in the plasma treated liquid at room temperature. We have previously shown that the duration of the plasma treatment of 2 min is sufficient to achieve a large inactivation of the virus [5].
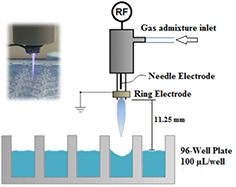
Figure 1. Schematic diagram of the experimental plasma setup and treatment condition.
Download figure:
Standard image High-resolution imageThe plasma jet has been studied in detail (see e.g. [3, 11]). The gas temperature can exceed 500 K inside the nozzle but is close to room temperature at the position of the liquid surface [3]. The effect of heating of the liquid sample by the plasma and the plasma produced UV and electric fields are negligible for the treatment conditions used [3]. In addition, the density of charged species in non-touching conditions is significantly lower than the neutral reactive species [4]. The four different gas mixtures—Ar, Ar + 1% O2, Ar + 1% air and Ar + 0.27% H2O—lead to a rich and diverse set of reactive species impinging on the liquid surface. The dominant gas phase reactive species include singlet oxygen, O•, O3, H2O2, •NO and HNO2 [11].
2.4. Scavenger measurements
Different specific scavengers were selected to perform an initial assessment of the plasma-produced reactivity. The virus was suspended in filter-sterilized scavenger solutions prepared separately in sterile distilled water and NaCl-Tris-EDTA (NTE) buffer (pH 7.4). The concentrations of scavengers are shown in table 1. Aliquots (100 μl) of each virus-scavenger solution were exposed in 96 well plates to the Ar, Ar + 1% air, and Ar + 1% O2 plasmas for different treatment times. The titers of surviving FCV in distilled water or NTE buffer with and without scavengers were measured and compared to assess the suppression effect of each scavenger, which indirectly indicated the species involved in the virucidal activity. For each scavenger a scavenger-control test was also carried out, in which the virus was suspended in the scavenger solution without exposure to plasma to ensure that there was no virucidal effect of the scavenger itself on the virus.
Table 1. Rate constants for reactions of scavengers with relevant reactive species. The concentration of the scavenger used in this work is included.
| Scavenger | Reactive species | Rate constant (M−1 s−1) | Concentration of scavenger | References |
|---|---|---|---|---|
| Ascorbic acid | ONOOH | 1 × 10⁶ (pH 5.8) | 20 mM | [56] |
| Ascorbic acid | •OH | 1.1 × 10¹⁰(pH 1.5) | 20 mM | [57] |
| Carboxy-PTIO | •NO | 1.0 × 10⁴ (pH 7.4) | 100 μM | [58] |
| D-Mannitol | •OH | 2.7 × 10 9 (pH 7) | 0.15 M | [59] |
| D-Mannitol | 1O2 | Less than 103 | 0.15 M | [59] |
| L-Histidine | •OH | 5 × 10⁹ (pH 6–7) | 0.15 M | [59] |
| L-Histidine | 1O2 | 3.2 × 10⁷ (pH 7.1) | 0.15 M | [59] |
| L-Histidine | O3 | 3.9 × 10³ (pH 7) | 0.15 M | [59] |
| SOD |  |
2 × 10⁹ | 500 U | [31] |
| Sodium azide | 1O2 | 2.2 × 10⁹ | 5 mM | [59] |
| Sodium azide | •OH | 1.1 × 10¹⁰ (pH 9) | 5 mM | [59] |
| Sodium pyruvate | H2O2 | 10 mM | [60] | |
| •NO |  |
1.6 ± 0.3 × 10¹⁰ | [31] | |
| Uric acid | ONOO− | 155 (pH = 7.4) | 100 μM | [61] |
| Uric acid | O3 | 1.4 × 10⁶ | 100 μM | [62] |
| Uric acid | •OH | 7.2 × 10⁶ | 100 μM | [63] |
2.5. Positive control experiments of selected species
2.5.1. Singlet oxygen.
In this experiment, FCV in a solution containing RB was exposed to a light to create singlet molecular oxygen (1O2) [22]. A Schott Halogen light source with a 150 W bulb (Osram, Germany) was used as a light source to excite the RB. The distance between the optical fiber through which the light was delivered and the top of the well plate was kept constant at 5 cm for all measurements. A non-transparent plate with a hole in the center matching exactly the area of a single well of a 96 well plate was in place to confine the irradiation to a single well. The measurements were performed for a well containing 100 μl of solution. Control experiments were carried out in the presence of light but in the absence of RB and with RB only. One more experiment was conducted in the presence of 150 mM L-histidine (as a scavenger of singlet oxygen). The concentration of the generated singlet oxygen was also measured (see section 3.3.1.).
2.5.2. Superoxide radicals.
Superoxide/hydroperoxyl radicals ( /
/  ) were generated by the enzymatic reaction of XOD with xanthine in situ as per the protocol of Sigma Aldrich [23].
The generated  was indirectly detected and quantified by detecting and quantifying the generation of uric acid as a secondary product of the enzymatic reaction. Generated uric acid was determined calorimetrically at 570 nm using a uric acid assay kit (Sigma Aldrich, St. Louis, MO) as per manufacturer's protocol.
2.5.3. Hydroxyl radicals.
Hydroxyl radicals were generated in situ by Fenton's reaction [24]—mixing equal volumes of equimolar solutions of H2O2 and ferrous sulfate (FeSO4). FCV was suspended in equal volumes (100 μl) of equimolar solutions (5.5 mM and 50 μM) of FeSO4 and H2O2 at pH 6.5 and 7.4 for mimicking plasma conditions of Ar + 0.27% water and Ar + 1% O2 in NTE buffer respectively. After 2 h post-treatment the surviving virus was titrated. In a separate experiment, FCV was suspended in 1 and 5.5 mM H2O2 without FeSO4 to test the virucidal effect of H2O2 at the concentrations used.
2.5.4. Peroxynitrous acid.
Peroxynitrous acid/ion (ONOOH) was chemically synthesized in aqueous solution by mixing equal amounts of ice cooled equimolar solutions of sodium nitrite and H2O2 at pH 3.1. Practically for the antiviral experiment, NaNO2 and H2O2 solutions were prepared separately in acidified sterile distilled water (pH = 3.1) in various concentrations (10, 25, 50, 100, 250, and 500 μM; 1 and 3 mM). In 1.5 ml Eppendorf tubes, the FCV (at a constant titer) was suspended in each solution of NaNO2 and kept in an ice bath for 10 min before adding equal volumes (150 μl) of H2O2 solutions into their corresponding concentration of NaNO2. After 10 min incubation in the ice bath, the tubes were kept at room temperature for 2 h. Then, the FCV was titrated in each tube. The titer of surviving FCV was measured by the difference between the titration of treated and non-treated (control) samples, which was performed in sterile distilled water only. The individual effect of NaNO2 was measured by performing the experiment without adding H2O2 into the solution. To confirm that peroxynitrous acid was responsible for inactivation of the virus, 20 mM of ascorbic acid (as a scavenger of ONOOH) was mixed with the virus suspension in separate experimental units to quench the effect of ONOOH.
2.5.5. Reactive nitrogen species (RNS) through gas phase NO.
Reactive nitrogen species (RNS) were chemically synthesized in aqueous solutions by exposing acidified hydrogen peroxide solutions to NO gas at conditions of pH and NO concentrations of 4–20 ppm similar to those formed during exposure to Ar + 1% air plasmas [4]. To prepare similar concentrations of •NO or other RNS, the N2 + 1000 ppm NO gas (Matheson, New Brighton, MN) was mixed with pure Ar gas in the ratio of 1 : 50 (or Ar + 2% of 1000 ppm NO gas). Aliquots of FCV (100 μl suspended in 105 μM, 500 μM and 3 mM H2O2; pH 3.1) were exposed to the flow of Ar + •NO admixture in 96-well plates for 2 min. After 2 h post-exposure, surviving virus was titrated in control and treated samples. For confirmation, 100 μM of carboxy PTIO (as a scavenger of RNS) was mixed with the virus suspension in separate experimental units to quench the effect of RNS. The exposure distance was 11.25 mm from the nozzle to the surface of the virus suspension. The gas flow rate was 1.5 slm.
2.6. Quantification of selected chemical species generated during plasma exposure
Selected chemical species generated during plasma exposure were quantified as given below.
2.6.1. Hydrogen peroxide (H2O2).
The concentration of hydrogen peroxide formed in plasma-exposed distilled water was determined colorimetrically using the titanium sulfate method described in [5].
2.6.2. Nitrates and nitrites.
Nitrate and nitrite concentrations were quantified by Griess assay as described in the method of [25]. In this method, aliquots (100 μl) of distilled water were exposed to the plasma jet. Immediately after exposure to plasma, 10 μl of 216 mM PBS (pH 7.97) was added to stop the conversion of nitrites to nitrate in acidic medium as nitrites are not stable under acidic conditions [10]. In addition, 10 μl of sodium pyruvate —a scavenger of H2O2—was added to quench the H2O2 formed, as H2O2 in large amounts affects the analysis by the Griess Assay. After 2 and 30 min post-plasma exposure, 20 μl of Griess reagent was added either after adding 80 μl of VCl3 (to convert nitrate to nitrite for quantifying gross nitrite concentration) or without adding VCl3 (for quantifying nitrite). After 30 min incubation at 37 °C, the red color was measured at 595 nm wavelength by E max microplate reader (Molecular Devices, Sunnyvale CA). The concentrations of nitrite, and nitrate were calculated using a calibration curve of nitrite and nitrate. The reported nitrate concentrations are rather an estimate due to incomplete conversion of nitrates to nitrites by VCl3.
2.6.3. Ozone (O3).
The presence of ozone in plasma-exposed liquids was estimated by the formation of cis-cis muconic acid from phenol; cis–cis muconic acid is specifically formed when phenol reacts with ozone [10]. For quantification, 500 μM of phenol was added to distilled water and NTE before exposure to plasma. After plasma exposure, the samples were fast frozen at −80 °C until analysis. Quantitative detection of cis–cis muconic acid was obtained by LC/MS analysis using a Shimadzu LC/MS 8040 equipped with electrospray ionization (ESI) ion source. A spectrophotometric detector was used in line with a RF-20A fluorescence detector. From each sample, 50 μl was injected in a Phenomenex Gemini 50 × 2.0 mm C-18, 5 μm Column. The separation was performed by using water (A) and acetonitrile with 0.1% formic acid (B) as mobile phases at 0.5 ml min−1 flow rate. Gradient: 0–2 min at 100% (A) 4 min at 10/90 (A/B).
2.6.4. Singlet oxygen.
The plasma-produced and photosensitized singlet oxygen (1O2) was determined by the use of a fluorescent probe (Singlet Oxygen Sensor Green, SOSG®, kit; Life Technologies Inc., CA, USA). When SOSG reacts with 1O2, it produces SOSG-endoperoxide that emits a strong green fluorescence with a maximum peak around 531 nm. RB itself has a maximum fluorescence emission at 565 nm and its emission at 531 nm is negligible compared to SOSG [26]. The fluorescence was measured by a Biotek Synergy HT fluorescence plate reader (BioTek, Winooski, VT) using excitation wavelength at 485 nm and emission wavelength at 528 nm [27, 28]. The estimated concentrations of singlet oxygen were determined using a calibration curve for fluorescein having the same excitation/emission wavelength as SOSG. All solutions were made in darkness and the experiment was also carried out in darkness.
Fluorescence response of SOSG linearly increased with increase in concentration of SOSG both for photosensitized RB as well as for Ar + 1% O2 plasma. The optimized concentration of SOSG in our study was 10 μM. Fluorescence of SOSG without oxidation was detected but SOSG oxidized by singlet oxygen generated by PDT of RB and plasma showed much higher fluorescence intensity. For plasma treated solutions a tris buffer was used to keep the pH stable during and after the plasma treatment. It was confirmed that singlet oxygen scavenger L-Histidine/sodium azide diminished considerably the fluorescence response of SOSG when added to 10 μM SOSG solution in tris buffer and exposed to Ar + 1% O2 and Ar + 0.27% H2O plasma for 15 s.
2.6.5. Peroxynitrite.
The ONOO− anion was determined spectrophotometrically at 302 nm using a UV-visible recording spectrophotometer (Shimadzu, Columbia, MD) after converting ONOOH to the anion form by adding an excess of 1 M NaOH immediately after mixing NaNO2 with H2O2 [29]. The calculation of peroxynitrous acid concentration was obtained using the extinction coefficient value, 1700 cm−1 from literature [30, 31].
2.7. Time delay experiment
Aliquots (100 μM) of sterile distilled water were exposed separately to Ar, Ar + 1% air and Ar + 1% O2 plasmas for 2 min under optimum operational conditions. FCV was suspended in the plasma-exposed water after various time delays (0, 2.5, 5, 10, 20, 30 and 60 min post-exposure). After exposure of the virus to the plasma treated water for 2 h the surviving virus was titrated. The pH of the water was measured at each elapsed time after plasma exposure.
2.8. Analysis of the modification of viral capsid proteins
2.8.1. Proteolytic digestion of capsid proteins.
Three replicates of Ar + 1% O2 plasma-exposed FCV samples (0 s (control), 15 s and 2 min) were separated by 4–15% gradient SDS-PAGE (Criterion™ TGX Precast Gels, Biorad, CA). The gel was stained with Imperial Protein Stain (Thermo Scientific, Rockford, IL). Two gel regions from each lane were excised, an upper region from approximately 50–74 kDa and a lower region from approximately 27–43 kDa (see figure 13). We performed in-gel trypsin digestions on each gel region as previously described in [32] using trypsin enzyme solution (5 ng μl−1 sequencing grade trypsin (Promega Inc., WI) in 50 mM ammonium bicarbonate pH 7.8, 5 mM calcium chloride), and then the sample hydrolytes were desalted by using the Stage Tip protocol described in Rappsilber et al [33].
2.8.2. Mass spectrometry.
The samples in triplicate were analyzed by capillary liquid chromatography (LC)-mass spectrometry (MS) on an OrbitrapVelos MS system (Thermo Fisher Scientific, Waltham, MA). Approximately 1 μg of each peptide sample was injected and analyzed by LC-MS in MS1 (survey) scan mode. The LC gradient profile and parameters and the MS parameters are provided in the supplementary data (stacks.iop.org/JPhysD/49/204001/mmedia). We performed label-free relative peak quantification (see section 2.8.3, below) by making comparisons of peak intensities in the following fashion: control upper band was compared to treatment-1 upper band; control upper band was compared to treatment-2 upper band, and control lower band was compared to treatment-1 lower band; control lower band was compared to treatment-2 lower band. We analyzed the four 'treatment' samples (treatment 1 min upper band, treatment 1—lower band, treatment 2—upper band, treatment 2 min lower band) by LC-MS/MS on the Orbitrap Velos with HCD (higher energy collision induced dissociation) activation with precursor ions selected from inclusion lists that were populated after quantification analysis; each sample had a unique inclusion list generated from the analysis and the samples were analyzed on the same LC column prior to injection of any unrelated samples. We injected approximately 1 μg of peptide per sample with LC parameters identical to the MS1-only analyses and the MS parameters were previously described [34] with some modifications provided in supplementary data.
2.8.3. Quantification analysis and tandem MS data analysis.
Label-free relative quantification and directed identification via inclusion list were performed using RIPPER framework [35] and directed tandem MS data analysis. Briefly, RIPPER first extracted analyte information from triplicate technical MS runs and computed analyte intensities from their extracted ion chromatograms. Parameters for extracting analyte information using RIPPER are included in supplementary data. From the resulting data, we then selected differentially intense analytes with the lowest p-values (Student's t-test) and generated an inclusion list for each of the four samples. Each inclusion list contained 3000 analytes. Each analyte included was allowed a retention time window of ±2 min from the original quantification analysis to trigger MS/MS fragmentation. The MS/MS data triggered from the directed inclusion lists in PEAKS® Studio 7.0 build 20140912 software (Bioinformatics Solutions, Waterloo, ON Canada) for peptide spectral matching and protein inference [36] was analyzed. The parameters of analysis are included in the supplementary data.
Identifications from PEAKS® Studio 7.0 were matched to RIPPER quantification analysis using an in-house developed R script. Matching criteria included m/z value (±Δ 0.005) and retention time (±Δ 2 min). Where duplicate analytes were generated, we chose the analytes with the smallest retention time difference.
2.9. Statistical analysis and data representation
All virus titrations were carried out in triplicate and each experiment was triplicated. The average is presented together with the standard deviation. The significance of differences between control experiments and treatments was tested by Student's t-test using STATISTICA software, v. 10 (Statsoft, Tulsa, OK). For chemical measurements the values are the average of at least two measurements. We connect data points with a spline—this is merely a guide for the eye intended to facilitate the reading of the figures.
3. Results and discussion
Figure 2 shows the inactivation of FCV by plasma treatment for Ar, Ar + 1% O2, Ar + 1% air and Ar + 0.27% H2O plasma. Full inactivation of the virus can be achieved within 15 s using Ar + 1% O2 plasma, 30 s using Ar and Ar + 1% air plasma while exposure to Ar + 0.27% H2O showed low inactivation effect compared to the other conditions. The key species likely to be responsible for virus inactivation are 1O2, •OH,  /
/  , H2O2, O3, •NO, ONOOH/ONOO−,
  ,
,  and HNO2 [5, 11]. The amount of these species produced in the gas phase by admixing different molecular gases can be varied significantly [11]. As the log10 reduction in the virus titer in the case of Ar + 0.27% H2O did not exceed 1.5 log10 units, this effect can be attributed to the production of H2O2 which is the main specie in this type of gas admixture (see further). Therefore, the focus of the remainder of this paper is on the other three cases. Note that in our previous work a larger virucidal effect has been found for the Ar + 0.27% H2O case, which was due to a previous higher air impurity in the bubbler [5].
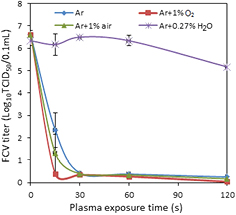
Figure 2. Inactivation of FCV suspended in distilled water using Ar, Ar + 1% O2, Ar + 1% air and Ar + 0.27% H2O cold gaseous plasma as a function of plasma exposure time. Results are an average of triplicate experiments and the error bars indicate the standard deviation.
Download figure:
Standard image High-resolution image3.1. Scavenger experiments
Different scavengers (table 1) that are able to suppress certain plasma species of interest were selected to perform an initial assessment of the virucidal effective species produced by plasma. The suppression in virus inactivation due to the presence of scavengers in the virus-suspending liquid during plasma exposure is shown in figures 3 and 4. L-Histidine, a scavenger preferentially quenching singlet oxygen (1O2) and hydroxyl radical (•OH) suppressed reduction by more than 4log10 TCID50 of the virucidal effect in all investigated types of plasma. A similar effect, although less pronounced, was found for sodium azide which is an effective scavenger of both singlet oxygen and the hydroxyl radical. It should be noted that sodium azide is also used to convert nitrites to nitrates [10]. D-mannitol, which preferentially quenches •OH radical, but very weak in quenching 1O2 (with a reaction rate <103 M−1 s−1), has no suppression on the virucidal effect of all tested plasmas except in the case of Ar + 1% O2 plasma-exposed NTE buffer; for which it suppressed the inactivation by <1log10 units at 2 min plasma exposure. The orders of magnitude different impact of L-histidine compared to D-mannitol suggests that singlet oxygen plays a key role in the virus inactivation.
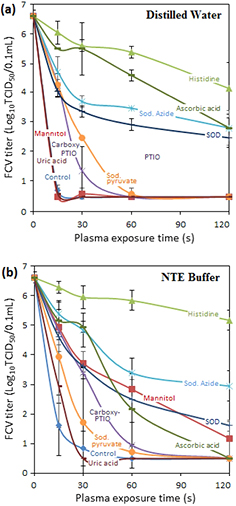
Figure 3. Effect of various scavengers on the virucidal activity of Ar + 1% O2 plasma against FCV suspended in (a) sterile distilled water and (b) NTE buffer. Error bars indicate the standard deviation. A control treatment without scavenger is also included.
Download figure:
Standard image High-resolution image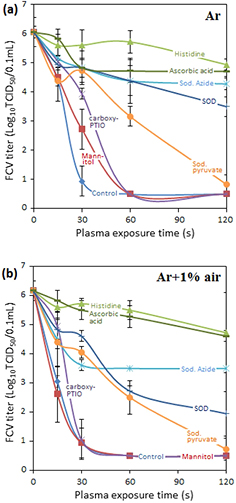
Figure 4. Effect of various scavengers on the virucidal activity of (a) Ar plasma and (b) Ar + 1% air plasma (B) against FCV suspended in sterile distilled water. Error bars indicate the standard deviation. A control treatment without scavenger is also included.
Download figure:
Standard image High-resolution imageSuperoxide dismutase (SOD), a scavenger specific for  , suppressed the virucidal effect of plasma by more than 2.5log10 in the case of Ar + 1% O2. Its suppression impact is however larger in the case of Ar and Ar + 1% air plasmas which are known to produce a larger amount of •NO [37]. Because of the extremely high rate of reaction between •NO and
  most of the superoxide radicals (
 ) will be converted to ONOO− in this case (table 1). This suggests that
  is not a major player in the inactivation of FCV.
ONOOH has two modes of formation when water is exposed to the plasma jet. Its formation from reaction of acidified nitrites with H2O2 is favored at a low pH (⩽3.4) [29]. ONOOH/ONOO− can be alternatively formed by reaction of •NO with  .
.
As the pH of all plasma-treated solutions are between 3.17 to 4.1 for Ar, Ar + 1% O2, Ar + 1% air plasma, the protonated form is expected to be the dominant specie.

Uric acid did not show any significant suppression of the virus inactivation while ascorbic acid showed a significant suppression of the virucidal activity of Ar + 1% O2 plasma. In the case of Ar + 1% O2 plasma-treated distilled water (figure 3), suppression of ~3log10 units in the virucidal effect suggests that ONOOH is involved in virus inactivation. However, when a NTE buffer solution (pH 7.4) was used for the same treatment conditions (figure 3) no suppression in virucidal effect was seen. This clearly suggests the need for a lower pH for peroxynitrous chemistry to play a role in virus inactivation. In the case of Ar and Ar + 1% air, ascorbic acid was able to suppress the virucidal effect in excess of 4log10 (figure 4). In the case of Ar + 1% air, the effect of ascorbic acid was equal to that of L-histidine.
Sodium pyruvate (a scavenger for H2O2) showed a small suppression of the virucidal activity of Ar and Ar + 1% air plasma. Carboxy PTIO (a scavenger for •NO) did not yield significant suppression in the virucidal activity for the investigated plasma types.
3.2. Assessment of the effect of O3
Ozonation of water is an established disinfection procedure and it is important to assess the effect of O3 on the viral inactivation. Although the measurement of O3 in a complex mixture of oxidizers is difficult [38], we performed an indirect measurement of O3 concentration in plasma-exposed water by measuring cis–cis muconic acid formation from the reaction of O3 with phenol. Cis–cis muconic acid is specific to ozone and is formed via 1,3-dipolar cycloaddition mechanism [39]. The measured concentrations of cis-cis muconic acid for the 4 different plasma conditions are shown in table 2. Ar + 1% O2, and, Ar + 1% air showed the highest amount of cis–cis muconic acid at 60 s and 120 s of plasma exposure. It has been reported that muconic acid can be produced also by breaking up of the aromatic ring of catechol, which is formed by the reaction of phenol with •OH radicals [40]. However, the small amount of cis–cis muconic acid observed in the case of Ar + 0.27% H2O showed that this reaction path is not important for the conditions investigated. These results suggest that, particularly in the case of Ar + 1% O2, ozone chemistry could contribute to the virus inactivation.
Table 2. Estimated concentrations of muconic acid as determined by liquid chromatography mass spectrometry. The initial concentration of phenol was 500 μM in distilled water exposed to plasma for 60 and 120 s.
| Plasma | Concentration μM | |
|---|---|---|
| 60 s | 120 s | |
| Ar | 0.7 | 0.2 |
| Ar + 1% O2 | 4.9 | 0.7 |
| Ar + 1% air | 2.4 | 1.0 |
| Ar + 0.27% H2O | ⩽0.1 | ⩽0.2 |
3.3. Positive control experiments and comparison with plasma generated species
Positive control experiments were designed to generate the reactive species highlighted by the scavenger experiments to be responsible for virus inactivation and study their virucidal effect in situ. Singlet oxygen, superoxide radical, hydroxyl radical and ONOOH were generated by chemical reactions in situ at different pH levels and known concentrations of H2O2 mimicking plasma exposure conditions (table 3). The concentrations of studied species used in the positive control experiments are compared with the in situ concentration measurements of the plasma treated liquid when possible.
Table 3. pH values and hydrogen peroxide concentration obtained after 2 min plasma exposure of 100 μl distilled water.
| Plasma | pH | H2O2 conc. (μM) |
|---|---|---|
| Ar | 3.85 | 120 |
| Ar + 1% O2 | 4.10 | 48 |
| Ar + 1% air | 3.17 | 105 |
| Ar + 0.27% H2O | 6.35 | 4790 |
3.3.1. Singlet oxygen.
As shown in figure 5(a) 4.33log10 TCID50 reduction in FCV titer was observed when a 10 μM solution of RB was irradiated with light for 5 min. The virus was completely inactivated (>5log10 TCID50 /0.1 ml) by increasing the irradiation time to 10 min at the same concentration of RB or increasing the concentration of RB to 50 μM at constant irradiation time (10 min). About 4log10 units of the observed virucidal activity were suppressed when 150 mM of L-histidine was added to the FCV suspension containing 10 μM RB. No significant virucidal effect against FCV virus was observed for 50 μM RB or 10 min light irradiation when they were used separately as negative controls.

Figure 5. (a) Inactivation of FCV by singlet oxygen using photosensitized rose Bengal (RB) for different concentrations of RB and light exposure durations. The addition of 150 mM L-histidine (a scavenger of singlet oxygen) is used to confirm the effect of singlet oxygen. Control samples assessing the effect of RB and light on FCV separately are also included. (b) Concentrations of singlet oxygen obtained by SOSG. The measurements are performed for 15 s exposure to Ar + 1% O2 and Ar + 0.27% H2O plasma and photosensitized-RB. The corresponding reduction in FCV titer is also shown. Error bars indicate the standard deviation. The level of significance for differences between the treatments and control is indicated as follows: ns: non-significant at p ⩾ 0.05; *: significant at 0.01 < p < 0.05; **: significant at p < 0.01.
Download figure:
Standard image High-resolution imageThe estimated concentrations of 1O2 generated by photosensitization of RB and the concentrations produced in distilled water exposed to Ar + 1% O2 and Ar + 0.27% H2O plasma for 15 s in addition to the corresponding reduction in FCV titer are shown in figure 5(b). Ar + 1% O2 plasma yielded 4959 nM of 1O2 and ~5log10 TCID50 reduction in virus titer (complete inactivation). Approximately 30 times lower concentrations of 1O2 (174 nM) were estimated for the case of Ar + 0.27% H2O plasma with no significant reduction in FCV titer. Photosensitization of RB generated 1690 nM of 1O2 and showed 4.9log10 reduction in FCV titer (complete inactivation of virus). These results along with those of scavenger experiments suggest that singlet oxygen plays a key role in virus inactivation in the case of Ar + 1% O2 plasma. The plasma produces 1O2 at the plasma–liquid interface while photosensitization of RB produces 1O2 in the bulk of the liquid. A possible concern in the comparison is the lifetime of 1O2 [8] of the order of a few microseconds that does not allow for the penetration of 1O2 to the bulk solution. However, the gas flow through the plasma jet induces significant convection in the liquid [41] that will circulate the virus suspension to the liquid interface to allow the interaction with the plasma-produced 1O2.
Enveloped viruses are known to be more susceptible to virucidal effects of singlet oxygen generated through sensitization of photoactive dyes than their complex non-enveloped counterparts [17, 42, 43]. Nonetheless, the exposure to Ar + 1% O2 plasma for 15s leads to complete inactivation of FCV, a non-enveloped virus (figure 2).
3.3.2. Superoxide/hydroperoxyl radicals.
Superoxide/hydroperoxyl radical were generated by the enzymatic reaction of xanthine with XOD in situ as described in section 2. This positive control for generation of superoxide radical in situ could not generate more than 21 nM of superoxide and did not show significant inactivation of FCV (data not shown).
3.3.3. H2O2 and Hydroxyl radicals.
D-mannitol (a scavenger of •OH radicals) did suppress the virucidal activity in the case of Ar + 1% O2 in NTE buffer (figure 3). This indicates that •OH radicals may play a role in this type of plasma. Also, it is known that introduction of humidity to argon plasma increases the amount of H2O2 and •OH in the plasma; nonetheless the Ar + 0.27% H2O plasma did not lead to significant inactivation of virus. In this positive control experiment we generated •OH radicals by mixing equimolar solutions of H2O2 and FeSO4 at two combinations of H2O2 concentration and pH value mimicking (1) Ar + 1% O2 plasma in NTE buffer (50 μM at pH 7.4) and (2) Ar + 0.27% H2O plasma (5.5 mM at pH 6.5).
Figure 6 clearly shows no significant reduction in the titer of FCV at the conditions mimicking Ar + 1% O2 plasma (pH 7.4 and 50 μM equimolar concentrations of H2O2 and FeSO4), indicating that •OH radicals in this case are not anticipated to play a key role.

Figure 6. Assessment of virucidal activity of H2O2 and chemically generated hydroxyl radicals mimicking plasma conditions of Ar + 0.27% water and Ar + 1% O2 in NTE buffer. The hydroxyl radicals are generated by equimolar concentrations of H2O2 and FeSO4. Error bars indicate the standard deviation. The level of significance is indicated as in figure 5(a).
Download figure:
Standard image High-resolution imageHydroxyl radicals generated at pH 6.5 and 5.5 mM equimolar concentrations of H2O2 and FeSO4 showed ~4log10 reduction in FCV titer which does not match with the very low virus inactivation attained in the mimicked type of plasma (Ar + 0.27% H2O). However, 1log10 reduction in FCV titer was observed with 5.5 mM H2O2 pH 6.5 without generation of •OH radicals. This can account for the inactivation observed in the case of Ar + 0.27% H2O plasma (figure 2). These results suggest that •OH radicals do not play a key role in any of the investigated conditions.
3.3.4. Peroxynitrous acid, •NO and HNO2.
Peroxynitrous acid/peroxynitrite ion is synthesized in situ by reacting equimolar solutions of H2O2 and NaNO2 at pH 3.1 to mimic the conditions of Ar + 1% air plasma [29]. Figure 7 shows that >4log reduction in FCV titer was attained for 1 mM and 3 mM solutions at pH 3.1. The addition of 20 mM ascorbic acid, scavenger of peroxynitrous acid, shows complete suppression of the virucidal activity for these solutions. Virus was also suspended in 3 mM NaNO2 at pH 3.1 and around 1log10 TCID50 reduction in FCV observed. This confirms that peroxynitrous acid is responsible for virus inactivation and not nitrous acid. The measured concentrations of peroxynitrous acid were equal to 1 and 52 μM for a 100 μM and 1 mM NaNO2 and H2O2, respectively. This provides a range of required concentrations of peroxynitrous acid for FCV inactivation. Note that the equimolar mixture of 1 mM H2O2 and NaNO2 at pH 3.9 also yields 1 log reduction in FCV titer. Hence, ONOOH is also formed at higher pH values but in significantly smaller amounts.
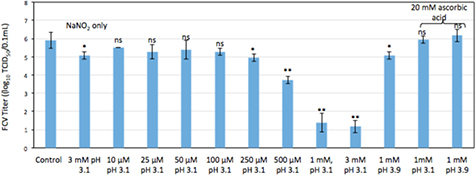
Figure 7. Virucidal activity of chemically generated peroxynitrous acid against FCV at different concentrations. In addition, separate experiments were carried out in the presence of 20 μM ascorbic acid, a scavenger of peroxynitrous acid. Results are average of triplicate experiments. Error bars indicate the standard deviation. The level of significance is indicated as in figure 5(a).
Download figure:
Standard image High-resolution imageTo mimic the plasma treatment with the elimination of the complex species flux, we treated a solution of pH 3.1 containing various concentrations of H2O2 with an •NO-containing gas flow through the plasma jet. The •NO concentration in the gas flow was chosen equal to the measured •NO concentration in the far effluent of the plasma jet (20 ppm) [4]. Figure 8 shows a significant decrease in the FCV titer for a 2 min exposure to the •NO-containing gas for an initial H2O2 concentration of 105 μM or more. At a pH of 3.9 no virucidal effects were observed. In addition exposure to NO only did not yield any virucidal effects. This indicates the need of both H2O2 and •NO radicals in an acid environment below the pKa of nitrous acid (3.4) to inactivate virus and strongly suggests the formation of peroxynitrous acid under plasma-relevant conditions. This is also supported by the changes of pH and H2O2.

Figure 8. Virucidal activity of gas phase NO species against FCV suspended in distilled water and hydrogen peroxide solutions at different pH values. Solutions are exposed to a 1.5 slm flow of 20 ppm NO gas (N2 + 2% of 1000 ppm NO gas admixture) without plasma generation for 2 min. An additional treatment with 100 μM of carboxy-PTIO (a scavenger of RNS) was performed to quench the effect of RNS. Error bars indicate the standard deviation. The level of significance is indicated as in figure 5(a).
Download figure:
Standard image High-resolution imageStudies were not carried out for the gaseous free radical •NO2. The radical has low solubility in water. Dissolution of gas phase nitrogen oxides and nitrogen oxide in aqueous phase leads to the formation of nitrites, nitrates and H+ [3, 10].
3.4. Time delay experiments
We identified singlet oxygen and peroxynitrous acid as key active species in the inactivation of virus. In addition we also showed that H2O2, pH and O3 could play a role in the inactivation. To enable discrimination in more detail between these species we took advantage of the production rates (post plasma reactions in the liquid phase) and the different lifetimes of these species (table 4) and performed time delay measurements of the virus inactivation potency of plasma-treated water. In this case water was treated with plasma then the virus was added to the plasma-treated solutions at different time delays. Important liquid phase post-plasma reactions that take place are the reaction of ozone with hydrogen peroxide (peroxane chemistry) accelerated at pH greater than 5 and with nitrites generating peroxynitrous acid [44]


Table 4. Reported half-life (t1/2) of RONS. Lifetimes are approximate as are influence by exact solution composition.
| Chemical species | t1/2 | Reference | |
|---|---|---|---|
| 1 | 1O2 | 3 μs | [8] |
| 2 | •OH | 1 ns | [64] |
| 3 |  |
1.5 s | [65] |
| 4 | ONOOH | 1 μs | [29] |
| 5 | •NO | Few s | [3] |
| 5 | O3 (acidic pH) | 30 min | [66] |
| 6 | O3 (basic pH) | 15 min | [66] |
| 7 | H2O2 | Several days | [10] |
Nitrites are converted to nitrates and peroxynitrous acid is formed as an intermediate in the presence of hydrogen peroxide [10]:

To track the changes in the plasma-treated water, the pH and concentrations of  ,
,  and H2O2, were determined immediately after exposure (t = 0) and 30 min after plasma exposure (t = 30 min) (table 5).
Table 5. Concentrations of nitrite, nitrate and hydrogen peroxide in water after direct exposure to various plasmas for 0 and 30 min.
| Plasma condition | Post-treatment time (min) | Concentration (μM) | ||
|---|---|---|---|---|
 |
 |
H2O2 | ||
| Ar | 0 | 31 | 34 | 153 |
| 30 | 19 | 52 | 173 | |
| Ar + 1% O2 | 0 | 4 | 10 | 48 |
| 30 | — | 22 | 18 | |
| Ar + 1% air | 0 | 115 | 525 | 105 |
| 30 | 41 | 623 | 62 | |
| Ar + 0.27% H2O | 0 | — | — | 5315 |
| 30 | — | — | 5086 | |
Dash lines means that the concentration was below the detection limit.
Figures 9–12 show the reduction in FCV titer when it was suspended in 2 min plasma-exposed water using Ar + 1% O2, Ar + 1% air and Ar at different time delays (0, 2.5, 5, 10, 20 and 30 min after plasma exposure). The comparison with direct exposure corresponding to the treatment of virus suspended in water directly is shown to assess the effect of short lived species directly produced by the plasma. pH measurements were carried out simultaneously for the same conditions.
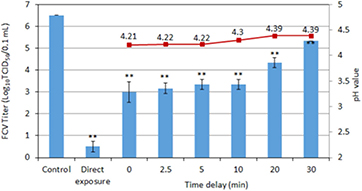
Figure 9. Virus inactivation activity (bar plot) of plasma treated distilled water by Ar + 1% O2 plasma for 2 min for addition of the virus to the solution before the treatment (direct exposure) and at different delay times after the treatment. The control represents an unexposed virus solution. The corresponding pH values are also shown (line plot). Error bars indicate the standard deviation. The level of significance is indicated as in figure 5(a).
Download figure:
Standard image High-resolution imageFigure 9 shows the time delay measurements for the Ar + 1% O2 plasma. The 3log10 difference in FCV titer between the direct exposure and indirect treatment without delay is consistent with the result of the inactivation by singlet oxygen. The 3log10 reduction in FCV titer for the indirect treatment found for t = 0 reduces on a time scale of 30 min. O3 has a half-life of 30 min in acidic water (table 4). However, there is a decrease in nitrites and H2O2 and a corresponding increase in nitrate concentration (table 5). These concentration variations are consistent with the presence of peroxynitrous chemistry, reaction (equation (4)) [10]. To discriminate between peroxynitrate chemistry and O3, a similar experiment was performed in NTE buffer (figure 10). The decrease in virus inactivation was faster, which is consistent with the O3 half-life of 15 min in basic solutions compared to 30 min in acid solutions (table 4). We conclude that O3 plays a key role in the virus inactivation of Ar + 1% O2 plasma, however the involvement of peroxynitrate chemistry cannot be fully excluded in the case of non-buffered solutions.
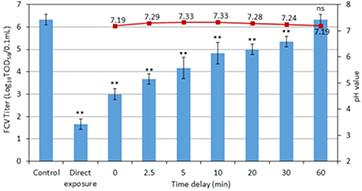
Figure 10. Virus inactivation activity (bar plot) of plasma treated NTE buffer solution by Ar + 1% O2 plasma for 2 min for addition of the virus to the solution before the treatment (direct exposure) and at different delay times after the treatment. For more details, see caption of figure 9.
Download figure:
Standard image High-resolution imageFigure 11 shows the virus inactivation effect of peroxynitrous acid chemistry during the post Ar + 1% Air plasma exposure. The pH remains below 3.4 necessary for the generation of peroxynitrous acid. The concentration variations of H2O2, nitrate and nitrite are again consistent with the presence of peroxynitrous chemistry [10]. Comparing figures 9 and 11 shows that the plasma-treated water is more active in the case of Ar + 1% Air despite the low lifetime of peroxynitrous acid. This is due to the significant production of peroxynitrous acid up to several minutes after the plasma treatment of the solution. Virus inactivation is dominated by peroxynitrate chemistry at pH ⩽ 3.4. L-histidine has an important effect on virus inactivation in the case of Ar + 1% air (figure 4(b)); nonetheless, taking into account the small difference between direct and indirect exposure compared to the Ar + 1% O2 case, the importance of singlet oxygen is clearly smaller in the Ar + 1% air case than in the Ar + 1% O2 case.

Figure 11. Virus inactivation activity (bar plot) of plasma treated distilled water by Ar + 1% air plasma for 2 min for addition of the virus to the solution before the treatment (direct exposure) and at different delay times after the treatment. For more details, see caption of figure 9.
Download figure:
Standard image High-resolution imageThe time delay measurements for Ar are very similar to the case of Ar + 1% air. Figure 12 shows more than 4log10 virus inactivation up to 5 min while similar trends in concentrations are found for nitrites and nitrates as before; H2O2 shows an increase in concentration. It could be that peroxane chemistry reaction (equation (2)) is favored due to a larger concentration of H2O2 for the case of Ar plasma, table 3.  is a precursor of H2O2 and hence there is increase in H2O2. The time delay measurements suggest that both ozone and peroxynitrous acid can play a role in the Ar case.

Figure 12. Virus inactivation activity (bar plot) of plasma treated distilled water by Ar plasma for 2 min for addition of the virus to the solution before the treatment (direct exposure) and at different delay times after the treatment. For more details, see caption of figure 9.
Download figure:
Standard image High-resolution image3.5. Oxidative stress of plasma on the capsid protein of the virus
RONS lead to protein oxidation and many different species have been studied [45, 46].
The aim of this study was to find an imprint of singlet oxygen attack on the capsid proteins of FCV for the Ar + 1% O2 case as in this particular case 1O2 seems to be a dominant virucidal specie. Figure 13 shows changes in the protein separation patterns of 15 s and 2 min plasma-exposed compared to unexposed FCV. Disappearance of many bands was observed in two regions of the gel (upper region from approximately 50–74 kDa and a lower region from approximately 27–43 kDa). To track the plasma species-mediated modifications in the capsid protein of FCV, we selected the proteins of these two regions for LC-MS/MS analysis as they contain the capsid proteins of the virus. It is known that FCV capsid protein is synthesized as a precursor (76 kDa) that is post-translationally processed into the mature 62 kDa capsid protein by removal of the N-terminal 124 amino acids. Also, a 40 kDa protein was detected related to the FCV capsid protein, produced during infection [47].

Figure 13. One dimension SDS-PAGE (4–15% gradient gel) picture of Ar + 1% O2 plasma-exposed FCV proteins (15 s and 2 min versus control). Two gel regions from each lane were excised, upper region from approximately 50–74 KD and a lower region from approximately 27–43 KD.
Download figure:
Standard image High-resolution imageThe amino acids susceptible to singlet oxygen are those with double bonds or sulfur moieties. Among the common amino acids only histidine (His), tyrosine (Tyr), methionine (Met), cysteine (Cys), and cystine, in addition to tryptophan (Trp), react at significant rates at physiological pH values [48].
The reactions of His with 1O2 have been the subject of many studies [49–51]. It is thought that His is one of the major targets for singlet oxygen attack. Recent studies with 1O2-treated cytochrome-C have provided evidence for the formation of 2-imidazolone/2-oxo-His (+14 Da) on His residues specific to 1O2 [49–51]. The proposed reaction scheme of 1O2 with His leading to the formation of—imidazolone/2-oxo-His is shown in figure 14. 2-imidazolone could be readily hydrated, to form hydroxyimidazolone, or undergo reaction with a Lys (lysin) side-chain amine group to form a His-Lys crosslink. The latter product has been suggested to be a novel marker of 1O2 reaction with proteins [49, 50]. Because of the His-Lys crosslink and the fact that all amino acid cross links cannot be detected using LC-MS/MS, we looked for the presence of 2-imidazolone/2-oxo-His as a modification of His mediated only by 1O2 as a specific evidence for singlet oxygen impact on the capsid protein. We detected 2-imidazolone/2-oxo-His (His +14 Da) of His 202, His 262 and His 354 in three peptides among 15 detected peptide fragments covering 40.4% of the capsid protein sequence of FCV (figure 15(a)) compared to the sequence of control FCV. The 2-imidazolone (His +14 Da) modification of His 202 and His 354 were detected in the monoisotopic [M + 2H]2+ observed precursor 605.6633 and 768.3952 m/z matched to peptides [QSLGPLLNPYLH(+14)HLAK] and [H(+14)WTDINGFAIRPFVFQANR], of FCV capsid proteins (gi|4218158 and gi|76443954), respectively. These two peptides were identified without quantification in proteins of the upper region (for His 202) and lower region (for His 354) in 15 s and 2 min plasma-exposed samples, respectively.
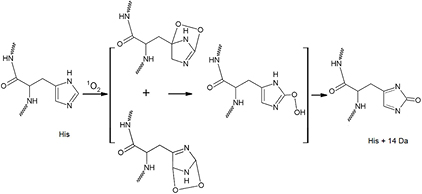
Figure 14. Proposed reaction scheme of 1O2 with His after plasma exposure [49].
Download figure:
Standard image High-resolution image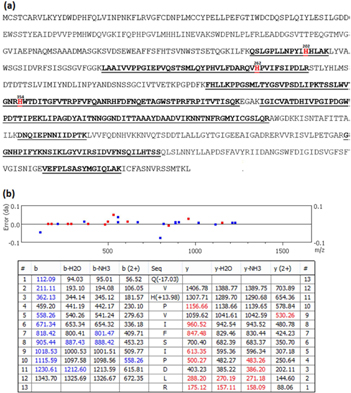
Figure 15. (a) Amino acid sequence of FCV Capsid protein. Protein coverage (40.4%) by mass spectrometry detection of 15 peptide fragments (underlined sequences) showing the detected peptides containing a 2-imidazolone-modified histidine (red colored). (b) Peptide fragment ion table (bottom) and error map (top) of the monoisotopic [M + 2H]2+ observed precursor 759.4071 m/z matched to peptide Q(−17)VH(+14)PVIFSIPDLR in capsid protein sequence of feline calicivirus (gi|2645692) with −2.8 ppm mass accuracy 0.5% false discovery rate (FDR) and 28.78 scoring significance (−10logP) of a peptide-spectrum match. Theoretical b- and y-type fragment ion types matched to experimental product ion are labeled (created by PEAKS® Studio 7.0).
Download figure:
Standard image High-resolution image
The 2-imidazolone modification in His 262 was detected in the monoisotopic [M + 2H]2+ observed precursor 605.6633 and 768.3952 m/z matched to peptides 759.4071 m/z matched to peptide [Q(-17)VH(+14)PVIFSIPDLR] in FCV capsid protein sequence (gi|2645692) with −2.8 ppm mass accuracy, 0.5% false discovery rate (FDR), and 28.78 scoring significance (−10 logP) of a peptide-spectrum match (figure 15(b)). This unique peptide was detected only in the upper region in the case of 15 s -plasma exposed samples and in both upper and lower regions in the case of 2 min-plasma exposed samples. This modification represents adequate evidence of singlet oxygen-mediated oxidative effect on the capsid proteins of FCV.
Many other modifications were detected (data not shown) indicating ROS-mediated oxidative impacts of Ar + 1% O2 plasma such as: (1) oxidation of tryptophan (Trp) to N-formylkynurenine (Trp +31.99 Da) and tryptophandione (Trp +30 Da), which are attributed to either 1O2 or O3 [52, 53]. (2) Oxidation of methionine (Met) to methionine sulfoxide (Met +15.99 Da), which was reported as an indication for 1O2 and O3-mediated oxidative impact on proteins [52, 54].
4. Conclusions
In this manuscript, we have presented a detailed study of the virucidal inactivation mechanisms of a remote radio frequency CAP produced in varying gas mixtures leading to different plasma induced chemistries. FCV, a surrogate for non-enveloped viruses—particularly norovirus—is used in this study. We identified two distinctive chemical pathways for viral inactivation based on a detailed study with selected scavengers complemented by positive control measurements of several RONS. In the case of O2 addition to the Ar plasma, 1O2 is found to be the dominant specie responsible for virus inactivation by cold gaseous plasma. It is suggested that the plasma induced flow plays a key role in the inactivation of virus through short lived 1O2. Evidence of 2-imidazolone/2-oxo-His (His +14 Da) sheds light on capsid protein modification of FCV specific to singlet oxygen and a clear relationship between virus inactivation and oxidative impact of capsid protein mediated by singlet oxygen. In the case of air addition, ONOOH is the dominant specie for virus inactivation. This second mechanism is favored due to the significant pH reduction induced in the solution by the plasma. In addition, time delay measurements have shown that O3 and  do contribute to virus inactivation. A schematic overview of the results is shown in table 6. The effect of H2O2, although produced in large quantities up to ~5000 μM when water is added to the feed gas, is found not to be dominant. The result obtained is very different than results obtained for mammalian cells for which H2O2 induced plasma chemistry has been reported to have a dominating impact[11, 55]. The results show that plasma can be an effective source to inactivate virus even in buffered solutions. Different chemical inactivation pathways can be achieved with the same source by various gas admixtures.
Table 6. Virucidal effects of RONS generated and their concentrations.
| Chemical Species | Method of generation | Concentration of species or scavenger | Reduction in log10 TCID50/0.1ml |
|---|---|---|---|
| Singlet oxygen | Photo activated rose Bengal | 1.69 μM |
4.9 |
| Ar + 1% O2 plasma | 4.95 μM |
5 | |
| Ar + 0.27% H2O plasma | 0.174 μM |
0 | |
| Superoxide | Enzymatic method: 500 μM xanthine + 0.5 U xanthine oxidase | 21 nM superoxide |
0 |
| All plasma jets | SOD 500 U scavenger |
⩾2 (suppression in reduction) | |
| Peroxynitrous acid | • 1 mM NaNO2 + 1 mM H2O2 (pH = 3.1) | 52 μM |
5 |
| • 105 μM H2O2 + 105 μM NaNO2 (pH = 3.1) | 1 μM |
1 | |
| • 105 μM H2O2 (pH = 3.17) exposed to NO conc. comparable to plasma | 2 | ||
• 105 μM H2O2 + 115.86 μM  (pH = 3.17) these values are quantified based on Ar + 1% air plasma (pH = 3.17) these values are quantified based on Ar + 1% air plasma |
0.0089 μM |
||
| Ascorbic acid 20 mM scavenger |
4 (suppression in reduction) | ||
| HNO2 acid | Solution of 3 mM sodium nitrite at pH 3.1 | 3 mM | 1 |
| Hydrogen peroxide | solution of 5 mM H2O2 or larger | ⩾5 mM | 1 |
| Plasma jet(Ar + H2O) | 4790 μM |
1 | |
aEstimated by using fluorescence probe SOSG. bCalculated from uric acid quantitative analysis. cEffective scavenger concentration. dCalculated using molar extinction coefficient value (Ɛ) from the literature. eCalculated using k value from literature. fQuantified calorimetrically.
Acknowledgments
We acknowledge funding from the University of Minnesota and the Department of Energy Plasma Science Center through the US Department of Energy, Office of Fusion Energy Sciences, Contract: DE-SC0001939. Partial funding provided by the Cultural Affairs and Mission Sector, Ministry of Higher Education and Scientific Research, Egypt, is gratefully acknowledged. We thank Paul Williams from the Department of Mechanical Engineering University of Minnesota, and Nhungoc Ti Luong from the Veterinary Diagnostic Lab for technical assistance. The authors acknowledge the Center for Mass Spectrometry and Proteomics at the University of Minnesota and various supporting agencies, including the National Science Foundation for Major Research Instrumentation grants 9871237 and NSF-DBI-0215759 used to purchase the mass spectrometry instruments described in this study. Supporting agencies are listed here: http://cbs.umn.edu/msp/about. The authors acknowledge analytics support from the University of Minnesota Informatics Institute.