
Abstract
Shape fluctuations of lipid membranes have intrigued cell biologists and physicists alike. In the cellular context, their origin—thermal or active—and their physiological significance are open questions. These small incessant displacements, also called membrane undulations, have mostly been studied in model membranes and membranes of simple cells like erythrocytes. Thermal fluctuations of such membranes have been very well described both theoretically and experimentally; active fluctuations are a topic of current interest. Experimentally, membrane fluctuations are not easy to measure, the main challenge being to develop techniques which are capable of measuring very small displacements at very high speed, and preferably over a large area and long time. Scattering techniques have given access to fluctuations in membrane stacks and a variety of optical microscopy based techniques have been devised to study membrane fluctuations of unilamellar vesicles, erythrocytes and other cells. Among them are flicker spectroscopy, dynamic light scattering, diffraction phase microscopy and reflection interference contrast microscopy. Each of these techniques has its advantages and limitations. Here we review the basic principles of the major experimental techniques used to measure bending or shape fluctuations of biomembranes. We report seminal results obtained with each technique and highlight how these studies furthered our understanding of physical properties of membranes and their interactions. We also discuss suggested role of membrane fluctuations in different biological processes.
Export citation and abstract BibTeX RIS

Original content from this work may be used under the terms of the Creative Commons Attribution 3.0 licence. Any further distribution of this work must maintain attribution to the author(s) and the title of the work, journal citation and DOI.
1. Introduction
The seminal work of Singer and Nicolson in 1972 established the basic paradigm of the cell membrane structure and function [1]. However, in the last four decades, biologists have drastically revised the initial view of the cell membrane as essentially a passive barrier delimiting the cell from its environment. Constant remodelling is now recognised as a basic feature of the cell plasma membrane and most of the cell's internal membranes. Spatial fluctuations in the form of membrane displacements are an integral part of such remodelling [2–8]. These fluctuations have fascinated physicists because of the rich statistical mechanics of the system, essentially a two-dimensional fluid embedded in three-dimensional space, and close analogy of the system can be drawn with the  phase of thermotropic liquid crystals. Like its thermotropic counterpart, the membrane system undergoes thermal fluctuations, which are predominately bending fluctuations, sometimes called undulations. In this review, we shall focus on the main experimental techniques that have been used to measure and quantify these fluctuations.
Membrane fluctuations are highly relevant for biological systems [9]. In animal cells the plasma membrane and membranes forming the intracellular compartments undergo continuous motion, part of which is driven by active processes while the other part is purely thermal. Many physiological processes, including the fusion of liposome vehicles (endo-/exocytosis) [7, 8], and inhibition of unspecific interactions [4], depend on membrane fluctuations. They have been implicated in cell adhesion [2–4], and their characteristics have been dissected using model systems [10–13]. At the level of organelles, dramatic changes in nuclear envelope fluctuations have been detected during cell division [14, 15].
Experimentally, it has been difficult to quantify membrane shape fluctuations in nucleated cells [16], though there is evidence of their role in adhesion [2, 4], and their modification due to drug induced stimulation [17]. Fluctuations of single isolated membranes3 have therefore been mostly studied in red blood cells (RBCs) and in model systems, typically giant unilamellar vesicles (GUVs) made of phospholipids. Being composed of only few different types of molecules, these models lack the complexity of their biological counterpart, and therefore quantification of distinct physical properties becomes possible [18–21]. Moreover, as entirely passive systems, they are frequently used to test the theoretical framework underlying membrane undulations. For example, systematic tuning of experimental parameters led to important theoretical advancement accounting for the friction between membrane monolayers [22, 23]. With comprehensive knowledge of the individual components, model systems are an important link in understanding increasingly complex systems: starting from individual molecules via supramolecular assemblies up to active systems, such as living cells.
Bending fluctuations of a non-interacting homogeneous membrane are fully determined by the bending modulus and tension of the membrane [24] (see, for example, [25] for an in-depth discussion). Measurement of thermal fluctuations is therefore a convenient way to estimate the membrane bending modulus without force application (see [26, 27] and references therein). Since these fluctuations contribute to the total entropy of the system, confining the membrane, for example by placing it next to a wall or another membrane, gives rise to a repulsive force of entropic origin. This force, called the 'Helfrich repulsion' or 'undulation force' has similar magnitude and the same distance dependence as van der Waals forces present in the system, but has the opposite sign [28].
In living systems, a cell may expend energy to create additional fluctuations, which, by their very nature are out of equilibrium [29]. These non-thermal fluctuations have been measured in model membranes with embedded protein pumps, where out of equilibrium activity of these proteins gives rise to active fluctuations [30, 31]. Inducing ATP dependent membrane remodeling of red blood cell (RBC) membrane is another way to generate active fluctuations [32–34]. Fluctuations in nucleated cells have also been detected [2, 4, 17, 35, 36].
In another approach focusing on model systems, driven fluctuations have been generated by subjecting the membranes to an external field [37, 38]. A different set of work has focused on the impact of membrane inclusions on thermal fluctuations [39]. Membrane fluctuations may impact diffusion of particles on the membrane [40], and may perturb diffusion measurements [41]. Membrane fluctuations are expected to have a profound impact on membrane adhesion, as predicted theoretically [13, 42, 43] and tested experimentally [20, 44, 45].
In this review, we begin with a summary of the basic theoretical concepts necessary to understand membrane fluctuations.4 We then provide an overview of the major techniques presently used for the measurement of shape fluctuations, majority of which are based on far field optical imaging or scattering techniques. Some less used techniques, including x-ray scattering [46], dark field microscopy based edge detection [47], and defocusing microscopy [48] are not expanded on. We briefly discuss the biological significance of bending fluctuations and conclude with a critical comparison of measurement techniques. We apologise to colleagues whose work could not be adequately cited herein because of the expanding scope of this field. We hope that this review will serve as a practical guide to experimentalists intending to undertake fluctuation measurements.
2. Basic theory of membrane fluctuations
Modern understanding of fluctuations in membranes is due to the pioneering work by Helfrich in the early 1970s [24, 49–51]. A simple lipid bilayer in solution is subject to thermal excitation and fluctuates incessantly around its average shape. From these fluctuations, distinct characteristics such as the correlation length and amplitude can be derived, which in turn yield important information about the membrane mechanical properties and its interaction with the environment [52–55]. Helfrich recognized that the membrane deviating from the energetically favourable shape entails an energy cost which is governed by the bending rigidity of the membrane κ, a material constant characteristic of the lipid composition [50]. Svetina and Zeks refined this view by taking into account the fact that a bilayer has two leaflets which may be coupled [52, 56]. The existence of the curvature energy generates a large variety of non-spherical shapes, which differ in their fluctuation spectra and dynamics [57]. Moreover, based on insights from analyses of the  liquid crystalline phases, in addition to bending, three other basic types of possible membrane deformations were identified for a fluid membrane5: stretching, shear and thickness changes. Figure 1 illustrates these possible deformations. Due to limited compressibility of lipid membranes, peristaltic or thickness fluctuations are suppressed far from phase transition. They may be particularly relevant in the presence of membrane embedded proteins, and were detected experimentally only recently, exhibiting an amplitude of ∼4 Å, [58]. Limited compressibility and fragility rule out stretching since stretching a bilayer may expose the hydrophobic chains to water molecules, thus entailing enormous energy costs. Furthermore, under high stretching the layer may simply break. In general, a lipid membrane can not sustain shear forces of any kind since it is fluid in the plane of the bilayer. Hence, while being dominated by bending deformations, it depends on the particular membrane system whether other deformation modes play a significant role.
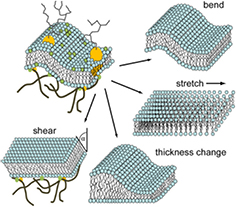
Figure 1. Illustration of the four major deformation classes contributing to membrane fluctuations: bending, membrane area change/stretching, membrane thickness change, and shearing. Bending is the dominant deformation in case of simple lipid bilayers. Stretching generates a high energetic cost. Thickness changes are particularly relevant in the presence of membrane proteins and heterogeneous membrane composition. Fluid membranes are, by definition, unable to support shear deformations, but for a membrane coupled to an external scaffold structure such as the cytoskeleton, shear deformations need to be considered.
Download figure:
Standard image High-resolution imageWith these characteristics, biomembranes are significantly different from simple liquid interfaces, where the same molecules are present in the bulk and at the interface and cohesive forces acting between the molecules generate a huge surface tension. These simple liquids form minimal surface areas and fluctuations are strongly suppressed [59]. In fluctuating biomembranes the number of molecules within the membrane is fixed and so is the surface area. Hence, in addition to membrane curvature, another energy cost arises from changing the area of the membrane (the creation of new contour area i.e. increase or decrease in the lipid–lipid spacing). Small-scale fluctuations create an entropic tension for the large-scale deformations since all have to share the fixed total area of a vesicle [60]. This effect can be attributed phenomenologically to an effective tension σ which must not be confused with a surface tension of simple liquids [59].
A third contribution to the total energy of the membrane arises from its ubiquitous and biologically important interaction with its surrounding. The contributing interactions are usually described by a phenomenological contact potential V(h) between the membrane and an interface a distance h apart. This includes contributions from all the generic interactions (Coulomb, van der Waals, hydration forces or gravity) and another contribution, the so-called hard wall potential which restricts the fluctuations to follow the steric constraint set by the surface [61–65]. Note that while the physical basis of van der Waals forces is electronic fluctuations, they are at a very different length scale compared to the membrane bending fluctuations. A third contribution is added to the total potential in case ligand–receptor pairs are present, to account for the specific 'key-lock' type of interactions. Here, it is interesting to note that hydration forces, the hard wall interaction, and 'key-lock' interactions contribute to the total interaction only over very short distances (up to 1 nm), whereas Coulomb, van der Waals, or gravity are long range interactions. The van der Waals forces, which themselves arise from induction, orientation and dispersion interactions, are, however, screened to a large extent as in most biological systems the lipid membrane is surrounded by a buffer solution (see, for example, [28] for detailed discussion).
Figure 1 illustrates the bending and the stretching of a membrane as two of the four basic modes which membrane deformations comprise. These modes are the two basic classes necessary and sufficient to describe simple model membrane fluctuations. Membrane systems of higher complexity require, in addition, the consideration of the classes thickness change and shear deformation. The former is highly relevant in the presence of membrane proteins or a heterogeneous membrane composition, while the latter shear deformation arise when the membrane is coupled to an external lattice structure. Here, we first summarize the energetics of a simple lipid bilayer considering the first two deformation classes before introducing more complex systems.
Thus, the total energy of the system consists of the energy cost for bending, membrane tension and the interaction potential [66]. Its form has been worked out in several previous works [21, 54, 55, 61, 67–69], only the basic concepts are summarized here. In the simplified description of an infinite, and on the average flat, membrane in Monge representation6, the Hamiltonian has the following form:
where  is the lateral position of the membrane,
  is the distance from the surface, and
  is the curvature of the interaction potential in harmonic approximation. At equilibrium, this expression can be rewritten using Fourier transformation of the membrane fluctuations

and by invoking the law of equipartition of energy, stating that each degree of freedom which is quadratic in h in equation (1), receives  of thermal energy, the total energy reads

and mean square fluctuations become

Fluctuations therefore increase with temperature and decrease with increasing bending rigidity, tension or interaction potential strength.
The membrane motion is derived from the dynamics of its fluid environment, which is given by the Navier–Stokes equations in the limit of a highly overdamped system. The membrane directly couples to this surrounding and following this description the membrane dynamics evolve as an autocorrelation function with exponential relaxation [55]:

The coefficient  accounts for the hydrodynamic damping of the membrane. In case of a free membrane in a medium of viscosity η it takes the well known form
  [55]. For the presence of a surface at a distance h0 from the membrane
  is somewhat enhanced [70, 71].
To date, substantial understanding of the thermodynamics of simple lipid bilayer sheets has been achieved, and recently several theoretical approaches have been suggested to describe fluctuations of membranes in more complex systems, e.g. RBCs and migrating cells. An advanced description for cellular membranes requires consideration of active mechanisms such as configurational changes of membrane embedded proteins [72–76], the coupling of membrane fluctuations to protein diffusion and their aggregation [27, 29, 77], the exchange of membrane composition via endo-, exocytosis [78, 79] as well as the coupling of the membrane to the cytoskeleton (in eucaryotic cells) [80] or of the membrane to the spectrin network (in RBCs [60, 81, 82]) (also see reviews [83] and [84] and references therein). Since non-thermal fluctuations usually encompass a variety of force production mechanisms, modelling of these situations necessarily requires simplification.
So far several models successfully captured the basic characteristics of cellular membrane motion by assuming a direct coupling between cell membrane and actin cytoskeleton dynamics. More precisely, the displacement of actin filament tips—and of the membrane at the same time—was described by an extended Fokker–Planck equation that includes diffusion of actin monomers and actin polymerization rates at the ends of the filaments [85, 86]. In another approach active mechanisms were introduced via a non-thermal external force f which adds to the general expression of the conventional membrane hydrodynamic description [81, 87].
The external forces f are taken to be Gaussian for a passive system, and they obey the fluctuation dissipation theorem. However, for an active system this may not be true and f has been modelled as a spatially uncorrelated noise, which depends on the concentration of active objects n (e.g. actin monomers, membrane pumps, etc), their characteristic active time τ etc [75, 88].
In a purely thermal system an equilibrium average like  depends only on variables specified in the Hamiltonian, the emergence of a dynamic quantity is always a hallmark of non-thermal effects. As a concrete example, let us consider the case of RBC fluctuations where the active process is driven by the association/dissociation of the membrane from the underlying spectrin network via ATP consumption. The force [81] at the cytoskeletal-membrane junction is modelled by a spring. Thermal fluctuations get amplified by an additional contribution that is proportional to the concentration of ATP. Other theoretical studies focused on eucaryotic cell membrane dynamics and modelled the active mechanism either as a direct result of actin polymerization forces that push on the membrane [86, 89–91] or, more indirectly, by the local activation of molecules that drive the polymerization [92]. Alternatively, active or driven fluctuations can be elicited by non-biological means, including via an imposed electric field [93–96], by photo-chemical means [46] or through mechanical means like optical traps [97]. Such an approach may of course simplify modeling.
3. Choice of the measurement technique
To measure membrane fluctuation, an experimentalist faces several challenges. The first challenge is that any probing technique that exerts even very small forces may in fact impact the fluctuations themselves. Mechanical probing techniques, like atomic force microscopy, are therefore not suitable for following membrane fluctuations. Light based imaging techniques or different kinds of scattering techniques where the probe does not strongly interact with the membrane (typically visible light, x-ray or neutron), are the most suitable choice. Light based techniques are however often limited by the poor refractive index contrast and reflectivity of lipid membranes. To overcome this, fluorescent labeling of the membrane to enhance contrast is often necessary, but caution needs to be exercised since fluorophores may alter the membrane properties [46, 98, 99]. Another fundamental challenge arises from the fact that fluctuations are small, typically nanometric, and yet fast. This dual requirement of high space as well as time resolution places strong restrictions on the measurement technique. An additional challenge arises while measuring fluctuations in cells because they are optically inhomogeneous. Table 1 summarises the characteristics of the major available fluctuation measurement techniques.
Table 1. Overview of experimental techniques with their merits and limits for probing biomembrane fluctuations.
| Name | Basis | Domain / space | Resolution | Advantage | Shortcoming |
|---|---|---|---|---|---|
| FS [100–104] | Contour—usually from phase contrast image | Time / Fourier | ∼10 ms (camera limited); 86 nm | Simple setup | 1. Assumption on refractive index variation; 2. limited to perimeter |
| DODS [17, 106] | Displacement of fluorescent membrane in the confocal volume | Time / real | 10 μs ; 20 nm | Easy to setup with basic FCS module; can measure anywhere on the GUV or cell; applicable to nucleated cells | 1. Single point information; 2. Fluorescent labeling |
| TRMFS [34, 107] | Light scattering from object edge | Frequency / real | ∼1 μs ; ⩽1 nm | Label-free; high spatio-temporal resolution | 1. Requires sophisticated setup; 2. Single point information |
| RICM/ DW-RICM [16, 108–113, 156] | Optical path difference between interfering rays | Time / real | ∼10 ms (camera limited); 5 nm | Label-free, topographic information with high axial resolution | 1. Restricted to ∼1 μm from a surface; 2. Requires well defined interfaces of known reflectivity or approximations such as the 'min–max' method are to be used [16] |
| FLIC [114–119] | Optical path difference between interfering rays | Time / real | ∼10 ms (camera limited); ∼1 nm | Topographic information with high axial resolution | 1. Requires special substrates; 2. Fluorescent labeling; 3. Sophisticated analysis |
| DPM [33, 120–124] | Phase shift of scattered light | Time / real | ∼10 ms (camera limited); ∼1 nm | Label-free, thickness change | 1. Strong assumption on refractive index variation; 2. Not suitable for optically heterogenous objects |
| DLS [125–130] | Elastic light scattering | Frequency / Fourier | 0.5 μs–5 ms ; ∼1 nm | Probing of hydrodynamic theory of membrane dispersion behaviour; probing of membrane structural changes | Averaging of the process over several minutes; requires homogeneous sample |
| NSE [58, 131–135] | Neutron scattering; dephasing of neutron spins | Time / Fourier | ∼1 ps ; 1–100 Å | Fluctuations on molecular scales; probing of membrane structural changes | 1. Measurements at spallation neutron source; 2. Limited number of experiments |
Note: FS = Flicker spectroscopy, DODS = Dynamic optical displacement spectroscopy, TRMFS = Time resolved membrane fluctuation spectroscopy, RICM = Reflection interference contrast microscopy, FLIC = Fluorescence interference contrast, DPM = Diffraction phase microscopy, DLS = Dynamic light scattering, NSE = Neutron spin echo.
Arguably the most straightforward measurement of membrane fluctuations is through camera based imaging of its position and shape in real time. This is the basis of so-called flicker spectroscopy (FS) [100–104], where the periphery of a GUV is imaged. The speed of the camera used imposes the current time resolution achievable. The reported spatial resolution arises from inherent weak interaction of light with the lipid bilayer, and can probably be improved by using a contrasting agent [105]. Other intensity contrast based methods include dynamic defocusing microscopy (DDM) [48] and Dark Field Microscopy (DFM) [47]). Both depend on the detection of intensity changes that occur at the cell edge. Both are expected to be subject to similar restrictions as FS
Alternative, non-imaging techaniques to track the membrane have been developed, where either a fluorescent membrane moves inside a small, inhomogeneously illuminated volume (DODS) [17], or the membrane edge scatters light focused into a small volume (TRMFS) [34]. In both cases, instead of imaging the membrane, the displacements of the membrane are recorded at a given point. Using a photon counting device or a quadrant photo-diode for signal detection, and by directly recording through a signal correlator, very fast detection (typically in the micro second range) is achieved. For DODS, the reported spatial resolution of 20 nm arises from the noise of the background, which corresponds to light scattered from the fluid surrounding the membrane. For TRMFS, the reported resolution is about 1 nm, which is in fact the theoretical resolution and may, in practice be degraded by similar ambient noise.
Frequently, in a typical experimental situation, especially when the aim is to study membrane-surface interactions or adhesion, the membrane is close to a surface. In this case, generating a map of the membrane to surface distance is equivalent to measuring the membrane shape, and the obvious choice is an interference based technique. Reflection interference contrast microscopy (RICM) [16, 109] and the closely related dual-wave RICM (DW-RICM) [16, 112, 108, 156], depend on the inherent reflectivity of the membrane, whereas fluorescence interference contrast microscopy (FLIC) uses fluorescence to enhance contrast. Since the membrane displacements in the vertical direction are measured by interference, the theoretical resolution is limited only by the molecular membrane roughness. However, the shot noise of the recording device is expected to impose the real limitation and, for both FLIC and RICM, 1 nm resolution has been reported for adhered non-fluctuating membranes. For fluctuating membranes, the shot noise is higher because of the limitation on signal integration time, and thus the resolution is expected to be degraded. In a typical DW-RICM measurement of a fluctuating membrane, the resolution is about 5 nm. In both techniques, a camera is used to image the interference pattern, and as a result, the temporal resolution is limited by current camera technology and the lateral space resolution is limited by the Raleigh criterion.
Diffraction phase microscopy (DPM) [33] is another label-free technique which is suitable for the investigation of optically homogeneous objects close to a surface. Here, the reported 1 nm axial resolution is applicable only if the refractive index of the object is known. Moreover, as for RICM and FLIC, the camera detection system and its shot noise will impose the dominant limitation on the spatial resolution.
Whenever the collective motion of membranes at low wave-lengths is of interest, scattering techniques like dynamic light scattering (DLS) and neutron spin echo (NSE) are the method of choice. While they are insensitive to local changes or heterogeneities on the membrane, they probe membrane dynamics at the subnanometer scale—the smallest scales of all the discussed techniques, and with up to picosecond temporal resolution (in case of NSE). This allows them to capture the fastest membrane dynamics. Theoretical resolution values are realistically achieved in measurements, since due to the detection of an ensemble of fluctuations, the signal-to-noise ratio is usually high.
Overall, while the label free light based techniques are the most convenient for measurement on single membranes, they often require strong assumptions on optical homogeneity and/or the refractive index of the object. These are therefore inherently problematic to use with an optically inhomogeneous object like a nucleated cell. Of all the techniques described, DODS alone makes no assumption on the optical properties of the object and as such is applicable to the outer plasma membrane of nucleated cells. None of the these methods have, however, demonstrated their applicability to the intracellular space.
4. Description of the available measurement techniques
4.1. Flicker spectroscopy (FS)
4.1.1. Early work.
The very first experimental quantification of fluctuations of a single membrane was in the context of red blood cells, which had been observed to 'flicker' as early as in 1890 [136]. Brochard and Lennon [102] established a basis for quantitative analysis of this flicker. Their technique was based on video-microscopy of the cells imaged in phase-contrast mode, and subsequent quantification of the thickness fluctuations from the recorded intensity variations. They called this technique 'flicker spectroscopy'.
The main assumption in this work was that the phase delay, and hence the contrast, arises mainly because of variations in thickness of the cell rather than from refractive index variations. Under this assumption, a linear relation between intensity variations and thickness variations emerge. The lateral spatial resolution is determined by the microscope used and was 300 nm. The frequency rage probed was 0.2 Hz–90 Hz. The mean fluctuation amplitude was of the order of 40 to 80 nm, depending on the species under study. Two point spatial correlation functions were determined and were found to be 'universal' under physiological conditions, in the sense that shape of the spatial correlation function was independent of the species from which the RBC were harvested (human, frog or chicken) and also the frequency at which it was recorded. However, tensing of the RBC membrane by osmotic swelling suppressed the fluctuations. The frequency spectrum was found to be linear.
A similar approach was later used in the Sackmann group, to probe the impact of pathology on flickering [104, 137], as well as to refine the analysis of Brochard-Wyart et al [102] to account for the real shape of the erythrocyte and the shear modulus of the erythrocyte membrane [138, 139]. These early works together formed the basis for later studies on both erythrocytes and GUVs.
4.1.2. Contour analysis.
The technique of using video-microscopy in phase-contrast mode for fluctuation analysis is nowadays known as flicker spectroscopy, and has become one of the main techniques used to measure membrane fluctuations. It has been applied to a variety of contexts, especially in the context of giant vesicles. For quasi-spherical vesicles, the expected fluctuations were theoretically described in early work [53] and have been measured in the group of Ipsen who established rigorous analysis based on the full probability distribution of the configurational fluctuations [140, 141], which allowed them to explore subtle influences of lipid composition, inclusions or drugs on the bending elasticity [142–145]. In another context, using non-spherical vesicle, the bending modulus and the spontaneous curvature could be measured separately [103]. Inclusion of membrane proteins has given access to active fluctuations [30, 145, 146].
Figure 2 gives an overview about the technique, its realization and an example result. As explained before, a linear relation between intensity variations and thickness variations can be used. Alternatively, the phase contrast image is used to segment the vesicle wall from the surrounding buffer, thus delineating precisely the contour of the vesicle. The lateral spatial resolution is determined by the microscope used and for a conventional setup it amounts to 300 nm. As demonstrated for the case of vesicles this can be improved up to a spatial precision of 86 nm [67, 101] if the intensity gradient across the contour is monitored. The frequency range probed with this technique lies between 0.2 Hz and ∼100 Hz [35, 100, 102]. Analyses of the shape fluctuations along the perimeter of the cell give access to the local lateral amplitudes, the eigenmodes, from which the bending modulus and—for RBCs—the shear modulus can be derived.

Figure 2. Flicker spectroscopy. (A) Illustration of a typical experiment, where a phase contrast movie of red blood cell flickering is recorded. The simultaneously measured lateral edge fluctuations  at points i = 0–3 around the cell are extracted. From the continuous time sequence, the azimuthal modes and time-autocorrelation function are calculated, which yield the bending κ and shear modulus μ of the membrane. The red arrow indicates the intensity profile position in (B). (B) Radial intensity profile of phase contrast micrograph at the rim of the cell showing a strong diffraction fringe (halo) beyond the cell edge. The radial position of the edge is accurately determined from the point of the steepest slope of the intensity variation. (A) and (B) taken from Strey et al [100] with kind permission of the author and Biophysical Journal. (C) Fluctuation amplitude
  versus wave vector q for a GUV. From the fit of the data the membrane tension
  N m−1 and bending rigidity
  J are determined. Taken from Pécréaux et al [101] with kind permission of the author and The European Physical Journal.
Download figure:
Standard image High-resolution imageFlicker Spectroscopy has been predominantly applied to measure red blood cell flickering and gave rise to the hypothesis of its ATP dependent magnitude [32]. The technique was also applied to GUVs where it was used to verify the theory of bending fluctuations [103]. The technique is particularly suitable for the study of lateral membrane displacements which are barely accessible with other techniques. It allows to analyze the full spectrum of modes in case of circular objects and due to its simple technical requirements can be implemented on almost every basic microscope.
Overall, the use of camera limits the space and time resolution. Another major problem arises because the contrast between the vesicle and its surrounding is not very high. Recently, light sheet illumination of fluorescently labeled vesicles was used [105] in a similar way and does away with some of the problems. However, presence of large number of dye molecules may alter membrane dynamics [147].
4.2. Fast displacement detection at a point
4.2.1. Dynamic optical displacement spectroscopy (DODS).
DODS is a recently introduced approach, where membrane displacements are traced with 20 nm spatial and 10 μs temporal resolution [17]. DODS is based on a conventional fluorescence correlation spectroscopy (FCS) setup and takes advantage of the fast and sensitive detection inherent to FCS. The key idea of DODS is to suppress intensity fluctuations arising from lateral fluorophore diffusion in the membrane, the latter are in fact usually exploited in FCS measurements. This is achieved by doping the membrane with 1 mol% fluorescent lipids. In DODS, intensity fluctuations are detected due to the physical movement of the fluorescent membrane within the confocal detection volume (CDV, see figure 3). Since the excitation intensity in the CDV is not homogeneous, a change in the intensity is recorded whenever the membrane changes its position within the CDV. Fluctuations are most sensitively probed at the inflection point of the Gaussian representing the intensity distribution in the CDV. At this point, the curvature vanishes and the intensity change  is proportional to the displacement
  :
:

Figure 3. DODS. (A) This technique is based on a conventional FCS setup. The membrane is doped with 1 mol% fluorophore. For the measurements, first an axial intensity scan of the confocal detection volume (CDV) across the membrane is performed. This reveals the Gaussian intensity distribution of the CDV (grey dots and line). Physical displacements of the membrane relative to the CDV results in intensity fluctuations. The correlation amplitude, ξ, of the intensity fluctuations follows a characteristic double well shape (blue dots). At the inflection point of the Gaussian distribution, IP, membrane fluctuations are detected most sensitively. (B) Sketch of the membrane-confocal setup for DODS. After the axial scan, the membrane is positioned at the IP of the Gaussian. (C) Typical example of intensity autocorrelation function, ACF. (D) Using equation (6) the displacement autocorrelation function (dACF) is calculated from the ACF. Four examples of dACFs represent the membrane dynamics of human macrophages at two different cell positions, on the cell body (Body) and on the lamellipodium (Lam), and with/without priming with IFNγ (+/-). (E) Comparison of the root-mean square fluctuations of membrane displacement. (A)–(E) after Monzel et al [17]).
Download figure:
Standard image High-resolution imageThus, knowing the slope m at the inflection point, membrane displacement can be quantified. The slope depends on the maximum intensity measured at the centre of the CDV, Imax, the average membrane position, h0, and the axial radius of the confocal volume z0. A photon counting device (e.g. an avalanche photodiode (APD) or GaAsP detector) is used to detect the intensity and the collected intensities are processed by an autocorrelator (with multiple tau algorithm) as for FCS.
DODS has been utilized to determine membrane fluctuations of giant unilamellar vesicles (GUVs) freely fluctuating or close to a wall [106]. In case of RBCs the impact of adenosine triphosphate (ATP) on fluctuations was assessed and the signatures of active mechanisms were discussed [17]. Moreover, the ruffling behaviour of human macrophages was quantified, and effects upon chemokine stimulation were reported and are depicted in figure 3.
DODS is highly suitable for studying soft fluctuating membranes. It assesses fluctuation changes in a highly localized region and enables fluctuation characterization in an intermediate wavevector regime (![${{10}^{-5}}<q\,[1/m]<1$](https://content.cld.iop.org/journals/0022-3727/49/24/243002/revision1/daa1fc3ieqn017.gif) ) where it is most sensitive to membrane tension changes. DODS requires fluorescence labeling of the membrane and can not image fluctuations simultaneously at different parts of the vesicle or cell. In comparison to other techniques its major advantage is the combined high spatiotemporal resolution (20 nm, 10 μs), the flexibility in choosing the measurement position, and its applicability to nucleated cells.
) where it is most sensitive to membrane tension changes. DODS requires fluorescence labeling of the membrane and can not image fluctuations simultaneously at different parts of the vesicle or cell. In comparison to other techniques its major advantage is the combined high spatiotemporal resolution (20 nm, 10 μs), the flexibility in choosing the measurement position, and its applicability to nucleated cells.
4.2.2. Time resolved membrane fluctuation spectroscopy (TRMFS).
TRMFS is another recently introduced approach, which enables membrane fluctuation detection with similar spatio-temporal resolution as DODS. Here, an optical tweezer setup is used to measure membrane deflections in lateral instead of axial direction. Contrary to the conventional optical tweezer usage, the infrared beam here is driven at low power [148]. Due to the movement of the membrane interface into an infrared beam, the light is partially scattered off the cell edge and is detected on a quadrant photodiode. It is based on the assumption that the intensity scales linearly with the membrane displacement. This technique is sensitive to smaller, nanometric fluctuations as compared to DODS, but integrates the fluctuations over a larger detection area of 0.5 μm. From the measurements, the power spectral density is derived and its analysis yields the membrane mechanical properties. Figure 4 illustrates the setup and an example measurement. It has been used to probe GUV fluctuations in membranes of different lipid composition [107] as well as to probe ATP dependent fluctuations of RBCs [34]. With these specifications this approach is essentially complementary to DODS.
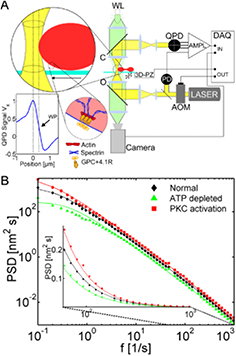
Figure 4. TRMFS. (A) Schematics of the setup. Infra-red ( nm) laser light is emitted from a fiber laser and is intensity controlled using an acousto-optical modulator (AOM). A 10 × telescope increases the beam diameter to 14 mm and this is focused on the sample by a water-immersion objective (position 'O'). At the sample the light is partially scattered off the cell edge. Scattered and unscattered light are collected by a water-immersion condenser (position 'C') and imaged on a QPD. Before digitalization (DAQ), the data are amplified and filtered using custom made low-noise hardware (AMPL). Round inset 1 shows the experiment where part of the laser interacts with the cell by light scattering. By moving the RBC through the laser focus (graph below inset 1) the linear intensity regime is determined whose center marks the working point (WP) of the experiment. Round inset 2 sketches the interaction between the membrane and the spectrin network. (B) Log–log plot of the mean power spectral density (PSD) of 21 normal RBCs (black), 20 ATP-depleted (green) and 21 PKC-activated (red) red blood cells. The solid lines are fits from which the membrane mechanical parameters are determined. The inset shows a semilogarithmic plot of the same data for the marked frequency range. (A) and (B) reproduced from Betz et al [34] with permission of the author and PNAS.
Download figure:
Standard image High-resolution image4.3. Interference techniques
4.3.1. Reflection interference contrast microscopy (RICM).
Micro-interferometry is an optical technique to measure nanometric distances (see [16] for a for a comprehensive review). In the context of soft and living matter it was first introduced in the 50 s under the name interference reflection microscopy for cells [149], and was later adapted in a more quantitative manner to determine membrane-substrate distances in mimetic systems where the membrane is optically better defined [109]. The latter, called reflection interference contrast microscopy (RICM) is now often the technique of choice to probe the membrane close to a substrate, especially in the context of adhesion [35, 150, 151]. RICM is also well suited to probe fluctuations near the substrate.
Light reflected from the fluctuating membrane interferes with the light reflected from the surface of the substrate and gives rise to the measured interference pattern (see figure 5(A)). The time dependent height h of the membrane can then be extracted from the intensity variations over time [16, 152]. However, since the intensity away from the substrate varies periodically  (see equation (7) and figure 5(B)), classical RICM was limited by the problem of determining the correct interference fringe—for example, starting from a bright maximum, a decrease in intensity could be attributed to either an increase or a decrease in membrane height. A major step forward was the establishment of dual-wavelength RICM, first introduced chiefly for beads [111, 112, 153, 154], and later extended to membranes [108, 113, 156]. Use of two (or more) wavelengths lifts the phase ambiguity and therefore it becomes possible to construct absolute height maps as well as fluctuation maps [108, 155, 156]. Knowing the refractive indices and thicknesses of the different layers and using Fresnel's equations the theory of partial coherence yields the relation between measured intensities I and membrane heights hm [156]:

with  the absolute membrane height, y =
  , and α the angle of the cone of illumination to account for the illumination numerical aperture (typically about
  ). The offset hoff and the sum and difference of the maximal and minimal intensity, S and D, respectively, are determined from the fit of the theoretical curve [113].
  is the wavevector and
  is the refractive index of the outer buffer. A detailed description of the procedure to reconstruct membrane heights can be found elsewhere [16, 108, 156]. An example of fluctuation detection by RICM is given in figure 5(C).
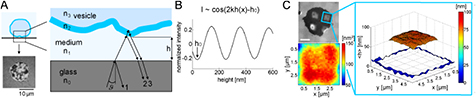
Figure 5. RICM. (A) Sketch of RICM principle. Incoming light is partly reflected at interfaces of layers with different refractive index ni, i = 0–3, here the glass-medium, medium-membrane and the membrane-GUV/cell interior. Reflected rays interfere con-/destructively depending on the height h of the object above the substrate, i.e. the optical path length  . The resulting interferogram (left,bottom) is detected by a camera. (B) Knowing the thicknesses and refractive indices of the different layers, the intensity-height I(h) relation is calculated. Measured intensities close to the substrate are converted into heights using equation (7). (C) Example of a GUV partly adhered to a grid structure. The membrane adheres to the proteins in the grid and is free to fluctuate within square regions. The topography of the free membrane within square regions is reconstructed. The box (right) shows the reconstructed membrane height (average 83 nm). Below the micrograph (left) the corresponding mean-square fluctuation amplitude is given. Scale bar 5 μm.
Download figure:
Standard image High-resolution imageIn RICM, the height resolution in the vertical direction for a fluctuating membrane is typically of the order of 4 nm and is limited mainly by the shot noise of the camera. Like any wide-field technique, the lateral space resolution is limited by the Raleigh limit and the time resolution is determined by the speed of the camera. The main disadvantage of RICM is that it can only detect membranes close to a wall, the presence of which may in fact perturb the fluctuation spectrum.
RICM is a very powerful technique to probe fluctuations in model membranes [16, 108] and has been used to determine whether a membrane is pinned or free [155]. This was done by comparing the measured fluctuations to the expected camera noise, thus providing a new tool to characterize membrane adhesion [18, 44, 157]. It is also highly suitable to obtain insight on the membrane-substrate interaction potential and to determine the membrane mechanical parameters from the measured fluctuations [71, 106, 113, 152, 158]. It has also been applied to cells [2, 4, 35, 36] where the quantitative evaluation is slightly limited by the complex optical structure of the cytoplasm. However, being a label free technique, it is uniquely suited for probing primary cells, including from patients [36, 159]. This opens the possibility of using fluctuations as an indicator of pathology induced mechanical changes.
4.3.2. Fluorescence interference contrast microscopy (FLIC).
FLIC uses standing modes of light in front of a reflecting surface of silicon to modulate the fluorescence intensity emerging from a fluorophore embedded in the membrane as a function of its position along the optical axis [160, 161]. It requires special substrates with a thin layer of silicon dioxide of known thickness grown over an optically flat layer of silicon (see figures 6(A) and (B)). Light is reflected from the silicon surface and interferes with the incident light in both the excitation and emission channel. The fluorescence pattern can be used to accurately read off the membrane to surface distance. FLIC achieves nanometer resolution and can resolve topographical structures, in the same way as RICM measurements, except that in FLIC, the conversion is based on the fluorescence signal.

Figure 6. FLIC. (A) Sketch of FLIC principle. A fluorophore (orange star) is located at a distance zw + zo from a reflective substrate, typically a silicon wafer. zo is the thickness of an oxide spacer layer with index of refraction no, and zw is the height in the ambient medium with refractive index nw. For both, the excitation (blue) and the emission (red) light, interference occurs. Depending on the optical path difference between rays reflected at the substrate and rays directly emerging from the fluorophore a height-dependent fluorescence intensity is detected. (B) Calculated FLIC intensity functions for a fluorophore located immediately at an oxide surface (zw = 0) as a function of oxide thickness (zo). The gray curve models monochromatic excitation ( nm) and emission (
 nm) normally incident to a substrate with a reflection coefficient r = 0.76. The thicker red curve models polychromatic excitation and emission of a Texas Red fluorophore imaged with an NA = 0.9 objective. (A) and (B) reproduced from Groves et al [115] with permission of the author and Annual review of biomedical engineering. (C) FLIC topography image of a supported lipid bilayer and (D) root-mean-square fluctuation amplitude. Dark regions indicate pinning sites with reduced fluctuation. (C) and (D) taken from Kaizuka et al [116] with permission of the author and Biophysical Journal.
Download figure:
Standard image High-resolution imageWhile FLIC was typically used to measure absolute distances between an oxide layer and a membrane on the substrate [114, 117–119], it has also been used to probe fluctuations of the membrane [114] and its asymmetric composition [119]. Using vesicle spreading, a bilayer was created on top of the oxide layer. A second bilayer, created by bursting of a GUV, was monitored. Maps of absolute distances and fluctuations were produced. Inter-membrane distances were typically 30–60 nm and fluctuation amplitudes of up to 10 nm were observed (see for example figures 6(C) and (D)). Spatial and temporal correlations could be computed and compared well with theory. However, FLIC has not often been applied to studies of membrane dynamics, probably because of the restrictions on the layer structure of the special fabrication of substrates.
4.4. Phase based techniques
4.4.1. Diffraction phase microscopy (DPM).
DPM enables membrane fluctuation measurements with nm spatial and ∼10 ms temporal resolution without the need for labeling the object [121]. This technique exploits the information encoded in the phase of the imaging field and the phase shifts which are produced from light diffracted by an object within the sample. The phase shift is transferred into an intensity distribution which in turn is converted into topographic information using a Hilbert transformation. As a quantitative measure the thickness and refractive index of the object at each pixel can be extracted. As illustrated in figure 7 the technique is realized by illuminating the sample with a laser (recently a common halogen lamp was also used [120, 122]) and the reflected light in the detection pathway traverses a phase grating in the image plane. This generates multiple diffraction orders which all contain the full image information. With a spatial light modulator only the 1st and 0th order of the diffraction pattern are selected and these yield the final interferogram in the detector plane. The 0th order beam, which is the reference field, is low-pass filtered, while the entire frequency content of the 1st order beam is passed. A lens system forming a Mach–Zehnder interferometer generates a stable interference image which is spatially high-pass filtered before detection.

Figure 7. DPM. (A) Sketch of the setup with recently introduced white light illumination. An amplitude grating with a groove density of 110 grooves per mm located at the image plane is used to generate diffraction orders, each containing full spatial and phase information of the sample. A mask is projected onto a spatial light modulator (SLM) placed at the Fourier plane to filter the diffraction orders. The zero-order or reference beam is spatially low pass filtered using a circular mask so that only the DC component is passed through. The whole +1 diffraction order is passed and is used as the sample beam. After a second lens L2, the two beams interfere with each other to create the interferogram on a CCD camera; taken from Bhaduri et al [122] with kind permission of the author and Optics Letters. (B) Reconstructed RBC topography and (C) instantaneous displacement map. Scale bar 2 μm. (B) and (C) taken from Park et al [123] with kind permission of the authors and PNAS. (D) Histograms of cell-thickness fluctuation and (E) in-plane shear modulus of RBCs invaded by Plasmodium falciparum at different parasite developmental stages indicated as healthy, ring, trophozoite and schizont. For comparison the estimates from optical tweezers are shown. The inset illustrates the RBC and its membrane fluctuations:  , thickness fluctuations measured by DPM;
  , in-plane membrane displacement;
  , out-of-plane membrane displacement. For each group 20 samples were tested. (D) and (E) reproduced from Park et al [33] with author and PNAS permission—Copyright (2008) National Academy of Sciences, USA.
Download figure:
Standard image High-resolution imageSo far DPM has been used extensively to quantify RBC membrane fluctuations with some examples given in figure 7 [121, 123].
DPM requires knowledge about the refractive index of the object. It is therefore suitable for quasi-homogeneous objects like RBCs [124, 162]. For the same reason it can only measure objects close to a wall, where the optical layers of the sample and their refractive indices are highly controlled. The possibility to image topography or to obtain structural information with 1 nm axial resolution at ms time scales and, more importantly, to image objects without the need for fluorescent labeling or exogenous contrast agents makes DPM, like RICM, particularly suitable to applications where a minimal invasive approach is needed.
4.5. Scattering techniques
4.5.1. Dynamic light scattering (DLS).
DLS is one of the few techniques bridging the wide wavevector range of ∼104–107 1 m−1 and timescales of 0.5 μs–5 ms. Due to this property it is extremely beneficial for testing of theories based on membrane microelasticity, to determine small fluctuations (∼1 nm), and to identify the dominating modes in each time domain [127].
For DLS the monochromatic light of a laser is focused onto the membrane at small incident angle and polarized parallel to the membrane plane. This maximizes the wavevector resolution and the reflected intensity. Due to the interaction with the molecules, the light is elastically scattered and interferes to a speckle pattern which is detected. This pattern changes as the membrane undulates. As for DODS a photocounting device (e.g. an APD) is used as detector and the autocorrelation function is calculated via the multiple tau algorithm [125].
For DLS data analysis two modes need to be considered for which the technique is sensitive: a transverse shear mode, where molecules perform out-of-plane motions, and a splay mode, which accounts for the stiffness of the membrane and the cost in energy as the membrane is tilted. For a detailed explanation the reader may refer to Fan [128], Kramer [129] and Earnshaw [127]. Overall, this yields an effective fluctuation of the membrane with the following dispersion relation [129]:

 is the scattering vector,
  is the complex frequency with eigenfrequency f0 and damping constant
  . ρ and η are the density and viscosity of the fluid and
  is the complex tension with the membrane tension σ, the bending rigidity κ, and
  the surface viscosity. A result of the measurement of f0 and
  is shown in figure 8. Equation (8) was used to fit the data and thereby insight into the membrane mechanical parameters is obtained. For membrane system which exhibit only small fluctuations, such as BLMs the effect of κ is negligible up to very high q values of some ∼107 m−1 (
 nm) where the contribution from κ amounts to 1/10 of that of the tension term. Hence, the lateral membrane tension σ is determined with high sensitivity. However, to obtain information about the surface viscosity
  DLS measurements need to be undertaken over a q-range that extends well into the overdamped regime.

Figure 8. DLS: (A) Sketch of scattering setup. The monochromatic light of a laser is focused onto the membrane at small incident angle and polarized parallel to the membrane plane. The light is elastically scattered in- and out-of the plane of the membrane and interferes to a speckle pattern which is detected by a photon counting device at a reflection angle of  . Note that due to the inclination of the detector plane the circular region of in-plane scattered vectors q is approximated by an elliptical aperture at the detector site. (B) Example of probing the relaxation regimes: mode frequency f0 and damping
  versus mode wave vector q of a free planar bilayer (BLM) calculated from the autocorrelation functions measured at the corresponding q-values. The full lines represents the theoretical prediction with the average lateral tension σ and the viscosity
  (see text) as parameters. (B) taken from Hirn et al [125] with kind permission of the author and Faraday Discussions.
Download figure:
Standard image High-resolution imageSo far DLS has been used to measure undulations of freely suspended planar lipid bilayers, so-called black lipid membrane (BLMs) [125, 127] or to assess changes in relaxation behaviour due to molecular changes in the membrane composition [126]. In these studies a critical test of a hydrodynamic theory of the dispersion behaviour of membrane collective modes under tension i.e. the transition of the oscillating (low q) to the overdamped regime, where intermonolayer friction dominates the relaxation of the membrane (high q) was tested [125]. Quasi-elastic light scattering has also been used to study the dynamic properties of RBCs [130].
In total, DLS is particularly useful to study phenomena arising in the mesoscopic frequency range (kHz–MHz) where it probes the lateral membrane tension with high sensitivity. Due to the wide range of wave vectors measured, DLS also allows to reveal a hierarchy of relaxation mechanisms in lipid bilayers, which are highly influenced by the bilayer elastic properties and the local hydrodynamic environment. The effects of proteins/transmembrane pores, peptides and polymers on collective membrane dynamics have been an important application of DLS and will be in future.
4.5.2. Neutron spin echo (NSE).
NSE was first introduced by Mezei [133] in the 1970s for the study of ferromagnetic domains but turned out to be also suitable to study local bilayer undulations at ps-ns timescales and with wavelengths of some 1–100 Å [134, 163]. It relies on the quasielastic scattering of neutrons, which in an external magnetic field exhibit Larmor precession of their magnetic moment. From the scattering at the object a dephasing of neutron spins occurs and rephasing of spins at the side of the detector yields information on the velocity change the neutron encountered, i.e. the momentum q transferred to the object. q is tuned by measuring the sample for different scattering angles. The time-resolved intermediate structure factor S(q, t) reveals the collective motion of the membrane

where  is the relaxation which yields insight into the membrane viscosity η and bending rigidity κ. Due to its fine angular resolution in the small-angle regime (low q-values), the instrument is well suited to probe the nanoscopic lengths scales and to test a specific q-dependence of the measured relaxation rates
  [53]. NSE has been used to study GUV membrane fluctuations and the effects of membrane lipid composition on the membrane mechanical properties [131, 132]. Examples of measurements are given in figure 9.
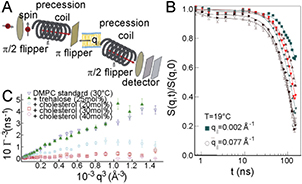
Figure 9. NSE. (A) Sketch of the NSE experiment. A  flipper rotates the neutron spin direction to be perpendicular to the scattering plane, i.e. in vertical direction. The neutron beam travels through a magnetic field after which the spins perform a Larmor precession within the vertical plane. The neutron spin is rotated by
  around the vertical axis by the π flipper before being scattered by the sample. The scattered neutrons travel through the second precession coil. Inside the second coil, the Larmor precession effectively unwinds the neutron spin, which is unchanged if the scattering event is elastic. A second
  flipper rotates the neutron spin into the horizontal plane. The final change in neutron polarization, i.e.
  , the lateral momentum transfer, is determined by an analyzerdetector system. (B) Intermediate scattering function
  for selected
  values in the interval 0.002
 for DMPC bilayers in the gel phase. Two relaxation processes, one at about 10 ns and a second slower process at about 100 ns are distinguished. Solid lines represent least-square fits to two exponential decays. (A) taken from Armstrong et al [164]—reproduced by permission of the author and The Royal Society of Chemistry; (B) reproduced from Rheinstädter et al [132] with permission of the author and Physical Review Letters. (C) Undulation relaxation rate
  of DMPC vesicle for pure undulation mode and with effects of the respective membrane additives cholesterol and trehalose in composite lipid vesicles; taken from Brüning et al [131] with permission of the author and Biochimica et Biophysica Acta.
Download figure:
Standard image High-resolution image
5. Discussion
The basis, merits and limitations of the techniques discussed above are summarized in table 1. Clearly, often one technique is particularly suited for a certain type of measurement and to a specific system. As is often the case, it is not always easy to compare measurements performed with different techniques or to realize quantitative comparison with theory. In this section we first discuss how this may be achieved at least for model membranes, and then discuss key findings for the classes of systems: model membranes, erythrocytes (single cells), and nucleated cells.
5.1. Comparison across techniques or between theory and experiments
Experiments can never access the instantaneous value of a physical quantity that fluctuates in time since measurements always take finite time, however small, and the measured quantity is averaged over this time window. Furthermore, all experimental techniques have an inherent spatial resolution. The finite resolution in space and time smears out the true membrane heights  . The apparent heights
  are a convolution of the true heights in space and time, and are given by
where τ is the temporal acquisition of the detection system and A the spatial resolution of the setup.
Accounting for this effect allows, on one hand, comparison with theory [71], and on the other hand, facilitates comparison of data from different measurement techniques [17, 106].
5.2. Measured fluctuations in model membranes
Thermal fluctuations in model membranes have been measured with a variety of techniques discussed above. Giant unilamellar vesicles (typically ∼10–100 μm diameter) have proved to be particularly important to study the case of freely fluctuating membrane. As can be seen from equation (4), the measured fluctuation amplitudes of course depend strongly on the lipid composition, the tension of the membrane, and the interactions with the surroundings. Typical measurements are in tens of nanometers: e.g. amplitudes of ∼70 nm were measured with FS. Osmotic deflation results in larger undulations and for such case amplitudes increased to ∼100 nm as measured with DODS [17]. In the presence of a wall, the steric constraint dampens the amplitude to some ∼30 nm for an osmotically deflated vesicle [17] or in case of weakly bound GUV results in ∼15 nm as measured with RICM [152]. If the GUV adheres strongly to the substrate, membrane fluctuations get suppressed to optically non-detectable values (⩽1 nm) [44, 108].
In general, fluctuations in non-adhered GUV are dominated by the membrane bending rigidity, which is in the range of  –150
–150  for phospholipid membranes [26, 165]. The membrane tension σ changes fluctuations in a free GUV only slightly, but becomes the dominating factor close to a wall or a substrate. As explained above σ is a global membrane parameter adjusting to the same value everywhere in the membrane. It can thus be measured at any part of the vesicle. Its smallest value was found in non-adhered vesicles ∼0.1 μJ m−2 as measured with DODS [17] and flicker spectroscopy [101]. These values increased for adhering vesicles up to ∼1–10 μJ m−2. [71, 152]. Membrane fluctuations in the vicinity of a substrate allowed for the assessment of the interaction potential strength which is typically on the order of
  MJ m−4. [71, 152] Due to the interdependence of the undulations on membrane tension and interaction potential strength (see equation (4)), both values are determined in a self-consistent manner and different strategies have been suggested to treat this issue [71].
From fluctuation spectra and relaxation times insight into the lipid composition can be obtained. For example, in the studies by Pécréaux et al [101] fluctuation spectra were used to determined the bending rigidity, which in turn reflected the main lipid, Egg Phosphatidylcholine or Stearyl-Oleoyl-Phosphatidylcholine, and the addition of cholesterol to the membrane. In addition, Brocca et al [126] used DLS and found a significant reduction in relaxation times upon addition of cholesterol (some 8 mol%) or gangliosides (only 1 mol%) to large unilamellar vesicles. In a related approach the group of Dimova combined fluctuation analysis with electrodeformation [166] to measure effect of inclusions, including medically relevant molecules [167].
A step towards more complex compositions of vesicles have been taken by Manneville and Faris et al [30, 168] through inserting Bacteriorhodopsin (BR) into the membrane: the experiments showed that the size of the height fluctuations were enhanced by the presence of light and a lowering of the membrane tension was observed in case of BR activity. In addition, the mean-square height decreased with increasing viscosity of the solvent. Since in a thermal system, equilibrium averages cannot depend on dynamical constants such as viscosity, the authors conclude that non-thermal effects play an important role in this system.
Undulations of supported lipid membranes have typically been examined with scattering techniques, such as NSE [131, 132], DLS [125, 126] and x-ray scattering [46]. These techniques are sensitive to amplitudes in the sub-nanometer regime and probe a wide range of modes (wave vectors  or
or  ). On these scales, the friction between monolayer sheets and the dispersion behaviour of membrane collective modes under tension i.e. the transition of an oscillating (low q) to an overdamped relaxation regime (high q) [125], may become important. These systems have been used to test theoretical concepts describing the membrane motion [55, 57, 66]. Changes in lipid composition were predominantly probed in solid supported lipid membranes (SLBs) or freely suspended black lipid membranes (BLMs) [125, 127]. Investigating the undulation dynamics of monolipid, lipid/surfactant mixtures or membranes containing cholesterol or trehalose with NSE, Brüning et al [131, 169] unraveled differences in the membrane relaxation behaviour. For example they find that on the local length scales, lipid headgroup charges in the membrane influences the bilayer undulation dynamics and bilayer bending rigidity κ less than inserting unsaturated lipid acyl chains. Moreover they observe a bilayer softening with increasing inhomogeneity of the lipid mixture or close to the main transition temperature of the single lipid system, trehalose has no effect on the membrane mechanical properties and a stiffening effect by cholesterol was evidenced. As the lipids investigated play an important role as natural carriers for RNA, DNA or cellular delivery of drug formulations, their properties are crucial to for endo-/exocytosis and vesicle trafficking inside the cell.
5.3. Shape fluctuations in RBCs
Red blood cells are highly flexible. They can pass through the smallest capillaries in our body, whose diameter at 5 or 6 μm [170, 171] may be smaller than the size of the cell itself. The flexibility of the RBCs stems from their particular structure: they lack a nucleus and other major organelles, and can be modeled as homogeneous objects which produce optical phase shifts proportional to the local thickness. For these reasons RBCs are highly suitable for fluctuation analysis. Being, in addition, easily available and exhibiting ATP dependent fluctuation they have become the most studied example of active fluctuations.
Already in early work, the frequency spectrum was found to follow a power law and later was understood to be strongly influenced by the spectrin network [100]. The bending modulus was estimated from fluctuations as  J [102] and later measured to
  J for discocyte and stomatocyte shapes, whereas RBCs of echinocyte shape were substantially stiffer with
  J [35]. A recent study by Boss et al [172] showed, that in case of discocyte RBCs membrane fluctuations are mainly governed by bending elasticity and shear and tension elasticities have only a marginal influence on the fluctuation amplitude. Exertion of mechanical forces, such as osmotic swelling [102] or changes in medium viscosity between 1–3 cP [173] was shown to partially suppress the fluctuations. In the following years more and more studies were undertaken to unravel the origin of the flicker, starting with the prediction that ATP has substantial influence on fluctuation intensity [173]. While effects of viscosity changes on fluctuations could not be verified [34], the ATP dependent flicker was confirmed with different techniques. The amplitude was found to be position dependent, the highest being ∼60 nm on the upper side of the rim and in the presence of ATP, slightly smaller amplitudes were detected at the centre (∼40 nm) [17, 34, 123].
The amplitude was shown to decrease by a factor ∼1.4 at all positions for metabolically ATP depleted cells [17, 34, 123]. The relaxation times, of the order of 0.1 s in the presence of ATP, decrease by ×1.5 in its absence. The ATP dependent flicker also led to an extensive discussion on its characterization as an actively driven process. A fluctuation spectrum exhibiting contributions from non-equilibrium/'active processes was reported by Park et al [123]. This could not be confirmed by Betz et al [34] but a non-Gaussian character of fluctuations at the cell rim was also detected in a recent study [17]. While the term 'activity, is yet to be defined precisely', consensus opinion is that ATP affects the cell membrane structure to trigger enhanced fluctuations through regulation of binding between membrane and the spectrin junctions. This connection persists in case of ATP depletion and leads to an increased tension. In contrast, disrupting the spectrin-membrane interaction by protein kinase C activation, i.e. catalyzing the ATP reaction, weakens the spectrin network, and hence the measured tension decreases [34]. Figure 4 shows a sketch of such measurement. Finally, other studies on RBCs demonstrated that membrane fluctuation changes are indicative of the vital condition of the cell. Costa et al [174] found flickering pattern of higher complexity in newly formed compared to older cells. Moreover, RBCs invaded by malaria parasite [33] as well as cells from patients with sickle cell disease [175] exhibited changes in their fluctuation amplitude. Results of these studies are shown in figure 7.
5.4. Nucleated cells
Analyses of membrane fluctuations of nucleated cells are sparse, mostly due to a lack of suitable tools to measure them. Many of the presented techniques rely on the assumption of cell membrane fluctuations being proportional to image contrast and therefore they require sufficient sample homogeneity to accurately measure displacements. However, scattering of light in the heterogeneous cell cytosol seriously undermines this assumption. Nevertheless some attempts with phase and absorption based techniques have been made to overcome these problems [47].
The interference based technique, RICM, was applied to cell membrane fluctuations by several groups. RICM was used to measure the motion of a macrophage membrane within the adhesion area, which amounted to 10 nm in amplitude and was initially suggested to be mostly Brownian in its nature [4]. The same technique was used in a different study to quantify membrane undulations during adhesion of THP-1 monocyte cells and these were typically 5 nm in amplitude [2]. More recently, there has been attempts to link fluctuations in platelets, as measured in RICM, to pathology [176].
In another approach from 1990, a setup similar to TRMFS was used to determine membrane oscillations in fibroblasts, lymphocytes and monocytes. By detecting light scattering at the margin of the cell, amplitudes between 20–30 nm were measured [177]. One way to exclude the disturbing effects of organelles and other cytosolic structures, is to employ fluorescence based techniques such as FLIC, DODS or quantitative fluorescence microscopy. With DODS, for example, the ruffling behaviour of human macrophages and the effect of their stimulation with the cytokine interferon-γ (IFNγ) was recently assessed [17]. Here, priming of cells by the cytokine enhanced the membrane motion by ×2 to amplitudes of 90 nm. The relaxation dynamics exhibited an inverse tendency as compared to the membrane relaxation times determined in RBC. While in absence of IFNγ the characteristic relaxation was in the 1 s regime, it decreased ×2 in the presence of the cytokine [17]. Figure 3 illustrates these results. In another recent seminal study on Drosophila embryo development nuclear envelope fluctuations were assessed and high-frequency fluctuation amplitudes of 300 nm observed, a value which was measured shortly before to ∼200 nm with similar cells [178]. These fluctuations reduced significantly as microtubuli polymerization and their impulsion on the nuclear envelope where suppressed. Hence the authors conclude that nuclear envelope fluctuations are closely linked with microtubule polymerization and these are important for chromatin dynamics in Drosophila embryo [14].
5.5. Biological significance
It is clear from previous sections that cell membrane fluctuations are expected to impact interactions with another cell. For example, fluctuation induced steric repulsion was suggested to prevent agglomeration of RBCs. However, fluctuations also enable adhesion formation as they promote contact between cells by stochastic membrane collisions. In a slightly different context fluctuations have also recently been speculated to support the folded membrane structure of organelles [179].
From our discussion of active membrane fluctuations, it can be speculated that they constitute a signature of cellular processes. Several studies exist where membrane fluctuations were demonstrated to reflect a particular subcellular process. Examples include, cell homeostatic processes such as the ATP-dependent flicker of RBCs, the  -induced priming of macrophages or nuclear envelope fluctuations which represent microtubule polymerization [14]. Finally, biomembrane fluctuations have been shown to reflect nanomechanical properties of the substructure of yeast cells, where the periodic motion of the cell wall was associated with the forces exerted by molecular motors [180].
Membrane fluctuations were also demonstrated to exhibit significant differences in infectious or genetic diseases: for example, invasion of malaria parasite [33] or sickle cell disease [124, 181] leaves distinct signatures within the spectrum of RBCs fluctuations. These results indicate that membrane fluctuation measurements can contribute to the assessment of cellular processes and may in future play a role in diagnostics.
6. Concluding discussions and outlook
The focus of many early and ongoing studies has been to exploit fluctuations for retrieving material parameters using the premises of the fluctuation dissipation theorem. Membrane bending elasticity [26, 135, 182], tension [156, 183, 184] and the membrane-surface interaction potential [62, 106, 152, 156, 158, 185] have been measured in detail. This has been a very successful approach and has provided a means to probe subtle changes e.g. linked to changes in membrane composition [142, 144, 145, 186, 187] or inclusions [188]. Moreover, membrane fluctuation studies, free of additional forces, are particularly important for analyses of soft membrane, since application of even a small force can change the membrane tension and hence influence membrane behavior [185].
While exploitation of thermal fluctuations for learning more about the system remains a fruitful field of study, there is more and more interest in active fluctuations [87]. In general, statistical physics of active systems is a fascinating field of research and classically this field was confined to theory due to the lack of experimental systems [29, 72, 77, 92, 189, 190]. More recently experimental studies on actively driven processes in biological in vitro systems were undertaken, including membranes containing proteins as well as active gels, composed of actin and motors (for the latter, see the review [189]) In case of the latter, violation of the fluctuation dissipation theorem was detected [191] and this context has recently been replicated in an actively driven membrane system [97].
Of the available cellular systems, RBCs have been the classical choice to elucidate active processes in membranes. Contradictory signatures of activity observed here led to a lively discussion on the classification of activity and the necessity of its non-Gaussian nature [97]. Intriguingly, fluctuations of a resting nucleated cell membrane may be Gaussian in nature as probed by RICM [4] and confirmed by DODS [17]. However, stimulation elicits non-Gaussian behavior [17]. It remains to be seen whether the resting state fluctuations are thermal or are non-thermal Gaussian fluctuations and whether other signatures of activity (e.g. violation of the fluctuation-dissipation theorem) can be found. The open questions related to cell biology are wide and far ranging: Do all cells fluctuate similarly? Does this depend on their stage in life cycle, level of nutrition, infection, or other kind of pathology? In brief, here we have shown that membrane fluctuations are on one hand a rich area of physics, providing model systems for testing statistical mechanics of active systems, and on the other hand are biologically relevant and may provide a fingerprint of the physiological and pathological state of the cell.
Acknowledgments
We are grateful to R Merkel, A Smith, U Seifert, S Fenz, L Limozin, and D Schmidt for continuing discussions about membrane systems. KS thanks E Sackmann for introduction to the field. CM acknowledges financial support by Fondation Pierre-Gilles de Gennes and Fonds der Chemischen Industrie. KS thanks European Research Council for funding via grant no. 307104 2012_StG_20111012/ERC/SYNINTER and AMIDEX grant Affinity.
Footnotes
- 3
Bilayer stacks have been studied extensively, usually using scattering techniques and have provided crucial insights into membrane physics. We shall however concentrate on isolated, single membranes in this review.
- 4
Theoretical treatment of membrane fluctuations is a vast domain and an exhaustive review of theory is not in the spirit of this review.
- 5
A fluid membrane is a quasi-two dimensional fluid. The molecules are free to diffuse in the plane of the bilayer. This is not the case, for example, in hexatic or crystalline membranes.
- 6
The Monge representation parameterizes vertical displacements as a function of the in-plane spatial coordinates and is most suitable for describing 'small' deformations where overhangs are absent.