

Abstract
Sustainment of Q ∼ 10 operation with a fusion power of ∼500 MW for several hundred seconds is a key mission goal of the ITER Project. Past calculations and simulations predict that these conditions can be produced in high-confinement mode operation (H-mode) at 15 MA relying on only inductive current drive. Earlier development of 15 MA baseline inductive plasma scenarios provided a focal point for the ITER Design Review conducted in 2007–2008. In the intervening period, detailed predictive simulations, supported by experimental demonstrations in existing tokamaks, allow us to assemble an end-to-end specification of this scenario consistent with the final design of the ITER device. Simulations have encompassed plasma initiation, current ramp-up, plasma burn and current ramp-down, and have included density profiles and thermal transport models producing temperature profiles consistent with edge pedestal conditions present in current fusion experiments. These quasi-stationary conditions are maintained due to the presence of edge-localized modes that limit the edge pressure. High temperatures and densities in the pedestal region produce significant edge bootstrap current that must be considered in modelling of feedback control of shape and vertical stability. In this paper we present new results of transport simulations fully consistent with the final ITER design that remain within allowed limits for the coil system and power supplies. These self-consistent simulations increase our confidence in meeting the challenges of the ITER program.
Export citation and abstract BibTeX RIS
1. Introduction
The central solenoid (CS) and poloidal field (PF) coil system on ITER, figure 1, provides inductive current drive and feedback control of the plasma current, position and shape, as well as stabilization of the unstable vertical motion of the elongated plasma. To provide sufficient flexibility for exploring the physics of burning plasmas, these coils must have a margin for operation that remains within the engineering limits of forces, currents and magnetic fields in the superconducting coils. Successful ITER operation achieves fusion power near Pfusion ∼ 500 MW with sufficient neutron production to operate at a fusion gain of Q ∼ 10 (Q = Pfusion/Pauxiliary) for a duration of 300 to 500 s. Based on tokamak performance to date, this baseline operation for ITER [1] will use an inductively driven plasma current of 15 MA under the assumption of access to high-confinement mode (H-mode) exhibiting edge-localized modes (ELMs) that limit the edge pressure. The resulting high stored energy and large edge current density put significant demands on the PF system for shape and vertical stability control. Many of these issues were explored in earlier simulations [2] where several parameters and characteristics of the plasma control and performance are discussed.
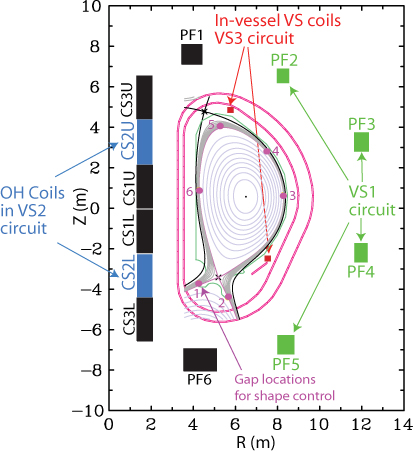
Figure 1. ITER coil system to sustain inductive plasma current and for shape and vertical stability control. Three vertical stabilization circuits are indicated along with the six controlled plasma-wall gaps.
Download figure:
Standard imageThe CS/PF coil layout for ITER shown in figure 1 identifies the coils available for shape and vertical stability control with the possibility for three different stabilizing circuits as indicated. ITER has recently converged on several final component designs for construction. These have resulted in modifications to both the coil geometry and the plasma divertor shape. The major changes since the earlier assessment [2] that affect limits in operation are the position and size of the CS-coil stack and PF6, figure 1, as shown in table 1. The CS coils were moved radially inwards with both a change in the vertical position and cross-sectional area to accommodate a change in total number of turns to form the coil. Similarly, PF6 was moved radially outwards and vertically downwards also with an increase in the number of turns and cross-sectional area. These changes alter the current carrying and local magnetic field limits in the coils and both the net and separating forces allowed on them. The outer limiter has also been removed but this has minimal effect on the operating characteristics. In finalizing these designs, we can now concentrate on a more accurate assessment of the operating space expected for the full 15 MA plasma current.
Table 1. Change in coil design parameters where the 'new' values (bold) include only those coils modified based on reviews. R, Z are the locations of the cross-section centre; dR, dZ are the radial and vertical sizes and N is then the number of turns. Values are given in the ITER CATIA system of co-ordinates (TGCS).
| Coil | R (m) | Z (m) | dR (m) | dZ (m) | N |
|---|---|---|---|---|---|
| New | |||||
| CS3U | 1.6960 | 5.4350 | 0.7340 | 2.1200 | 553 |
| CS2U | 1.6960 | 3.2650 | 0.7340 | 2.1200 | 553 |
| CS1U | 1.6960 | 1.0950 | 0.7340 | 2.1200 | 553 |
| CS1L | 1.6960 | −1.0750 | 0.7340 | 2.1200 | 553 |
| CS2L | 1.6960 | −3.2450 | 0.7340 | 2.1200 | 553 |
| CS3L | 1.6960 | −5.4150 | 0.7340 | 2.1200 | 553 |
| PF6 | 4.3340 | −7.4665 | 1.5590 | 1.1075 | 459.4 |
| Old | |||||
| CS3U | 1.722 | 5.313 | 0.719 | 2.075 | 548 |
| CS2U | 1.722 | 3.188 | 0.719 | 2.075 | 548 |
| CS1U | 1.722 | 1.063 | 0.719 | 2.075 | 548 |
| CS1L | 1.722 | −1.063 | 0.719 | 2.075 | 548 |
| CS2L | 1.722 | −3.168 | 0.719 | 2.075 | 548 |
| CS3L | 1.722 | −5.313 | 0.719 | 2.075 | 548 |
| PF1 | 3.9431 | 7.5741 | 0.9590 | 0.9841 | 248.6 |
| PF2 | 8.2851 | 6.5398 | 0.5801 | 0.7146 | 115.2 |
| PF3 | 11.9919 | 3.2752 | 0.6963 | 0.9538 | 185.9 |
| PF4 | 11.9630 | −2.2336 | 0.6382 | 0.9538 | 169.9 |
| PF5 | 8.3908 | −6.7269 | 0.8125 | 0.9538 | 216.8 |
| PF6 | 4.2632 | −7.5643 | 1.6191 | 0.9841 | 424.4 |
This assessment is accomplished by analysis of variations in plasma parameters to explore limitations to the PF system using static equilibria calculated by solving the Grad–Shafranov equation. In light of these recent design modifications, we are also re-assessing the expected scenario performance with time-dependent simulations of the plasma evolution. This scenario re-assessment examines performance sensitivities for baseline operation plus evaluation of potential alternative current ramp rates for both the plasma ramp-up to 15 MA and ramp-down after burn. These scenario simulations include 2D free-boundary equilibrium evolution for validating the feedback control of the plasma shape and position coupled with thermal transport models to assess performance. This evaluation is stimulated, in part, by recent experimental studies exploring scaled ITER-like operation [3, 4] to validate the models and parameter choices made in formulating ITER operating scenarios.
The studies presented here have been completed with two separate free-boundary equilibrium and thermal transport codes, CORSICA [5] and DINA [6]. These codes were part of the previous benchmark simulation study [2] and are described in this earlier publication. In simulations presented here, CORSICA is used to study performance sensitivities while DINA is exploring the use of fast controlled current ramps. While the TSC code is also participating in the revised operating assessment, this effort is concentrating on developing alternatives to the inductive scenario, the hybrid and steady-state [7] operation on ITER and is the topic of a separate investigation [8]. Our work reported here uses only the VS1 circuit for control and does not rely on the new internal coils that require the VS3 controller under development for ITER. We have evaluated sensitivity to assumptions concerning the H-mode pedestal parameters using a variation of the edge transport assumptions and have explored limits to the current ramp rate. We have begun exploration of the inside wall-limited start-up and ramp-down. Finally, since the early experiments on ITER will include non-nuclear operating scenarios running with hydrogen or helium or with limited neutron flux operation in deuterium (without a 50/50 mix of deuterium and tritium), an evaluation of these low activation scenarios has recently been initiated.
2. Operating limits on forces and currents
Improvements to the ITER baseline design as a result of the Design Review have been adopted and these offer significant benefits to the reference scenarios. Enhancements include increases in the current and field limits of both the CS and PF coils, changes in the allowed forces on coils and a re-specification of the coil power supply designs. In addition to these, a small outward movement of the location of the inner vacuum vessel shell can impact plasma control that must be included in the scenario analysis. With the baseline design now essentially frozen, extensive analyses are underway to explore the impact of these system design changes over a range of plasma scenarios, plasma control, and limitations to operations.
Modifications to the CS coils, figure 1, along with changes in the plasma wall can alter the operating space available [2] both by modifying the flux consumption needed to reach steady burn conditions and by putting different limits on the allowable forces and currents in the coils. Using static equilibria, we have evaluated changes to the operating space available to ITER for the 15 MA inductive scenario during burn. In figure 2 we show the calculated change in operating space boundaries resulting from the modification of the coils during final design. These boundaries result from limits to either the maximum allowed current in the coils or from forces on the coils. The data are obtained from a series of static equilibrium solutions using a range of current density profile shapes to vary internal inductance. These equilibria are iterated by varying the flux state (representative of different magnetization states for the coils) at a given current density profile and calculating the various forces on the coil system. The boundaries are determined as the flux state for which any coil exceeds its current density limit (e.g. over-drive of the superconducting coils) or magnetic field limits or the forces on the coils exceed the design limitation. Scenarios must operate within these limiting boundaries. The relatively small reduction in operating space in the high flux area results mostly from changes in the detailed design of the CS coils. The differences between the various codes are a result of imposing different shape constraints relative to a target separatrix shape in solving for the free-boundary equilibria that remain within the coil current and force limits. This difference is also a result of the method used to smooth the spatial variation of coil currents themselves that alters the current and force distribution. While the available operating space is reduced, our re-assessment indicates there is still considerable margin for successful operation.

Figure 2. Comparison of operating space changes resulting from final modifications to the CS/PF coil system as calculated with the CORSICA (Casper), TOSCA (Fujeida) and TSC (Kessel) free-boundary equilibrium codes. The 'old' boundaries shown refer to the earlier evaluation of the operating space by Kessel et al [2]. Differences are due to target shape constraints and smoothing of the coil current variations.
Download figure:
Standard image3. Forward free-boundary 15 MA controlled scenario
Free-boundary controller simulations represent our most complete evaluation of the scenario development in that they utilize proposed controllers to maintain the plasma current, shape and vertical stability. In simulations presented here, for plasma vertical stabilization we use the VS1 controller that varies differential current in the coils PF2, PF3 and PF4, PF5 shown in figure 1. The Coppi–Tang transport model [2] is used for simulating the thermal transport since it is fast, robust and defined over the full cross-section of normalized toroidal flux, φ. Having transport defined over the entire range of toroidal flux, e.g. φ = [0, 1] from the magnetic axis to the separatrix, is required for free-boundary controller simulations. This model has been shown to give reasonably good agreement with the profile evolution in DIII-D [9, 10] and TFTR [11] and is currently being evaluated in benchmark studies for other experiments [12]. This model allows for scaling of the edge thermal transport so as to generate an H-mode-like edge pedestal inside the separatrix that affects the overall performance of ITER through the energy transport. The (bootstrap) current density peak resulting from the edge pressure gradient alters the dynamics of the plasma controller. The density profile is prescribed under both L-mode and H-mode conditions with no particle peaking assumed, figure 3. The impurity concentration is set to give an effective charge state of Zeff ∼ 1.8 during burn. The alpha-particle density is simulated from a production rate equation with particle diffusion used to limit the alpha-particle build-up and the potential poisoning of the plasma reaction rates. With the application of 52 MW of heating power, we assume the plasma transitions into H-mode. We do not apply an H-mode access power scaling law so as to simplify the study and analysis of H-mode performance. We also use analytic approximations to the heating profiles and do not rely on auxiliary current drive other than the bootstrap current that is calculated self-consistently via the NCLASS model [13]. The plasma current ramp for these simulations was fixed at the same ramp rate used in the previous studies [2] with full plasma current reached at 80 s. Variations in the current ramp rates were completed with the DINA code and these results are presented later in this paper. We show in figure 3 temperature profiles from the Coppi–Tang model under L- and H-mode conditions. In figure 4, we show a forward feedback control simulation resulting in Q = 10 and Pfusion = 480 MW determined in part from the edge transport assumption giving a pedestal temperature of Tped = 4.5 keV defined as the temperature at sqrt(φ) ∼ 0.95, figure 3(d). The waveform for auxiliary heating is shown in figure 4(a) along with the resulting evolution of alpha heating power and radiation losses. In this simulation, we use feedback on the stored energy to adjust the auxiliary heating from 100 to 130 s to smooth the transition to burn conditions. The resulting coil current waveforms are shown in figures 4(b) and (c). The control voltages shown in figures 4(d)–(f) are the outputs of the VS1 feedback controller with Vfast providing vertical stability control and the slower voltages providing the plasma current and shape variations. All coil currents remain within the allowed limits for the new CS/PF coil systems. The voltage waveforms are realizable with the re-designed power supply system. This provides a baseline 15 MA inductive scenario that satisfies the ITER design performance while remaining within the coil current and force limitations. The resulting current density and q profiles typical of the L- and H-mode phases are shown in figures 5(a) and (b). At these times, saw teeth are present in both L-mode at 80 s and H-mode at 300 s, and result in the flattened current density profiles near the magnetic axis from a time-averaged saw-tooth model. The evolution of the total current density from outside-wall limited ramp-up through the burn and ramp-down is shown in figure 5(c). The pedestal bootstrap current peak near the edge is present in the H-mode phase.

Figure 3. Density profiles for (a) L- and (c) H-mode conditions. The alpha-particle density is obtained from a production rate equation with diffusion limiting the density build-up; D = 0.1χe. The temperature profiles shown (b), (c) from thermal transport using the Coppi–Tang model for χe, χi the electron and ion diffusivities.
Download figure:
Standard image
Figure 4. Free-boundary control simulation using the VS1 control circuit showing (a) performance achieved, Q ∼ 10 at Pfusion ∼ 500 MW and the resulting coil currents with (b) the CS coil and (c) the PF coil currents (in MA-turns). The fast VS1 converter voltage is shown in (d) with the slower plasma shape control voltages on the coils in (e) for the CS and (f) for the PF coils (in V/turn).
Download figure:
Standard image
Figure 5. Current density and q profiles obtained in the free-boundary simulation. The L-mode profiles (a) are typical of the end of the current ramp and the H-mode profiles (b) for the burn. Both show flattening due to saw teeth as is indicated in (c), the total current profile versus time.
Download figure:
Standard imageThe amount of flux consumption determines the overall capacity of the CS-coil system to reach and maintain burn conditions. The internal inductance, li3, dependent on details of the current density profile provides a figure of merit for overall vertical controllability [14]. We show the variation of flux consumption (e.g. CS-coil demand) versus li3 (e.g. vertical stability) for this simulation in figure 6 starting at 3 MA with an outside-wall limited plasma shape at 3.5 s. An important consideration for scenario development is the utilization of the coil system and the margin available to achieve full performance objectives of ITER. Since the amount of flux produced by the coil system is limited, we rely on early heating (10 MW here) applied just after X-point formation to reduce the resistive flux consumption and, thereby, to ensure we do not exceed the CS-coil current limitations before reaching burn. As previously shown in figures 4(b) and (c), the CS and PF coil currents remain within their allowed limits for the duration of this simulation. The plasma shape variation from ramp-up through burn and ramp-down to ∼4 MA is shown in figure 6(b). The VS1 controller maintained both the vertical stability and shapes during the simulation.
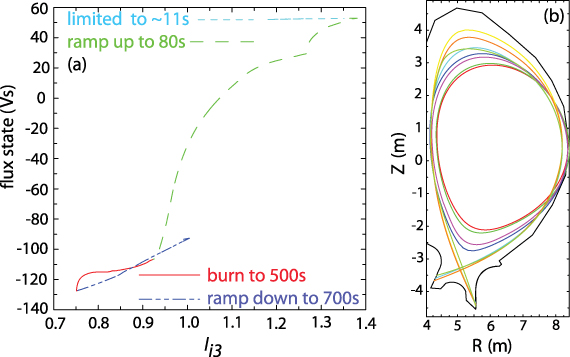
Figure 6. 15 MA (a) flux consumption versus internal inductance li3 over time intervals indicated and (b) controlled shapes.
Download figure:
Standard image4. 15 MA inductive scenario performance variations
A series of scenario simulations were completed to explore sensitivity to the assumptions of the H-mode edge pedestal scaling. These simulations are done with the CORSICA backing-out mode [15] that provides for efficient computation of the scenario evolution for plasma parameter variation studies. In the backing-out evolution, we interpolate between a prescribed set of boundaries when evolving the plasma shape along with thermal transport and sources. At the end of each iteration, we execute and additional free-boundary solution to provide connection with the external circuits (coils) in order to evaluate the coil currents required to provide the interpolated shape along with the forces on the coils. With the shape control provided by a prescribed set of fiducial boundaries, control of the vertical instability with the feedback controller is not required thus allowing for the use of much larger time steps resulting in considerably shorter computational time for a full duration simulation. This mode of operation allows for systematic variation of parameters while still providing most of the information on plasma performance operational limits. Only power supply voltage demands and actual controller performance are not assessed. Since these simulations include the external circuits, they are used to provide the open loop coil currents and flux gap variations required for forward control using the controller. Control via the gap flux variation and vertical stability control must then be verified in additional simulations such as that shown in the previous section. In previous simulations [15], it has been shown that these results remain close to the forward simulations.
We have varied these edge transport conditions to scan the pedestal height over a range consistent with expectations of time-average stability to ELM phenomena. This was done to span the expected range of performance on ITER to evaluate the likelihood of potential operating space difficulties. We note that, for the range of pedestal temperatures simulated, 3.5 keV to 6.5 keV, we can achieve full duration burn with, of course, a variation in the Pfusion obtained. In figure 7, we show results of one of the backing-out simulations with the same waveform design used in the 4.5 keV pedestal case with forward feedback control already discussed. We show the plasma current waveform with the resulting evolution of several plasma parameters. The sensitivity to vertical instability as characterized by li3 is shown in figure 7(a) along with the vertical instability growth rate, γVST. The higher values of li3 for an elongated plasma are potentially more difficult to control. These simulations were run to a longer time in ramp-down than the forward control case as we are currently designing various diverted and wall-limited ramp-down strategies. One such strategy is shown in the ramp-down from a DINA simulation presented in the following section. We show a comparison of the CS and PF coil currents obtained for this case with those obtained in the free-boundary simulation shown in the previous section. We note the consistency of the resulting coil current evolution indicating that these parameter studies well characterize the scenario evolution expected. We are still evaluating the control scenario for late in the current ramp-down. Also shown in figure 7(d) are vertical forces on the CS coils. We show both the coil separation force, (|FzU|+|FzD|)/2, and the net force, |sumFzCS|, and note that both of these remain within the design limits for ITER.
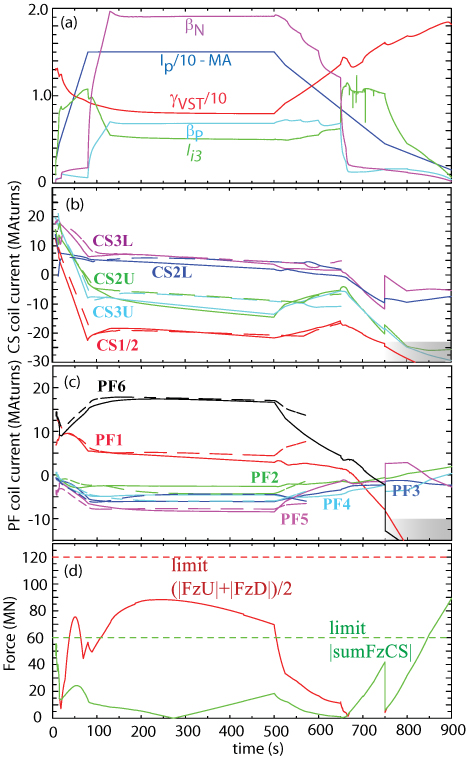
Figure 7. (a) Plasma and stability parameters, CS (b) and PF (c) coil currents where the solid line is the backing out and long dashed line is the forward control and the resulting forces on the CS (d) for the 4.5 keV pedestal case. The difference in coil currents indicates small differences in the shape which are exactly controlled when backing out but controlled by 6 gaps in the forward case. Shaded regions in (b) and (c) are still under development to avoid coil current limits at low plasma current.
Download figure:
Standard imageIn figure 8, we show the evolution of the several scenario simulations superimposed on the statically evaluated operating space boundaries from the CORSICA equilibrium studies for burn conditions (black dashed lines in figure 2). We note that the entire range of scenario evolution remains within the allowed limits for ITER during the plasma burn phase for the pedestal temperature variations considered. This indicates we have a fair amount of flexibility in operating scenarios with respect to varying performance levels determined by the pedestal conditions. We have recently initiated studies of the low- and non-activation operation of the ITER experiment and for inside-wall star-tup. Preliminary CORSICA simulations with deuterium only (no tritium, low activation) and with hydrogen have been completed and are included in the operating space diagram. Without the additional heating power due to the alpha-particle production, this operation is limited to shorter pulse durations due to the need for Ohmic heating to sustain the plasma. The times shown in figure 8 indicate the maximum pulse duration allowed as limited by the CS1 flux capacity. While the pulse durations are significantly shorter than full DT operation, they appear to be adequate for the initial phase of ITER when subsystems are commissioned. While these results indicate a reasonable margin for successful operation of ITER, they reflect the quiescent operation of a defined scenario. Additional issues and considerable work is required to evaluate a range of transient effects expected in experimental operation. These include unplanned H-to-L transitions, dynamics of ELMs interacting with the controllers, and the presence of sawteeth and tearing modes. Also, limitations to controller performance such as might be induced by faults and system noise effects that can result in vertical displacement events need to be evaluated to assess the overall system limitations. These are dependent on the controller design and will be assessed along with development of the plasma control system (PCS).
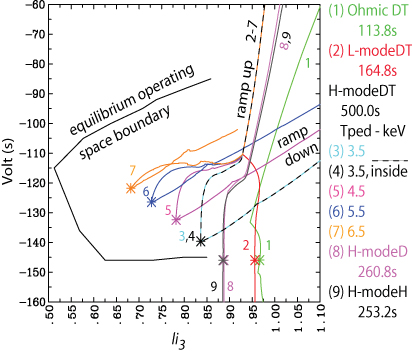
Figure 8. Mapping of scenarios onto the operating space limits for burn conditions indicates a range of operation for ITER.
Download figure:
Standard image5. DINA current ramp exploration
Recent simulations with the DINA code have concentrated on the study of operational ranges of the rates of plasma current ramp-up and ramp-down in the 15 MA scenario. Variations in the current ramp rate can provide for optimization of the available flux drive capabilities of the CS coil to improve the performance of the 15 MA inductive scenario. Different ramp rates will also be needed for modifying the flux diffusion as required to obtain different current density profiles for access to advanced-tokamak regimes. Recent experiments [4, 9] have used variable ramp rates in feedback control of the internal inductance as well. For these reasons, we are exploring limitations to the allowable current ramp rates for ITER. Based on experimental studies of ITER ramp-down possibilities [3, 4], the DINA code is also exploring the shape variations consistent with the experimental predictions of the need to control elongation and density during ramp-down to limit the rise in li3 and, therefore, provide for vertical stability in ramp-down. Stability in ramp-down is more difficult than the ramp-up phase due to the high stored energy and the need to make transitions from the H-mode to L-mode conditions without disrupting. In these simulations, plasma shape variations during the current ramp-down is maintained in a diverted magnetic configuration until the current is reduced to about one-tenth the flattop value.
Several DINA ramp-up and ramp-down simulations have been completed. Simulations were performed using feedback control of plasma current, position and shape, taking into account engineering limits imposed on the coils and their power supplies (maximum currents, voltages, magnetic fields, forces and total power of the converters). Stabilization of plasma vertical displacement, Z, was performed by VS1 controller (6 kV on-load voltages) assuming noise in the dZ/dt diagnostics with a uniform spectrum and RMS value 0.2 m s−1 in the bandwidth 0–1 kHz. The plasma current ramp-up was performed with early transition to diverted configuration (at ≈3.5 MA). The fastest current ramp-up that can be performed was found to be about 50 s and limited by the voltages available for plasma current and shape control. Feedback control of the internal inductance, li3, by variation of the plasma current ramp-up rate was also demonstrated in DINA simulations [16]. This method was experimentally verified in DIII-D [9].
Nominal plasma current ramp-down for the 15 MA scenario developed in DINA simulations has the following two phases: (1) plasma current ramp-down in H-mode from 15 to 10 MA in diverted magnetic configuration consistent with reduction of plasma elongation keeping q95 ≈ 3, then (2) plasma current ramp-down in L-mode in diverted configuration to 1.4 MA. DINA simulations demonstrate the PF system can perform plasma current ramp-down during the time between 60 s (voltage limited) and 300 s (current limited). Scenarios of this type have been successfully validated in experiments [3, 4]. The DINA simulation shown in figure 9 is considered to be an extreme case scenario. The current is ramped from 2 to 15 MA in 50 s, the fastest achieved to date with control maintained. Rather than being limited by current or forces on the coils or by vertical stabilization demands, this case is limited by the power supply voltage capabilities required to drive the Ohmic plasma current and for shape control. It is characterized by central, inboard start-up with formation of the diverted configuration at 3.5 MA (9.5 s) followed by 4 MW of heating during the ramp. Auxiliary heating of 52 MW is used to initiate the plasma burn starting at 75 s to achieve burn duration of 425 s terminated by an H-to-L transition and current ramp-down in 66 s.
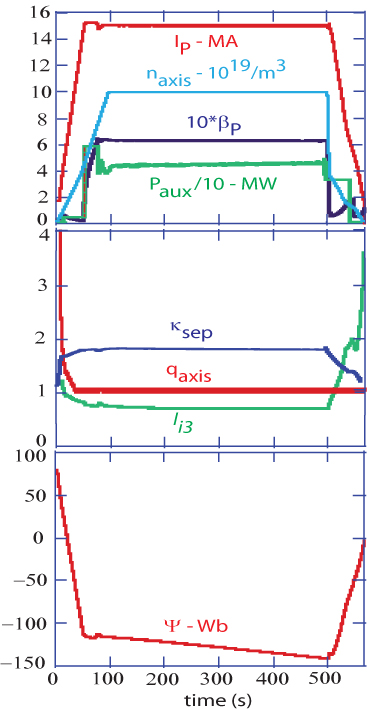
Figure 9. Plasma parameters from the extreme maximum current ramp scenario.
Download figure:
Standard imageIn these simulations only the VS1 controller is used to maintain shape and vertical stability while keeping coil currents, magnetic fields and forces within the engineering limits. We show the voltage and current waveforms for the PF and CS coils in figure 10. Both the feed-forward demand (red, solid) and delivered values (blue, dashed) for current and voltage from the free-boundary control simulation are shown. Based on the experiments simulating ITER operation, the plasma elongation is programmed in a manner similar to that on the experiments. In figure 11, we show the programmed shape evolution for this simulation and note the elongation ramp starting at 500 s along with the reduction in density as shown by the parameter evolution in figure 9.
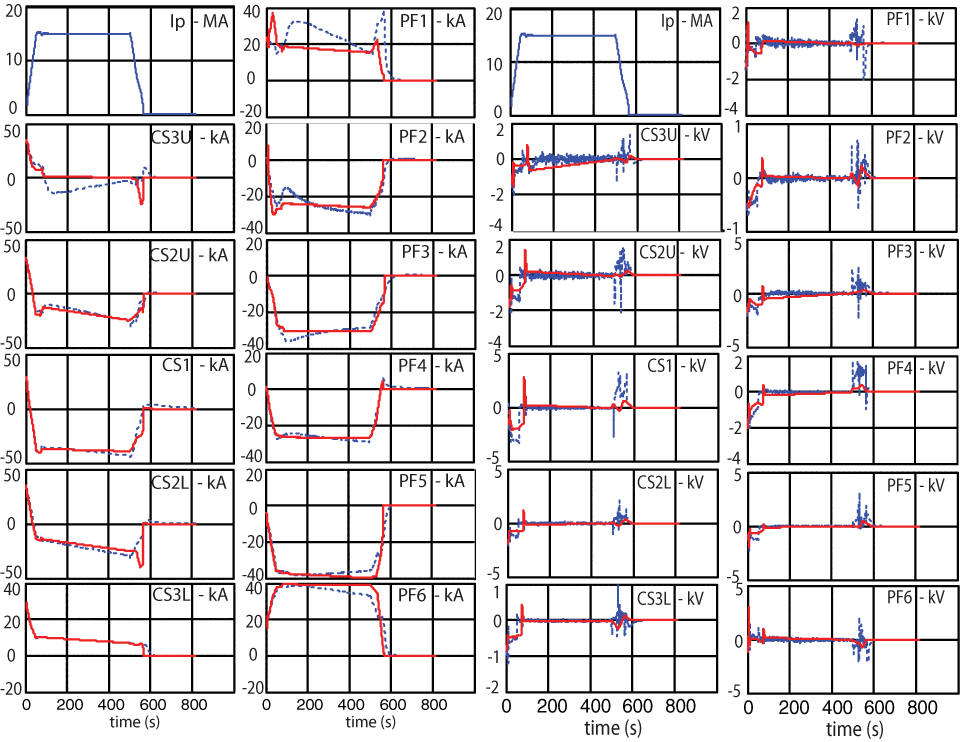
Figure 10. Plasma current with CS and PF coil currents (left) and voltages (right). Solid curves are feed forward and the dotted curves are the actual waveforms. The coil currents and forces remain within the capability of the coil system.
Download figure:
Standard image
Figure 11. Shape evolution in ramp-down of elongation with current.
Download figure:
Standard image6. Future
These simulations indicate a consistency of core confinement performance projections with transport-model-based predictions. The free-boundary transport simulations with control demonstrate the simulated controllability of the ITER plasma. Several issues must yet be addressed ranging from different operating modes (hybrid, steady-state) to more advanced controllers with improved capabilities. While the VS1 circuit for control works well, concerns remain for responses to perturbations such as loss of auxiliary heating power and unplanned transitions from H-mode back to L-mode that threaten disruptive conditions. The addition of the internal stabilizing coils affords a faster response for handing such unplanned events and more immunity to noise in the feedback control system loop. CORSICA and DINA simulations utilizing the new VS3 circuit have recently been started with early simulations indicating significant advantages when these coils are used. The ITER Organization has begun the formal process for design of a PCS that will control all aspects of the plasma evolution: vertical and shape control, stabilization of instabilities, event handling, and profile control for advance modes of operation. This development will utilize simulation capabilities as an integral part of the PCS development heading into experimental operations.
7. Summary
We have completed several simulations using two free-boundary transport simulation codes, CORSICA and DINA, for the re-designed ITER coils and first wall. The free-boundary transport simulations with control demonstrate the controllability of the ITER plasma. Several issues associated with different operating modes, transient events and advanced controllers with improved capabilities need to be addressed. These simulations use a prescribed density profile evolution and the Coppi–Tang thermal transport model to evolve the plasma for the baseline 15 MA inductive scenario. We find that the vertical position and shape can be controlled with the VS1 circuit that uses only the outer PF coils for control and the CS coils for Ohmic current drive. We have re-evaluated the available operating space for the recent modifications to the ITER coil and first wall geometries and have found small reductions in the available operating space. However, the time-dependent simulations remain well within this operating space for current, voltage and force limitations and indicate that ITER performance and control in the 15 MA inductive scenario is likely achievable. We have also developed a viable ramp-down scenario for the 15 MA inductive case that was validated experimentally. In addition, we have varied current ramp rates and achieved 50 s ramp-up and 66 s ramp-down times limited only by the voltage capabilities of the power supply systems and not by vertical stability. These time-dependent simulations represent the current state-of-the-art in producing scenarios representative of expected experimental operations
Acknowledgments
The views and opinions expressed herein do not necessarily reflect those of the ITER Organization.