


Abstract
Tungsten (W) is considered to be one of the most promising plasma-facing materials (PFMs) for next-step fusion energy systems. However, as a PFM, W will be subjected to extremely high fluxes of low-energy hydrogen (H) isotopes, leading to retention of H isotopes and blistering in W, which will degrade the thermal and mechanical properties of W. Modelling and simulation are indispensable to understand the behaviour of H isotopes including dissolution, diffusion, accumulation and bubble formation, which can contribute directly to the design, preparation and application of W as a PFM under a fusion environment. This paper reviews the recent findings regarding the behaviour of H in W obtained via modelling and simulation at different scales.
Export citation and abstract BibTeX RIS
1. Introduction
Nowadays, energy shortage drives us to spend great effort on nuclear fusion energy, which is considered as a clean and abundant energy resource for the future. Magnetic confinement fusion energy is being developed universally via the International Thermonuclear Experimental Reactor (ITER) project [1], which aims to demonstrate the extended burn of a deuterium–tritium (D–T) plasma and thus the scientific and technological feasibility of fusion power. The final application of nuclear fusion energy is largely dependent on the development of materials in a thermonuclear fusion device 'tokamak', and the choice of the plasma-facing materials (PFMs) is one of the key issues [2]. In an extreme fusion environment, PFMs will be exposed to high fluxes of hydrogen (H) isotope and helium (He) ions as well as neutron irradiation. Hence, the microstructure and the properties of the PFM under these conditions are among the crucial issues that need to be addressed before one can have access to nuclear fusion energy.
Tungsten (W) is considered to be one of the most promising candidates for PFMs in ITER [3], DEMO [4] and other future fusion reactors, due to its attractive properties such as high melting point (3690 K) [5], high thermal conductivity (173 W m−1 K−1), and low sputtering yield for light elements [6]. As a PFM, W will be subjected to extremely high fluxes of low-energy H isotopes and He ions in future fusion devices, leading to retention of H/He and blistering in W. This will degrade the thermal and mechanical properties of W, thus reducing the lifetime of the W-based PFM. Furthermore, impurity release and sudden gas desorption from wall materials could lead the core plasma to disrupt. T inventory is another issue that is very important for safety considerations in PFMs, and the efficiency of the T removal techniques is critically dependent on the T retention.
H is a very mobile species that can be trapped by defects (either intrinsic or induced by irradiation) including vacancies, impurities, dislocations and grain boundaries (GBs). H can be ejected from the trapping sites by thermal processes and re-enter the mobile population to diffuse towards the surfaces where H2 molecules can be formed due to the recombination of H. All along their paths, the H atoms can be trapped again depending on the concentration of traps. Several key parameters are needed to get a correct description of these phenomena: the concentration and energy of the trapping sites, proper description of the surface events and the H diffusion coefficients.
On the other hand, it is shown experimentally that the behaviour of H isotopes in W depends on the energy of the isotope particle, the presence of impurities, the surface temperature as well as the temperature gradients within the PFM during steady state and thermal shock loading. Furthermore, the microstructure, composition and pre-damaged state (i.e. the presence of voids, bubbles and cracks) also lead to different H behaviour.
H bubble formation is clearly observed on W surfaces after H plasma irradiation under different experimental conditions (see [7–10] for reviews of the subject). Defects in metals such as vacancies, dislocations and GBs are considered to be the origin of the H bubble formation in W. The depth of trapped H can be divided into three zones, i.e. (i) the near-surface layer (up to a depth of ∼0.2 µm), (ii) the sub-surface layer (from ∼0.5 to ∼2 µm) and (iii) the bulk (>5 µm) [11]. The shape and size of the H bubble depend on the microstructure of W as well as the irradiation temperature. The size of the H bubbles varies from 1 µm (or even less) up to 100 µm, and the height above the surface induced by the bubbles of W reaches 10 µm and even greater. The internal gas pressure in the H bubbles has been estimated to be up to a few tens of GPa [12, 13], and H bubbles will thus exert a large strain to the surrounding W lattice. The plastic deformation induced by H super-saturation may be responsible for the modification of the near-surface structure and the formation of trapping sites for the sequential H isotopes [7].
Consequently, the behaviour of H isotopes and their effects on the properties of W due to H isotope irradiation are among the key concerns for the W-PFM and have been under intensive investigation. Detailed descriptions of H behaviour at different scales have become attainable due to the rapid development of advanced algorithms and computing capability. Modelling and simulations provide indeed an indispensable way to explore the underlying physical mechanisms and compare with experiments. Various computational methods, covering different space and time scales, are employed to investigate the behaviour of H in W: first principles based on density functional theory (DFT), molecular dynamics (MD), kinetic Monte Carlo (KMC), cluster dynamics (CD) and finite element methods (FEM). So far, the studies on H behaviour in W focus mainly on small-scale simulations, and are being extended to larger scales.
In this paper, we review the recent knowledge gathered on the behaviour of H in W, which has been obtained via modelling and simulations at different scales. In the first part (section 2), we summarize the available empirical W–H potentials that are dispensable for the MD simulation. Then, we review the knowledge gathered regarding the behaviour of H in intrinsic W in section 3. In sections 4–8, we summarize the H behaviour at possible traps including vacancies, GBs, surfaces and He, as well as other impurities and solute atoms. A summary and outlooks are given finally in section 9.
2. W–H empirical interatomic potentials
As stated above, one needs to understand how H isotopes will dissolve and diffuse in the bulk and at different traps and how they will interact with the traps during their migration. The electronic and atomic scale is thus a very crucial step in the modelling process and many interesting results have been obtained from first principles. As these calculations only allow one to model small supercells and to give access to 0 K properties most of the time, classical MD simulations with empirical potentials have also been employed a great deal. The empirical potential is thus quite essential, and it determines the accuracy of the MD simulation. In this part, we summarize the recent developments of semi-empirical interatomic potentials of the W–H system.
2.1. W–W potential
A series of short-ranged two-body potentials, most of which exhibit a Morse-type function, started to be developed at the beginning of the 1960s [14–21]. The main properties/data used to fit these potentials were the lattice constant, the elastic constants, the cohesive energy and the bulk modulus [14–19], as well as the formation energies of the vacancy and the self-interstitial atom (SIA) [20, 21]. In the 1980s, a big step forward was achieved with the birth of many-body potentials such as the embedded atom method (EAM) [22], Finnis–Sinclair (FS) [23], effective medium [24] and other similar types of potentials [25–28]. In the EAM scheme, the total energy of the system VTOT can be expressed as
By introducing a many-body contribution, i.e. the second term of equation (2), the description of metal cohesion was greatly improved. Furthermore, this method is very convenient to combine other elements, i.e. to build potentials for alloys. In the FS scheme, the Fi term of the EAM formulation is replaced by a square root
 , which seems to be appropriate for bcc or half-filled d-band transition metals. The original FS potential was recently successfully applied by Fu et al to study the thermal conductivities of W at different temperatures [29]. In 1987, Ackland and Thetford developed a modified FS potential [30], which well describes the properties of both bulk W and the vacancy. Another modified EAM potential with second-nearest-neighbour extension was constructed in 2001 [31], and the calculated properties of W were very close to those of the FS–Ackland potential. In 2007, Derlet et al [32] developed yet another FS potential to study point defects in W and the mobility of SIAs. This potential was used to investigate the behaviour of SIAs formed in displacement cascades by Park et al [33]. In 2013, Marinica et al [34] developed a series of EAM potentials, which can well describe the physics of screw dislocations in W in comparison with other potentials. Recently, one of these EAM potentials has been used to investigate the finite temperature properties of screw dislocations in W by Cereceda et al [35].
Potentials based on the bond order formalism have been developed recently, which better describe the different bonding states of the atoms. In 2007, Mrovec et al [36] introduced a bond order potential (BOP) to further study defects such as GB and dislocations in W. Whereas, in 2010, Ahlgren et al [37] introduced a BOP predicting accurate formation and migration energies for point defects in W, as these properties are crucial when one wants to model high-energy collisions such as the ones created by neutrons or high-energy particles impinging a metallic matrix. Finally, an electron-temperature-dependent empirical interatomic potential was developed for W to address the electronic excitations that can take place during ion bombardment [38]. Using their potential to study sputtering erosion, Khaskhouri and Duffy [39] demonstrated the sensitivity of surface damage to the model used to describe the electronic thermal transport. A comparison of some of the potentials described above can be found in [40]. The sensitivity of the primary damage to the interatomic potential is now clearly established [41], and the predictions of these potentials in radiation damage studies can be found in the recent work [42].
Recently, Sand et al [43] investigated the dynamics of defect production under 150 keV collision cascades in W using two different EAM potentials and one BOP, respectively. The EAM potentials show evidence of the formation of interstitial-type dislocation loops, in good agreement with experimental observations. However, the BOP did not reproduce experimental findings. This should be attributed to the difference of the interatomic bonds description between the EAM potential and the BOP.
2.2. W–H–X potential
The first attempt to study the behaviour of H in W by MD can be ascended to the 1970s, in which Creery et al investigated the recombination and adsorption dynamics of H on the W surface with a modified two-body London–Eyring–Polyani–Sato (LEPS) potential [44]. After that, no more potential was developed to study the W–H system for a long period, until 2005, where a valuable progress in the simulation of H radiation on W was made by Juslin et al [45]. They derived a BOP based on a Tersoff potential for carbon (C) [46] for modelling non-equilibrium processes in the W–C–H system. Compared with the EAM potentials, the Tersoff potential has the advantage of being well suited for modelling compounds involving metals (W) and non-metals (C, H), despite the lower efficiency in comparison with the EAM potential. The BOP has been used to simulate low-energy bombardment of D impinging onto crystalline as well as amorphous WC surfaces [47, 48], which demonstrates that the C-terminated surfaces exhibit larger sputtering yields than the W-terminated surfaces.
In 2011, Li et al [49] developed another BOP-type W–H potential, focusing more on the interaction between H and point defects. The calculated formation and migration energies of vacancy and interstitials in W are closer to the experimental data for Li's potential than those for Juslin's potential, as can be seen in table 1. Better consistency with the first-principles calculations was also achieved for the W–H interaction with Li's potential as regards the formation energies of H at different sites: tetrahedral interstitial site (TIS), octahedral interstitial site (OIS) and substitutional site (SS) (table 2). However, Juslin's potential can better describe the W–Hn complex than Li's potential, and it was used very recently to model D bombardment of monocrystalline W [50]. The results obtained from Juslin's potential indicate that the formation of gas bubbles is caused by the near-surface D super-saturation region and the subsequent plastic deformation induced by the local high gas pressure.
Table 1. Properties of the bulk, vacancy, SIAs and the dimer in W obtained with different potentials in comparison with experiments and first-principles results. Ec, Ef and Em are the cohesive energy (eV/atom), formation energy (eV) and migration energy (eV), respectively. Denotations of other symbols are as follows: a, the lattice constant (nm); B, bulk modulus (GPa); cij, the elastic constant (GPa); Tm, melting point (K); 1 nn, first-nearest-neighbour; 2 nn, second nearest neighbour; TIS, tetrahedral interstitial site; OIS, octahedral interstitial site; r0, the dimer bond distance (nm).
| Exp. | DFT | FS Finnis et al [23] | EAM Lee et al [31] | BOP Juslin et al [45] | EAM Marinica et al [34] | FS Derlet et al [32] | BOP Mrovec et al [36] | BOP Li et al [49] | |
|---|---|---|---|---|---|---|---|---|---|
| Bulk | |||||||||
| Ec | −8.90 [51] | −7.41 [45] | −8.90 | −8.66 | −8.89 | −8.90 | −8.90 | −8.90 | −8.91 |
| a | 0.32 | 0.32 [56] | 0.32 | 0.32 | 0.32 | 0.31 | 0.32 | 0.32 | 0.32 |
| B | 308–314 [52] | 320 [57] | 310 | 314 | 308 | 310 | 307 | ||
| c11 | 501–521 [52] | 522 [57] | 522 | 533 | 542 | 523 | 522 | 515 | |
| c12 | 199–207 [52] | 204 [57] | 204 | 205 | 191 | 202 | 160.6 | 204 | 203 |
| c44 | 151–160 [52] | 149 [57] | 161 | 163 | 162 | 160 | 159 | 160 | 162 |
| Tm | 3695.00 [5] | 4600 | 2750 | 4550 | |||||
| Vacancy | |||||||||
| Efv | 3.7 ± 0.2 [53] | 3.11 [58] | 3.63 | 3.95 | 1.68 | 3.81 | 3.56 | 3.83 | 3.52 |
| Emv | 1.8 ± 0.1 [53] | 1.66 [58] | 1.44 | 1.61 | 1.77 | 1.81 | |||
| Ef2vac(1 nn) | 6.71 [32] | 6.83 | 3 | 7.09 | 6.42 | ||||
| Ef2vac(2 nn) | 6.93 [32] | 6.86 | 3.28 | 7.16 | 6.89 | ||||
| SIA | |||||||||
| Ef(1 0 0) | 11.49 [56] | 8.65 | 8.93 | 12.72 | 11.49 | 12.01 | |||
| Ef(1 1 0) | 9.84 [56] | 8.44 | 8.98 | 8.77 | 10.82 | 9.84 | 9.53 | ||
| Ef(1 1 1) | 9.06 ± 0.63 [54] | 9.55 [56] | 7.81 | 9.62 | 10.53 | 9.55 | 9.53 | ||
| Ef_TIS | 11.05 [56] | 8.82 | 8.6 | 11.87 | 11.05 | 10.75 | |||
| Ef_OIS | 11.68 [56] | 8.86 | 9.92 | 12.52 | 11.68 | 12.05 | |||
| Dimer | |||||||||
| Ec | −2.5 ± 2.5 [55] | −2.05 [45] | −3.10 | −2.71 | −2.48 | −1.44 | |||
| r0 | 0.22 [55] | 0.20 [45] | 0.23 | 0.24 | |||||
Table 2. Formation energies (eV) of single H atom at different occupying sites (TIS, OIS, SS) in W.
| Configuration | DFT [59] | BOP Juslin et al [45] | BOP Li et al [49] |
|---|---|---|---|
| TIS | 0.88 | 1.04 | 0.86 |
| OIS | 1.26 | 1.40 | 1.18 |
| SS | 4.08 | 4.06 | 4.04 |
Finally, to better understand the synergistic effects of H and He, Li et al [60] fitted a W–H–He BOP in 2012 based on the W–H potential they developed. With these potentials, the properties of W–H and W–He are in agreement with the DFT calculations, and so far it is the only potential that can be used to study the behaviour of W containing He and H atoms simultaneously.
It should be noted that the accuracy and the reliability of interatomic potentials can be assessed by their specific applications. For the potential of W, the EAM potential developed by Derlet et al [32] can well describe the properties of vacancy, SIAs and the 〈1 1 1〉 crowdion. The BOP developed by Mrovec et al [36] can predict the reconstruction of W (1 0 0) surface successfully, making it suitable for both the bulk and the surface of W. The EAM potential by Marinica et al can well describe the physics of screw dislocations in W [34]. For the W–H potential, the BOP developed by Li et al [49] is suitable to describe the interaction between H and W at the defects.
3. H behaviour in intrinsic W
3.1. H dissolution
A single H atom can occupy three possible sites in W: the TIS, the OIS and the SS. The DFT calculations demonstrate that the TIS is the most favourable site for H in W, as is also the case in Fe. Table 3 shows the solution energies of H in W calculated by different groups along with the experimental data.
Table 3. Solution energies of H in W calculated by different groups compared with the experimental results. All the solution energies are referred to one half of the energy of an H2 molecule (−3.38 eV) without zero point energy (ZPE) correction unless specified particularly.
| Configurations | TIS (eV) | OIS (eV) |
|---|---|---|
| DFT calculations | 0.88 [59] | 1.26 [59] |
| 0.88 (with ZPE 1.00) [61] | 1.26 (with ZPE 1.38) [61] | |
| 0.86 [62] | 1.26 [62] | |
| 0.95 [63] | 1.33 [63] | |
| 0.87 [64] | — | |
| Experiment | 1.04 ± 0.17 [65] | |
The necessity of considering the ZPE for the light element of H has been demonstrated in the dissolution of H in W [61, 63]. The zero point energy (ZPE) corrections can be obtained as
 , in which vj are the vibration frequencies. The ZPE of H is shown to have a significant effect on the solution energy, but the relative stability of H at the TIS and the OIS remains unchanged. When one takes the ZPE into account, the calculated solution energies are in good agreement with the experimental ones [65].
To shed light on the relative stability of H at the TIS and the OIS, Liu et al [59, 66] explored the underlying physical mechanisms. First, distribution maps of valence charge density were drawn to reveal the features of the atomic bonds. The strongest directional bond forms between H and W for the TIS case, and gives rise to the lowest formation energy. Secondly, local density of states (LDOS) for H and W as the first nearest neighbour (1NN) of H shows a stronger hybridization between H-1s and W-5d for the TIS case as compared with the OIS one. This also directly explains the fact that the TIS is the most stable site for H. Thirdly, the electron localization function (ELF) was found to be higher for the TIS than that for the OIS [66]. Generally, for H dissolution in metals, sites with more localized electrons are favoured to achieve a more stable 1s2 valence electronic structure. This explains the higher stability of H at the TIS than at the OIS.
To explore the possibility of forming an H2 molecule, the interactions between two atoms in W have been extensively studied [59, 67–69]. Two H atoms are shown to have a very low binding energy with no more than 0.1 eV along the 〈1 1 0〉 direction at an optimum distance of ∼2.2 Å. Since the H–H bond length for an H2 molecule is 0.75 Å, such a low binding energy clearly indicates that self-trapping of H in W is almost impossible, as confirmed by the KMC simulations [67].
3.2. H diffusion
Normally, H diffuses through two possible pathways in bcc metals, i.e. TIS → TIS and TIS → OIS → TIS, as suggested by several modelling works [59, 64, 70, 71]. For W, the DFT results [59, 63, 64] show that the H diffusion barrier of the later path is ∼0.18 eV higher than that of the former, indicating that the TIS → TIS path is energetically more favourable for H diffusion. The diffusion barriers of H obtained by different methods are listed in table 4.
Table 4. Diffusion barriers of H in W obtained by different computational methods as well as the experiment.
| Methods | Diffusion barrier (eV) |
|---|---|
| Drag method | 0.20 [59] |
| NEB | 0.21 [63] |
| CI-NEB | 0.42 (0.38 with ZPE) [64] |
| Experimental | 0.39 [65] |
Despite similar system size, kinetic energy cutoff, and k-meshes adopted in nudge elastic band (NEB) and climbing image nudged elastic band (CI-NEB) calculations, large discrepancies in the diffusion barriers for H in W can be found (table 4). The reason is unknown, but may come from the fact that the CI-NEB method constitutes a slight but nontrivial modification to the regular NEB, and provides an improved estimate of the reaction coordinate close to the saddle point. As for the discrepancy between experimental and computational results, it is well known that real materials always contain various defects, which can act as traps for the H atoms and make the diffusion barrier appear higher than that in the perfect bulk.
According to the harmonic transition state theory (TST), the Wert and Zener's formulation [72] of diffusion can be applied to calculate the diffusivity of H in W, which can be expressed by

where λ is the jump length, v0 is the vibration frequency, D0 is the pre-exponential factor and Ea is the diffusion barrier. Using equation (2) and the data of table 4, Johnson and Carter [64] obtain a diffusivity D = 8.93 × 10⁻⁷ exp(−0.38 eV/kBT) m2 s−1. Figure 1 shows the calculation results of H diffusivity in W together with the experimental ones.

Figure 1. Calculated H diffusivity in W in comparison with the experimental values.
Download figure:
Standard image High-resolution imageIn addition, Heinola and Ahlgren [63] reported that the quantum effects are significant for estimating the diffusivity of H at low temperatures, similar to the quantum effects in simulating the motion of dislocations observed by Proville et al [73]. For example, at 29 K, the H diffusion coefficient is calculated to be 6.3 × 10⁻¹⁴ m2 s−1 with the quantum effect correction, in much better agreement with the experimental result ((1–10) × 10−22 m2 s−1) than the extrapolated experimental D from high-temperature measurements (6.9 × 10−75 m2 s−1).
Experimentally, H diffusivity in W has been determined based on degassing and permeation measurements. However, the temperature ranges used in these experiments are limited above room temperature, mainly because quantum effects as mentioned above are estimated to play a significant role at lower temperatures. The experimental value of D = 4.1 × 10⁻⁷exp(−0.391 eV/kBT) m2 s−1 obtained by Frauenfelder [65] in the temperature range 1200–2400 K is considered to be the best estimate of H diffusivity in W [8, 9]. Other experimental results [74, 75] are also shown in figure 1 for comparison.
3.3. H concentration
The equilibrium concentration of H in W can be determined by

where P is the background pressure and P0 is the reference pressure (taken as the standard pressure in comparison with the experimental results), k and T are the Boltzmann constant and the absolute temperature, respectively. ΔS is the solution (formation) entropy in reference to H2 gas of standard pressure, which is chosen as −5.5 k for H in W [76]. Liu et al [77] calculated H equilibrium concentration at typical temperatures ranging from 600 to 2000 K, as listed in table 5. For example, the solution concentration is 2.3 × 10⁻¹⁰ at 600 K and 1.8 × 10⁻⁷ at 1000 K, respectively.
Table 5. H equilibrium concentration (atomic ratio) in W at 600–2000 K.
| T (K) | 600 | 800 | 1000 | 1200 | 1400 | 1600 | 1800 | 2000 |
| CH(H/W) | 2.3 × 10⁻¹⁰ | 1.5 × 10⁻⁸ | 1.8 × 10⁻⁷ | 1.1 × 10⁻⁶ | 3.4 × 10⁻⁶ | 7.8 × 10⁻⁶ | 1.6 × 10⁻⁵ | 2.7 × 10⁻⁵ |
3.4. Effects of strain on H dissolution and diffusion
The internal gas pressure in H bubbles is estimated to be up to a few tens of GPa, and H bubbles will thus exert a large strain to the surrounding lattice. This is believed to be an important factor affecting H bubble formation. The effects of strain on H dissolution and diffusion behaviours have been investigated employing DFT [78, 79].
Under an isotropic (hydrostatic) strain [78, 79], H solution energy decreases 'monotonically' with increasing tensile strain but it increases with increasing compressive strain, as shown in figure 2(a). This is in good agreement with the linear elasticity theory expectations. The TIS remains to be the preferred site under all strains. In addition, the H diffusion energy barrier under isotropic strain has also been demonstrated to decrease (increase) with increasing tensile (compressive) strain [78]. Consequently, the isotropic tensile strain makes the dissolution and diffusion of H easier in W, while the isotropic compressive strain makes them more difficult.

Figure 2. H solution energy at the TIS and the OIS as a function of strain. (a) Isotropic strain, (b) anisotropic strain, (c) strain induced H position change starting at the TIS-I site [79]. Reproduced with permission from Zhu H.B. et al 2012 Phys. Rev. Lett. 109 135502. Copyright (2012) by the American Physical Society.
Download figure:
Standard image High-resolution imageWhen an anisotropic strain is applied, the lattice symmetry is broken and two different TIS and OIS configurations need to be considered, denoted here as TIS-I, TIS-II, OIS-I and OIS-II, respectively [79]. As shown in figure 2(b), the results at the TIS-II and the two OISs again show a monotonic strain dependence. Surprisingly, at the TIS-I the solution energy shows a non-monotonic dependence on strain, and most importantly, it 'effectively' decreases with the increase in both signs of strain. It is important to realize that the common expectation of a monotonic dependence of H solution energy on strain has a prerequisite condition that the H atom stays at the same location under strain, which is also a presumed condition in most studies so far in the literature. However, this condition can break down because of the broken symmetry due to the anisotropic strain, which is especially important for H at the TIS-I. Figure 2(c) shows an example of H movement in W under strain when initially placed at the TIS-I, as obtained from our first-principles calculations. It is such unusual strain-induced H motion that is responsible for the observed anomalous non-monotonic dependence of H solution energy on strain, leading to energy decreasing under both signs of strain.
The strain in the W lattice surrounding the H bubble must be highly non-uniform and anisotropic due to the low-symmetry surface environment and the irregular size and shape of H bubble. Since the TIS-I remains to be the preferred site with lower energy than the TIS-II and the two OISs under strain, as shown in figure 2(b), this unusual TIS-I behaviour will dominate H solubility in W. This implies that H solubility can be enhanced by applying either a tensile or compressive anisotropic strain. A strain-triggered cascading effect on H bubble growth in W as well as other bcc metals is proposed [79], which is schematically shown in figure 3. H solution energy will be lower with increasing anisotropic strain, leading to an increase in the H concentration, which facilitates further growth of H bubble. As the bubble grows bigger it induces even larger anisotropic strain around it which in turn attracts more H to make the bubble grow even larger.
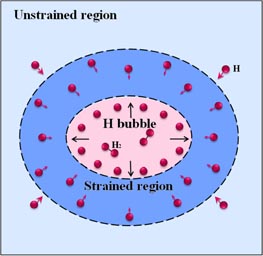
Figure 3. Schematics of strain-triggered cascading effect on H bubble growth in W.
Download figure:
Standard image High-resolution image3.5. H effects on the ideal strength
The accumulation and the retention of H can significantly influence the mechanical properties of W. The ideal strength is the stress required to yield or break a perfect crystal. It forms an upper limit to the strength of the material, which is of both scientific and engineering interest and can be determined by a first-principles computational tensile test (FPCTT). To understand the mechanical properties of materials, one has to investigate the ideal strength of both perfect and defective systems. In the FPCTT, a uniaxial tensile strain is applied to the chosen crystalline direction, and the corresponding stress is calculated according to the Nielsen–Martin scheme [80, 81]. The tensile stress σ is calculated from

where E is the total energy and Ω(ε) is the volume at a given tensile strain of ε.
The ideal tensile strength of W has been calculated using DFT by many groups [82–84]. As shown in figure 4(a), the ideal tensile strength of bulk W in the [0 0 1] direction is 29.1 GPa according to the calculation by Liu et al, which agrees with the values of 28.9 GPa obtained by Sob and Wang [82] and 29.5 GPa by Roundy et al [83], respectively. For the [1 1 0] and [1 1 1] directions, Liu et al found the ideal tensile strength to be 49.2 GPa and 37.6 GPa (figure 4(a)), whereas Sob and Wang [82] obtained 54.3 GPa and 40.1 GPa, respectively. The [0 0 1] direction is shown to be the weakest direction in W.

Figure 4. (a) Stress as a function of tensile strain in the [0 0 1], [1 1 0] and [1 1 1] directions in the bulk W [84], reprinted from Liu Y.L. et al 2009 Nucl. Instrum. Methods Phys. Res. B 267 3282 with permission from Elsevier, and (b) stress as a function of tensile strain in the [0 0 1] direction in W with and without H [66]. Reproduced with permission from Liu Y.L. et al 2010 Chin. Phys. Lett. 27 127101. Copyright (2010) by the Chinese Physical Society.
Download figure:
Standard image High-resolution imageWhen an H atom is embedded, the ideal tensile strength of W along the [0 0 1] direction decreases to 27.1 GPa at a strain of 12% (figure 4(b)), which is about 6.9% lower than that of pure W, suggesting that H will degrade the ideal tensile strength of W [66]. The degradation can be attributed to the fact that H weakens the binding and cohesion among W atoms.
4. H behaviour at vacancies
4.1. Interaction of single H with vacancies (including SIAs)
Norskov et al reported that H isotopes have a strong binding to the vacancy in metals [85, 86]. Effective-medium theory indicates that the energy of H in a metal is a function of the metal electron density [85]. The binding energy of D with a vacancy is then calculated to be a result of the interaction between D and the metal valence electrons, which only depends on the average electron density surrounding D. There exists an optimal electron density for which the D-vacancy binding energy reaches a minimum [86]. However, W was not considered in these early works.
The first full and detailed DFT description of H trapping and bubble formation in metals was reported by Liu et al [87]. By calculating H embedding energy in the vicinity of a vacancy, Liu et al found that the most stable site for a single H atom is a position ∼1.28 Å off the vacancy but close to the OIS, with a binding energy of 1.18 eV. Furthermore, H was suggested to bind onto an isosurface of the same charge density (0.11 electron Å−3) with six minimum sites surrounding the vacancy [87]. Johnson and Carter [64] reported similarly that H prefers to sit at an octahedral-like site with a binding energy of 1.24 eV. If the ZPE of H is considered, the binding energy becomes 1.41 eV, 0.17 eV higher than that without the ZPE. Heinola et al [88] also showed that the lowest energy site for H in the vicinity of a vacancy is the distorted octahedral site, where H is bound to its nearest W, and the binding energy is 1.28 eV (1.43 eV with the ZPE correction).
In addition to the vacancy, the SIA as another point defect also plays an important role on the H behaviour in W. However, only limited studies focused on the interaction between H and the SIA in W. The 〈1 1 1〉 SIA geometry has been demonstrated to be the most stable in W [88, 89]. Heinola et al [88] reported that an SIA cannot serve as an effective H trapping centre close to room temperature. However, in the light of the work on the role of strain on H dissolution, it can be expected that the presence of H could facilitate the formation of SIA clusters and loops, which can trap H efficiently.
4.2. Interaction of multiple H with vacancy
When many H atoms are trapped by one vacancy, the binding energy varies with the numbers of H atoms. Figure 5 represents the binding energy as a function of H number obtained by different groups all using the first-principles calculations [64, 71, 87, 88, 90–92]. Despite the difference in the absolute energy values, the binding energy exhibits the same trend: it decreases when the number of H in the vacancy increases.

Figure 5. H binding energy as a function of number of H at the vacancy in W.
Download figure:
Standard image High-resolution imageLiu et al [87] propose that the additional H binding depends on the isosurface of the optimal charge density for H, and that the H–H interaction at the vacancy is repulsive. As more H atoms are added, the isosurface of optimal charge density of H shrinks to the vacancy centre and disappears finally, leading to a binding energy increase. Johnson and Carter [64] considered this trend as a result of subsequent H–H repulsion related to H–H distances. Two H atoms prefer to occupy opposite OISs separated by a distance of 3.14 Å, rather than sit in neighbouring OISs (separated by 2.22 Å). This suggests that the H–H interaction becomes repulsive when the H atoms get close. It can be noticed, however, that the first two H atoms have the same binding energies (1.24 eV), which implies that the repulsion is weak when the H atoms stay apart from each other. The repulsion between H atoms becomes larger when the number of H atoms increases because the distance between them decreases (e.g. 2.07 Å for five H atoms and 1.95 Å for six H atoms) resulting in a lower binding energy. According to Heinola et al [88], the binding energies of the first two H atoms were found to be identical because H couples to the surrounding W. In addition to the binding energy of H atoms, Johnson and Carter determined the energy barrier to release one H atom from a vacancy trap as 1.79 eV [64].
The binding energies obtained correspond to specific H configurations. Liu et al [87] gave a complete picture of the H atoms trapped onto the isosurface of optimal charge density (see figure 6). The isosurface eventually disappears with the formation of the H2 molecule with a H–H distance of 0.78 Å at the centre of the vacancy when 10H atoms are added. Heinola et al [88] found that multiple H atoms stay at opposing distorted O sites, forming triangle, tetrahedron, square pyramid and square bipyramid depending on the number of H atoms trapped by the vacancy. Different H configurations are proposed by Ohsawa et al [90, 91], as shown in figure 7, in which H moves close to TIS from OIS when the H number increases and the H2 molecule forms with 14H atoms at the vacancy.

Figure 6. Atomic configuration and the isosurface of optimal charge for H for different number of H at the monovacancy in W [87]. Reproduced with permission from Liu Y.L. et al 2009 Phys. Rev. B 79 172103. Copyright (2009) by the American Physical Society.
Download figure:
Standard image High-resolution image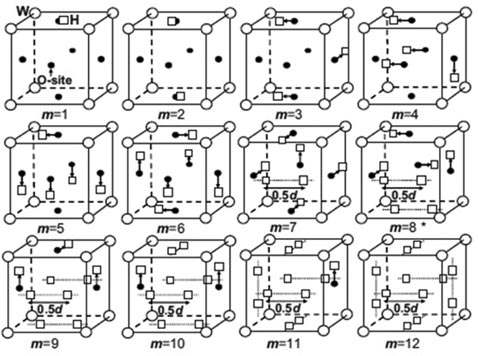
Figure 7. Configurations of multiple H at the monovacancy in W [90]. Reproduced with permission from Ohsawa K. et al 2010 Phys. Rev. B 82 184117. Copyright (2010) by the American Physical Society.
Download figure:
Standard image High-resolution imageThe maximum number of H that can be trapped by the monovacancy is reported to be at least 6 by both Johnson and Carter [64] and Heinola et al [88], 10 by Liu et al [87], 14 by Ohsawa et al [90, 91] and 12 by You et al [92]. Johnson and Carter [64] and Heinola et al [88] found that the lowest energy site for H to sit next to the vacancy is the OIS, thus they only explored the 6 possible OISs up to 6H atoms in W. Note that a monovacancy can trap up to 6H in Fe [91], V [91, 93] and Cr [91], 9H in Mg [94] and 10H in Al [94]. Heinola et al [88] further considered temperature effects, and reported that 5H can be trapped at the monovacancy in W at room temperature.
Sun et al [95], using a newly developed W–H potential [49], found that as many as 20H atoms can be trapped at the monovacancy in W [95]. They also investigated the effect of temperature and the number of H that one vacancy can hold. A statistical average was made to evaluate the number of H atoms trapped at the vacancy at different temperatures. As shown in figure 8, this number decreases when the temperature increases, suggesting that temperature weakens the trapping capacity of vacancy. At 300 K, only ∼6.5H atoms can be trapped by a monovacancy, and it decreases to ∼5H at 900 K. This confirms that the thermodynamic estimation of the number of trapped H atoms at the vacancy in W is basically correct, as it gave 5H at room temperature [88]. Temperature will largely decrease the number of H atoms that a vacancy can hold at 0 K and alter the configurations.
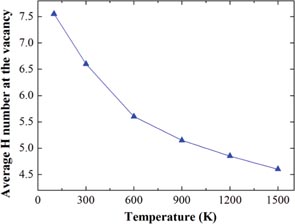
Figure 8. Average number of trapped H atoms at the vacancy as a function of temperature in W from MD simulations [95]. Reprinted from Sun L. et al 2013 J. Nucl. Mater. 434 395 with permission from Elsevier.
Download figure:
Standard image High-resolution image4.3. Vacancy trapping mechanism
All these calculations allowed us to propose a scenario on how H bubbles nucleate from the formation of H2 molecule in W [87, 95, 96]. As shown in figure 9, when H atoms are trapped by the vacancy, they prefer to occupy the internal surface of the vacancy instead of the vacancy centre because of the H–W interaction. With H atoms continuously diffusing in, they will saturate the internal surface of the vacancy to form a 'screening layer', which can effectively screen the interaction between the further trapped H and the surrounding W atoms, making H stay at the vacancy centre. This will lead to the formation of an H2 molecule at the vacancy centre finally, which is considered to be the preliminary stage of H bubble nucleation. This mechanism is generic and can be applied to other vacancy-type defects such as GB [96] and dislocations as well as other metals. The mechanism can explain the experimental observations that H bubbles prefer to form at vacancies or vacancy clusters [13, 97], GBs [9] and dislocations [8] in metals.
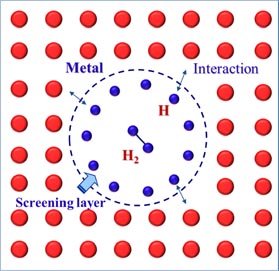
Figure 9. Vacancy trapping mechanism for H bubble formation in metals [95]. Reprinted from Sun L. et al 2013 J. Nucl. Mater. 434 395 with permission from Elsevier.
Download figure:
Standard image High-resolution imageOn the other hand, H can induce vacancy formation in W, which has been investigated via MD simulations [98]. It is shown that vacancies are created due to the presence of H in W and it is closely related to the formation of certain self-interstitial structures. In particular, a hexagonal cluster structure with a 〈1 1 1〉 central axis is observed in W, and it is the primary structure coming along with vacancy formation. In addition to the hexagonal cluster, a linear crowdion structure is also observed to be associated with vacancy formation, which can evolve into a part of the hexagonal cluster afterwards. This contributes to the understanding of the early stage of the H bubble formation in W under H plasma irradiation.
4.4. H concentration at the vacancy
According to the mechanism proposed above, it can be predicted that an H bubble can form with the condition that the H concentration is beyond a certain value. Xiao et al [99] reported that the spontaneous formation of mono-vacancies as well as SIAs will occur with the ratio of number of atoms of H to W exceeding 0.5, which can be considered as a preliminary step for the bubble formation. It is thus necessary to determine concentrations of both H atoms as well as H–vacancy complexes. Ning et al [100] examined the nD–vacancy complex concentration as a function of depth in W employing an improved CD model. The dynamic processes as well as different mechanisms of D accumulated into the vacancy in a long depth scale in W were revealed. The concentration of nD–vacancy complexes increases when the number of D atoms increases in the complexes at the near surface (0–0.2 µm) and micrometre depths (3–20 µm) due to the trapping effect of D by the vacancies created by the ion implantation. The nD–vacancy complex concentration decreases at the sub-surface (0.2–3 µm) because the SIAs created by ion implantation recombine with the vacancies in this region.
Using a combination of first-principles data with thermodynamics models, Sun et al derived the equilibrium concentration of H as a function of pressure and temperature in both W and Mo. It was found that when the pressure reaches a critical value, the trapping probability for H in a vacancy exhibits a sharp increase, suggesting a considerable formation and rapid growth of H–vacancy complexes. Such a critical pressure and the corresponding critical H concentration are defined as the values when the concentration of H at one certain mH–V complex first becomes equal to that of H at the interstitial, which are 24 ppm/7.3 GPa and 410 ppm/4.7 GPa at a temperature of 600 K in W and Mo, respectively. The predicted critical H concentrations in W are basically consistent with the experimental observations [101].
4.5. H bubble formation and blistering
When considerable H accumulates into a vacancy, a bubble will form and blistering will occur. An attempt at estimating blistering using FEM has been made by Enomoto et al [102]. Mechanical parameters such as Young's modulus and the critical yield stress of the layers in the bulk continuum W were used to determine the internal gas pressures of the blisters. A thin circular opening was introduced, allowing the internal hydrostatic pressure to increase until the upper layer was plastically deformed to the shape of an H blister. The final internal hydrostatic pressure needed to reproduce the experimentally observed H blister shape was found to be 1.7 GPa. From the internal gas pressure derived, the number of H atoms contained in the internal volume of the H blister was estimated using the van der Waals equation of state and was found to be 3.0 × 10²¹. Such a value is about six times higher than the amount of D retention determined in the experiments (5 × 10²⁰). The reason for this discrepancy may be that the formed H2 molecules can escape from the blisters.
5. H behaviour at GBs
GBs act as transition regions between two adjacent single crystal lattices. Their chemical composition and crystallographic structure are distinct from those of the bulk, and the properties of materials with GBs can considerably differ from those of a single crystal [103]. A typical example is the segregation of impurities due to the difference in chemical composition between GBs and the surrounding bulk [104]. Experimental data indicate that GBs play a key role in the formation of H bubble [8, 9]. The GBs can be the preferential paths for diffusion of H. For example, it is shown that high-angle random boundaries in Ni can be considered as a disordered phase where the H diffusion is accelerated, whereas the special boundaries constitute a potential zone for H trapping due to the high density of trapping sites as dislocations and vacancies [105].
5.1. Dissolution of H in GBs
The solution energies of a single H atom at the GB at all potential interstitial and substitutional sites and the effects of vacancy have been investigated using the DFT [96]. At pure W Σ5 (3 1 0)/[0 0 1] GB, it was found that a single H prefers to sit at the interstitial site with a solution energy of −0.23 eV, and it binds onto an isosurface of charge density (0.14 e Å−3), as shown in figure 10(a). Compared with the monovacancy in W, the GB provides a smaller isosurface of optimal charge density, indicating that a GB can hold fewer H atoms than the monovacancy in the bulk. In the presence of a vacancy in the GB, H is stable at the vacant space with a solution energy of −0.63 eV, which is much lower than that of the vacancy in the bulk.
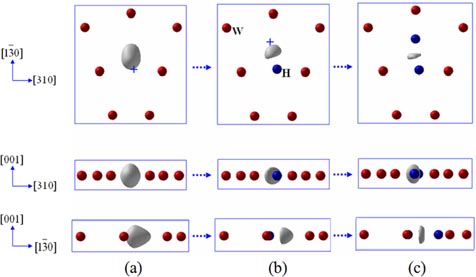
Figure 10. Isosurface of optimal charge density for H in a W GB, (a) without H atom, (b) one H atom and (c) two H atoms [96]. Reproduced with permission from Zhou H.B. et al 2010 Nucl. Fusion. 50 025016. Copyright (2010) IAEA Vienna.
Download figure:
Standard image High-resolution imageFigure 10(b) shows the large isosurface shrinkage that takes place when one H atom is added in the GB (figure 10(a)). Since the optimal density region still exists, one can predict that it is energetically favourable for the GB to trap a second H atom. The largest binding energy for 2H in the GB was found to be −0.13 eV, with an equilibrium distance of 2.15 Å. The second H atom still prefers to bind onto the isosurface of optimal charge density, but the isosurface almost disappears when the second H is introduced (figure 10(c)). Consequently, the GB can trap at the most 2H atoms without the formation of an H2 molecule. These results indicate that the experimentally observed H bubble formation at GBs in W should take place via a vacancy trapping mechanism due to the much lower formation energy of vacancy at the W GB as compared with that in the bulk W [96].
On the other hand, both GBs and dislocation loops are demonstrated to be able to serve as precursors of H bubble formation based on the DFT calculations [106]. The Σ3(1 1 1) title GB can trap as many as six H atoms before significant sliding occurs at low temperature, and that the trapped H atoms can weaken severely the cohesion across the boundary. At room temperature, a dislocation loop in a (1 0 0) plane can trap 4H per (1 × 1) unit, and the detrimental effect of H was found to be strong enough to break the crystal. Indeed, the decohesion effect introduced by the trapped H is associated with the free volume of the defects, i.e. larger free volume induces stronger decohesion. Furthermore, no H2 molecule was found to form in the GB and the dislocation loop before fracture of W bonds starts, consistent with the previous study by Zhou et al [96].
5.2. Diffusion of H in GBs
Zhou et al [96] examined the diffusion paths for H jumping from the W bulk to the W Σ5(3 1 0)/[0 0 1] GB via the interstitial mechanism. It is shown that the diffusion barrier becomes lower when H approaches the GB. The barrier is in the range 0.13–0.16 eV at one-atomic layer separation from the GB centre. This suggests that it is quite difficult for a segregated H to escape out of the GB due to the much lower segregation energy.
Toussaint et al demonstrated the role of the GB on H diffusion in W by employing the MD simulations [107]. The migration paths with minimum activation energy of H in the GB have been determined, and the network of possible migration paths and the corresponding activation energies are shown to be local and asymmetric. The effective diffusion rates for H in the GB was demonstrated to be enhanced as compared with that in the bulk, suggesting that the GB can act as fast transport channels for H.
5.3. Effect of H on the mechanical properties of GBs
The effect of H on the mechanical properties of GBs has also been investigated using the first-principles calculations [108]. The tensile strength of a clean Σ5 GB was calculated to be 36.23 GPa, about 22% lower than that of bulk W along the [3 1 0] direction. When H is introduced, the tensile strength of the GB decreases to 32.85 GPa, about 9% lower than that of the clean GB. The Griffith fracture energy of the H segregated GB is 2.48 J m−2, lower than that of the clean GB by about 4%. The difference of solution energies for the H atom at the GB and the fracture free surface is calculated to be −0.08 eV, indicating that H is a GB embrittler according to the Rice–Wang thermodynamic theory [109]. The Bader charge analysis suggested that the physical origin for H induced strength reduction is related to the charge transfer induced by the presence of H in the GB.
6. H behaviour at W surfaces
As a PFM, W will be exposed to extremely high fluxes of H isotope ions in a fusion environment. This will produce sputtering and displacements of surface W atoms. It is thus necessary to obtain knowledge on the interaction between H and W surfaces. So far, the studies have focused mainly on the (1 0 0), (1 1 0) and (1 1 1) surfaces of W as well as their reconstructions. It should be noted that the actual surface conditions of W will be very complex, and such surface conditions can play a key role in the H behaviour at the W surface. Nevertheless, an investigation of the interaction between H and these W surfaces can provide a fundamental reference for actual situations.
6.1. Surface reconstructions
The geometry, electronic structure and stability of the low-index W surfaces, i.e. (1 0 0), (1 1 0) and (1 1 1), have been investigated both experimentally [110–114] and theoretically [115–123]. Yonehara and Schmidt [110] reported
 reconstruction of the W (1 0 0) surface by cooling below ∼370 K. Debe and King [111] found the cooled W (1 0 0)
surface at a temperature below 190 K displaying 2mm point-group symmetry. Weng et al [113] observed three bands of surface resonances based on an extensive study of electronic states of the W(1 0 0) surface above room temperature. Fasolino et al [117] concluded that the interaction between surface atoms are repulsive based on calculations of the W(1 0 0) surface photon spectrum and the known reconstruction of the W(1 0 0) surface. However, Joubert [119] suggested that the attractive interaction between the surface atoms drives the reconstruction of the W(1 00 ) surface. Furthermore, Chen et al [120] reported that the interaction between the ideal W(1 0 0) surface is weakly attractive by investigating the surface strain of W(1 0 0) surface. Biswas et al [123] reported highly dispersive linear bands corresponding to the surface states and signature of Dirac cones by investigating the surface electronic structure of the W(1 1 0) surface. Holzwarth et al [121] found that the W(1 1 1) surface has stronger relaxations due to its more open atomic structure in comparison with other surfaces.
reconstruction of the W (1 0 0) surface by cooling below ∼370 K. Debe and King [111] found the cooled W (1 0 0)
surface at a temperature below 190 K displaying 2mm point-group symmetry. Weng et al [113] observed three bands of surface resonances based on an extensive study of electronic states of the W(1 0 0) surface above room temperature. Fasolino et al [117] concluded that the interaction between surface atoms are repulsive based on calculations of the W(1 0 0) surface photon spectrum and the known reconstruction of the W(1 0 0) surface. However, Joubert [119] suggested that the attractive interaction between the surface atoms drives the reconstruction of the W(1 00 ) surface. Furthermore, Chen et al [120] reported that the interaction between the ideal W(1 0 0) surface is weakly attractive by investigating the surface strain of W(1 0 0) surface. Biswas et al [123] reported highly dispersive linear bands corresponding to the surface states and signature of Dirac cones by investigating the surface electronic structure of the W(1 1 0) surface. Holzwarth et al [121] found that the W(1 1 1) surface has stronger relaxations due to its more open atomic structure in comparison with other surfaces.
Much effort has been devoted to understanding the interaction between H and the W(1 0 0) and (1 1 0) surfaces. H adsorption on the surface will induce many changes in the structural and electronic properties. Barnes and Willis investigated the vibrational modes of atomic H adsorbed on the W (1 0 0) surface, and found that the reconstruction of the W (1 0 0) surface is induced by adsorption of H [112]. Barker and Estrup reported the transition temperature Tc, at which the surface undergoes reconstruction, was found to increase almost linearly from 250 to 380 K with H coverage θ varying from 0 to 0.3 [114]. The atoms on the reconstructed (1 0 0) surface are laterally displaced along the
![$[1\,\bar{{1}}\,0]$](https://content.cld.iop.org/journals/0029-5515/54/8/086001/revision1/nf485736ieqn004.gif) direction due to the bonding to their nearest neighbours located in the sub-surface layer, thus forming a zigzag pattern advancing perpendicularly to the bonds with the sub-surface atoms. The phase diagram of adsorbed H on the (1 1 0) surface is well known [124–126]. There exist several ordered phases at low temperatures: a 2 × 1 phase at coverage below 0.5 monolayer (ML) and a 2 × 2 structure above 0.5 ML. Disordered structures will be present at temperatures above 200 K and 250 K, respectively. Further adsorption restores the 1 × 1 periodicity of the pure surface when the H coverage reaches saturation. Blanchet et al reported a reduction in the symmetry of the surface for an H coverage greater than 0.5 ML [127]. Kwak et al found the reconstruction of the W (1 1 0) surface induced by H adsorption, which consists of a shift of the W top layer in the
direction due to the bonding to their nearest neighbours located in the sub-surface layer, thus forming a zigzag pattern advancing perpendicularly to the bonds with the sub-surface atoms. The phase diagram of adsorbed H on the (1 1 0) surface is well known [124–126]. There exist several ordered phases at low temperatures: a 2 × 1 phase at coverage below 0.5 monolayer (ML) and a 2 × 2 structure above 0.5 ML. Disordered structures will be present at temperatures above 200 K and 250 K, respectively. Further adsorption restores the 1 × 1 periodicity of the pure surface when the H coverage reaches saturation. Blanchet et al reported a reduction in the symmetry of the surface for an H coverage greater than 0.5 ML [127]. Kwak et al found the reconstruction of the W (1 1 0) surface induced by H adsorption, which consists of a shift of the W top layer in the
![$[1\,\overline {1\,0} ]$](https://content.cld.iop.org/journals/0029-5515/54/8/086001/revision1/nf485736ieqn005.gif) direction [128].
direction [128].
The stability of W surface has been investigated by the MD method. The W (1 1 0) surface has been demonstrated to be the most stable W surface by most of the potentials in comparison with the (1 0 0), (1 1 1) and (2 1 1) surfaces, as listed in table 1 [23, 31, 32, 36, 49], in good agreement with the DFT calculations. However, the value of the surface energies given by these potentials is lower than that obtained from the DFT [23, 31, 32, 36, 49]. For surface reconstructions, employing the MD method, Mrovec et al [36] correctly predict the features of the reconstructed (1 0 0) surface using the BOPs, and Juslin et al [45] reproduce the reconstructed (2 1 1) surface.
6.2. H adsorption on surfaces
6.2.1. The (1 0 0) surface.
On the reconstructed W (1 0 0) surface, a single H atom prefers to be adsorbed at the bridge sites according to the experimental studies [112, 129]. The first-principles calculations based on DFT [64, 130] show that the adsorption site turns out to be two different twofold bridge sites, i.e. a short-bridge (SB) site and a long-bridge (LB) site, where the W–W distances are 2.82 Å and 3.57 Å, respectively (figure 11(a)). The single H atom is predicted to be preferentially adsorbed on the SB site, as shown in table 6. Heinola and Ahlgren [130] calculated the H vibrations on the SB site, and the vibration energies of the different modes agree well with those obtained from the experiments [112]. In addition, Johnson and Carter [64] found that the SB site contracts further when H is adsorbed [64].
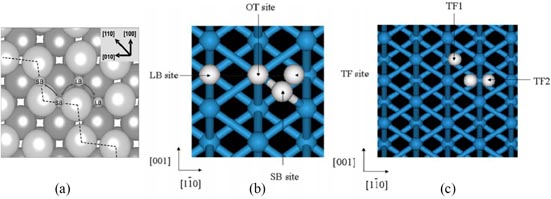
Figure 11. (a) Short-bridge (SB) and long-bridge (LB) adsorption sites (small balls) on the reconstructed W (1 0 0) surface [64]. Reproduced with permission from Johnson D.F. and Carter E.A. 2010 J. Mater. Res. 25 315. Copyright (2010) Cambridge University Press. (b) Typical four adsorption sites on the W (1 1 0) surface: SB site, LB site, threefold (TF) hollow site, and on top (OT) site [138]. (c) H diffusion on the W (1 1 0) from TF to TF1 and TF to TF2 [138]. 11 (b) and 11 (c) reproduced from Nojima A. and Yamashita K. 2007 Surf. Sci. 601 3003 with permission from Elsevier.
Download figure:
Standard image High-resolution imageTable 6. Adsorption energy of H on the W surfaces. The ZPE correction is taken into account for the values in parentheses.
| Experimental | Computation | ||||
|---|---|---|---|---|---|
| Surface | (1 0 0) | (1 1 0) | (1 0 0) | (1 1 0) | |
| SB | LB | TF | |||
 (eV) (eV) |
0.7 [131], | 0.71 [133] | 0.91 [130], | 0.47 [130], | 0.75(0.71) [64] |
| 0.82 [132] | 0.92(0.88) [64] | 0.49(0.46) [64] | |||
6.2.2. The (1 1 0) surface.
By applying the effective-medium theory, Nordlander et al [134] found that the adsorption energy difference between the LB sites and the threefold (TF) hollow sites is very small, and thus that H atoms can delocalize within an hourglass region. Chung et al [135] and Riffe et al [136] found that H atoms occupy the LB sites at low coverage and the TF sites at high coverage, using low energy electron diffraction (LEED) analysis and high-resolution x-ray photoelectron spectroscopy. However, these results were questioned by the LEED I–V experiments and the first-principles calculations performed by Arnold et al [137]. The TF sites are shown to be the most stable adsorption sites of the (1 1 0) surfaces. Nojima and Yamashita [138] further calculated using DFT the atomic adsorption energy to be −2.846 eV at coverage of θ = 0.5 and −2.804 eV at coverage of θ = 1. Thermal desorption spectra exhibit desorption peaks corresponding to activation energies of 1.17 and 1.42 eV per H2 molecule [137]. Johnson and Carter [64] calculated the adsorption energy of H on the (1 1 0) surface to be 0.71 eV with the ZPE corrections (table 6). Moreover, Liu et al [139] investigated H behaviour on the W (1 1 0) surface by electron density analysis. It is found that the most stable adsorption site has a similar electron density (0.10 electron Å−3) as in the case of H binding onto the internal surface of a vacancy (0.11 electron Å−3) [87].
6.3. H diffusion on the surface
6.3.1. The (1 0 0) surface.
Experiments have shown that in the case of H diffusion on the (1 0 0) surface with coverage of θ = 0.08 in the temperature range of 220 K to room temperature, the pre-exponential factor and the diffusion barrier are 1.2 × 10⁻² cm2 s−1 and 0.47 eV, respectively [140]. Three possible pathways were identified by the DFT calculations [64, 130] to describe hops between the sites of SB–SB, LB–LB and SB–LB, as shown in figure 11(a) and table 7. For the SB–SB path, Heinola and Ahlgren [130] found the pre-exponential factor and the diffusion barrier to be 0.5 × 10⁻² cm2 s−1 and 0.45 eV, respectively, by calculating the vibrational frequencies at the saddle point and the ground state and using the concept of classical harmonic TST [141]. With the consideration of the ZPE corrections, Johnson and Carter [64] calculated the diffusion barrier for the SB–SB path, the energy barrier and reverse energy barrier for the SB–LB hopping, which are 0.35 eV, 0.53 eV and 0.11 eV, respectively, while the LB–LB hopping will not occur because the saddle point is second order. Overall, H diffusion on the (1 0 0) surface in the low coverage regime will consist of SB–SB hopping and occasional SB–LB hops. As a result, H is expected to diffuse along zigzag chains at the surface in the [1 1 0] direction, as shown in figure 11(a).
Table 7. Diffusion barriers of H on W surfaces. The ZPE correction is taken into account for the values in parentheses.
| Experimental | Computation | ||||||
|---|---|---|---|---|---|---|---|
| Surface | (1 0 0) | (1 1 0) | (1 0 0) | (1 1 0) | |||
| SB → SB | LB → LB | SB → LB | LB → SB | TF → TF | |||
| Diffusion barrier (eV) | 0.47 [140] | 0.22 [142] | 0.43 [130] | 0.43 [130] | 0.65 [130] | 0.21 [130] | 0.31 [138] |
| 0.40 (0.35) [64] | 0.44 [64] | 0.60 (0.53) [64] | 0.17 (0.11) [64] | ||||
6.3.2. The (1 1 0) surface.
Experimentally, DiFoggio and Gomer [142] investigated H diffusion on the (1 1 0) surface employing the field emission microscope and found two different diffusion mechanisms, i.e. thermal diffusion at high temperatures and tunnelling diffusion at low temperatures. Balden et al [143, 144] using electron energy loss spectroscopy (EELS), put forward quantum delocalization of H atoms. H atoms on metal surfaces can behave like free electrons in metals due to the light mass of H, and H delocalization could be responsible for the peak broadening below 850 cm−1. If the vibration energy of H is as large as the diffusion activation energy, the vibration excited state is sometimes expected to be quantum mechanically delocalized, and the H behaves as Bloch waves [145].
Using the first-principles method based on the DFT, Nojima and Yamashita [138] investigated H diffusion on the W (1 1 0) surface between the TF sites (figure 11(c)). With the NEB method and the ZPE correction, the diffusion barrier is 0.05 eV at coverage of θ = 1 from TF to TF1 via the SB site and 0.31 eV from TF to TF2 via the LB site. However, the barrier is estimated to be about 0.22 eV at θ = 0.9 via the field emission microscope experimentally [143]. The discrepancy may originate from the fact that in the TF to TF1 diffusion process H is quantum mechanically delocalized and cannot be detected by the field emission microscope experiments [138].
6.4. H diffusion from surface to bulk
6.4.1. The (1 0 0) surface.
Heinola and Ahlgren [130] have investigated H diffusion from the (1 0 0) surface to the bulk using first-principles calculations. The probability of an H atom to move from the surface to the bulk is very small since the potential barrier is as high as ∼2 eV. On the other hand, in the absence of deep traps in the bulk, H can diffuse easily from the bulk to the surface with a low diffusion barrier of 0.27 eV, close to that in the bulk (0.21 eV). Johnson and Carter [64] investigated H penetration from the W (1 0 0) surface to the bulk along three paths, i.e. from the SB surface site, the LB surface site and the bridge site on the non-reconstructed surface to the TIS site in the bulk. The diffusion barriers of these paths are shown to be 2.00 eV, 1.29 eV and 2.16 eV, while the reverse diffusion barriers were 0.17 eV, 0.25 eV and 0.12 eV, respectively. This indicates that the path from the LB surface site to the TIS bulk site is the most favourable one for H diffusion from the (1 0 0) surface to the bulk.
6.4.2. The (1 1 0) surface.
H diffusion from the (1 10 ) surface to the bulk was investigated by Johnson and Carter [64], and the diffusion barrier is calculated to be 1.77 eV with the ZPE correction from the TF surface site to a sub-surface site (between the surface layer and the second layer), whereas it is 1.95 eV calculated by Moitra and Solanki [146]. In general, the energy barrier for H diffusion from surfaces (either the (1 0 0) or the (1 1 0) surface) to the bulk is relatively large, whereas the barrier for the reverse migration is very small. However, the probability of H penetrating to the bulk site from the surface becomes considerable at 800 K or higher temperatures.
6.5. Effects of alloying elements at W surfaces
Alloying elements on the W surface can have significant effects on the microstructure and its evolution, which will affect the behaviour of H. The Ni, Co and Fe alloying elements were found to wet all the W surfaces for at least one monolayer, which leads to the formation of thermodynamically stable ultrathin coatings of these elements [147]. The adsorption of Be will form a very thin film of Be–W alloy on the W surface [148, 149]. The interaction between low-energy atomic C with W surface indicates that the unscattered C atoms are absorbed on the top W surface layer in the low-energy range below 10 eV, while the mean range increases with increasing incident energy above 10 eV, which is attributed probably to the channelling effect [150].
The behaviour of H with these 'alloyed' surfaces has been investigated so far only for C on the WC surface, which indicates that the adsorption of H on the WC surface differs from that of H on the W surface. Gaston and Hendy [151] found that both the adsorption energies and partial charges of the adsorbed H atoms depend strongly on the surface termination (C or W) and the nature of the binding site. Marinelli et al [152] reported that H is energetically favourable sitting on the top site at 1.0 ML coverage of H, while the surface occupation of both W and C sites becomes possible beyond this coverage. Furthermore, the barrier to desorption of H can be lowered by adding additional layers of C to the WC surface. Träskelin et al [153] investigated the low-energy bombardment of D impinging onto the WC surfaces by means of MD simulations, and it is shown that prolonged bombardment will lead to the formation of an amorphous WC surface layer, regardless of the initial structure. Furthermore, the sputtering yield of the C-terminated surfaces is larger than that of the W-terminated surfaces [153].
7. He behaviour and synergistic effects with H
H and He atoms coexist in the nuclear fusion reaction, and dual implantations H and He are shown to result in quite different microstructures from single H or He implantations. For example, the trapping states of H can be largely changed by the presence of He atoms, and H retention can be reduced largely due to the presence of He.
7.1. He behaviour in W
7.1.1. Dissolution and diffusion.
The solution energies of He in W have been determined by a number of groups [61, 62, 154–158]. Basically, the solution energy is positive, as listed in table 8, indicating that He is hard to dissolve in W. It is always found that He prefers to sit at a vacancy (SS site) than at one of the two interstitial sites. The TIS is a more energetically favourable site for He than the OIS. With consideration of the ZPE corrections, the solution energy of interstitial He exhibits an increase (0.03 eV for the OIS, and 0.07 eV for the TIS), but the relative stability of He at the TIS and the OIS remains unchanged [61].
Table 8. Solution energy (eV) of He at different sites in W. The ZPE correction is taken into account for the values in parentheses.
| Configurations | TIS | OIS | SS | Vacancy |
|---|---|---|---|---|
| First principles based on DFT | 6.16 [155] | 6.38 [155] | 4.70 [155] | — |
| 6.15 [156] | 6.39 [156] | — | 1.38 [156] | |
| 6.23 [62] | 6.48 [62] | 5.00 [62] | — | |
| 6.07 [157] | 6.34 [157] | 4.52 [157] | — | |
| 6.07 (6.14) [61] | 6.34 (6.37) [61] | — | 1.57 [61] | |
| Empirical potentials | — | 7.83 [154] | — | — |
| 6.15 [158] | 6.38 [158] | 4.73 [158] | — |
Zhou et al [159] employed DFT calculations to determine the dissolution and segregation of He in a Σ5 (3 1 0)/[0 0 1] GB. The solution energy of He in the GB is positive indicating that He is quite hard to dissolve in the GB. He is shown to prefer to segregate in the GB in comparison with the bulk. This is because He prefers to occupy sites with larger openings such as the ones available in a GB due to its closed-shell electronic structure.
Becquart and Domain calculated the diffusion barrier of He between two neighbouring TIS as 0.06 eV from the DFT [155]. The diffusion of He has also been studied by MD simulations with different W–He potentials [158, 160]. The diffusion barriers and pre-exponential factors obtained from these simulations are listed in table 9. The mechanism of He diffusion in W should be different with different temperatures. The TIS–TIS diffusion dominates at low temperatures, while the TIS–OIS–TIS diffusion plays a role as well at high temperatures [158, 160].
Table 9. Diffusion barrier and pre-exponential factors of He in W at different temperature ranges, as fitted by the Arrhenius equation.
| Potential | Becquart and Domain [155] | Wang et al [158] | Shu et al [160] | |||
|---|---|---|---|---|---|---|
| DFT | FS, Derlet et al [32] | FS, Ackland and Thetford [30] | BOP, Li et al [60] | |||
| Temperature range (K) | 0 | 300–650 | 300–650 | 50–300 | 300–1500 | 1500–3000 |
| Diffusion barrier (eV) | 0.06 | 0.11 | 0.13 | 0.021 | 0.057 | 0.157 |
| Pre-factor (m2 s−1) | — | 1.06 × 10⁻⁸ | 5.35 × 10⁻⁸ | 9.50 × 10⁻⁹ | 3.61 × 10⁻⁸ | 8.562 × 10⁻⁸ |
7.1.2. Accumulation.
In contrast with H, He is found to easily form He clusters even without vacancies or other defects available due to a strong attraction between He atoms. According to the first-principles calculations based on the DFT [155], the most stable configuration for two He atoms is along the 〈0 1 2〉 direction separated by a distance of 1.5 Å and a binding energy close to 1 eV. The total binding energies of 3He, 4He and 5He clusters are 2.39 eV, 3.90 eV and 5.54 eV, respectively, which indicates a strong tendency for He atoms to cluster together.
Various simulation methods including DFT, MD, KMC and CD have been further applied to investigate the He accumulation [58, 161–164] and its influence on the microstructure evolution of W [40, 154, 165–167]. The binding energies between He and Hex V(x = 0, 1, ..., 5) complex are shown to be positive based on the DFT calculations, indicating the attractive interactions between them [58]. The He–vacancy clusters are found to be formed near the incident surface, suppressing the He diffusion towards the bulk [161], while the time and depth dependences of He concentration with and without neutron synergic effect have been acquired by the CD model [162–164]. The irradiation of He will lead to the formation of interstitial loops in W, in which two mechanisms of interstitial loop nucleation have been proposed, i.e. the conventional di-interstitial mechanism and the trap mutation mechanism [165]. An object KMC model parametrized on the DFT calculations has been applied to simulate the behaviour of He in W, in which the slowing down of He as well as the associated Frenkel pair production has been observed [40, 166]. The MD simulations of 100 eV He ions impinging on a W(0 0 1) surface at 0 K revealed that the mechanism for growth of small He bubbles is via the formation of (1 1 1) self-interstitial crowdion atoms [154], which relaxes the high internal pressure in the He bubble. Further, it is found that the escape of He atoms from the surface will be hindered by the distance shrink between the top lattice layers and the thermal vibrations of the W atoms on these lattice layers, leading to the accumulation of He in W [167].
7.2. Synergistic behaviours of H and He
7.2.1. Interaction of H and He in intrinsic W.
Both H and He atoms occupy the TIS in W, and the first-principles calculations based on the DFT indicate that there is an attraction between H and He with a binding energy of ∼0.20 eV [61, 62, 69]. As a result a pre-existing He atom can largely reduce the solution energy of H, indicating that the interstitial He can serve as a trapping centre of H. This can well explain the experimental observations that the subsequent H has been observed to accumulate in the He saturated layer in the He pre-implanted W [168, 169], and the presence of He limits D diffusion into W [169, 170].
Zhou et al [61] reported that the variation of the supercell volume induced by He is so small that it can be negligible. However, the atomic distance between He and the nearest neighbour W extends to 1.94 Å as compared with 1.77 Å for the case without He. Furthermore, the distances between neighbouring W atoms increase by ∼0.30 Å due to the presence of He at the TIS centre. These results suggest a volume expansion of the local TIS with He, which leads to a further expansion of the neighbouring TISs. As a result, the charge density in these TIS regions decreases due to the volume expansion. As already described above, the occupation behaviour of H in a metal can be understood in terms of an optimal charge density. The TIS in W is shown to have an electron density of ∼0.27 electron Å−3 [87], which is higher than what H prefers to occupy in W. The lower charge density in the TIS surrounding the He atom due to the volume expansion thus reduces the solution energy of H.
7.2.2. Single H atom at a He–vacancy complex.
The solution energy of H in a monovacancy is −0.31 eV, which is much lower than that of H at TIS in the bulk W. This is because the vacancy provides an isosurface of low charge density (0.11 electron Å−3), and H energetically prefers to stay on such an isosurface [87]. Helium is also shown to prefer to occupy the vacancy. The H solution energy in the vicinity of a He–vacancy (He–V) complex (i.e. substitutional He atom) has been calculated using the DFT. The most stable site for H is found to be at an off-He position (∼1.63 Å from He) close to a TIS [61, 157]. Once more, H prefers to stay onto an isosurface of low charge density (0.16 electron Å−3) surrounding the He–V complex [61]. The H solution energy at these sites is −0.07 eV, which is 1.07 eV lower than that of H at the TIS in the bulk and there is a strong binding between the H and the He–V complex. This implies that the He–V complex can act as a trapping centre which drives the H to segregate close to it.
7.2.3. Multiple H atoms at a He–vacancy complex.
Theoretically, there exist 24 equivalent most stable sites for H atoms surrounding the He–V complex. However, all these sites cannot be occupied simultaneously by H atoms because of the H–H repulsive interaction [59]. Diffusion of H towards a vacancy depends on the H concentration. Qualitatively, under high H concentration, many H atoms can diffuse to the He–vacancy complex at the same time (the simultaneous way), whereas under low H concentration, H atoms will diffuse to the He–vacancy complex sequentially (the sequential way). The trapping energy of additional H atoms segregating to the He–V complex has been calculated for both 'the simultaneous way' [61] and 'the sequential way' [61, 157], as shown in figure 12.

Figure 12. Trapping energy for simultaneous and sequential trapping of H by the He–V complex.
Download figure:
Standard image High-resolution imageIt was found that, on the one hand, for 'the simultaneous way', the trapping energy per H atom increases with the number of H atoms. When the number of H atoms is up to 13, the average H trapping energy is still negative (−0.50 eV), as shown in figure 12. It is lower than that of H at the TIS far away from the He–V complex, which indicates that the number of H atom trapped by the He–V complex should be larger than 13. After carefully checking the atomic configurations of each H addition, Zhou et al found that a He–V complex can only accommodate 12 H atoms. The 13th embedded H atom will fall into one of the TISs out of the vacancy, although the average H trapping energy is still lower than that of H in the TIS. On the other hand, for 'the sequential way', the overall trend of the H trapping energy also increases with the number of H atoms up to 12. Finally, the 13th H atom addition gives rise to a positive trapping energy as compared with that of H at the TIS in the bulk (figure 12). This suggests that the 13th H atom will prefer to occupy the TIS in the bulk rather than the He–V complex. Therefore, the maximal number of H atoms that can be trapped by the He–V complex is 12 via both 'the sequential way' and 'the simultaneous way'.
One He–V complex can thus hold up to 12 H atoms, independent of the trapping sequences [61, 157]. The calculations show furthermore that the shortest distance between H atoms is always much longer than that of the H2 molecule (0.75 Å), which implies that no H2 molecule forms with He at the vacancy centre. Interestingly, the configuration of H–He–V complex [61] indicates that H forms an icosahedron in the (HeV)H12 complex, consisting of 12 isosceles and 8 equilateral triangles, as shown in figure 13. The distance between H and its 1NN is ∼1.74 Å, and that between H and its 2NN is ∼2.00 Å.
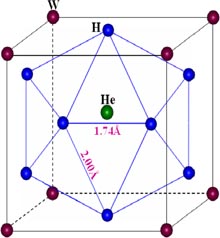
Figure 13. Atomic configuration of the (HeV)H12 complex in W [61]. Reproduced with permission from Zhou H.B. et al 2010 Nucl. Fusion 50 115010. Copyright (2010) IAEA Vienna.
Download figure:
Standard image High-resolution image7.2.4. HenHnVn complexes.
The first-principles calculations based on DFT performed by Lee et al [62] show that He tends to move into the vacancy while H tends to stay around the TIS when a vacancy appears close to an He–H interstitial pair. Complexes consisting of He, H and vacancies were built, and the number of vacancies was set to be less than the total number of He and H atoms to create competition between the two species. The He and H atoms were initially positioned at the face centres, so that they have an equal probability to move towards the vacancies. The calculations show that all four He atoms move towards the vacancy cluster to form a four-atom cluster of a square shape, while all four H atoms stay away from the vacancies and relax slightly towards the W atoms (figure 14). Zhou et al also demonstrated that it is energetically more favourable that He atoms occupy the vacancy rather than H atoms, and the He atom is more likely to stay at the vacancy centre [61].
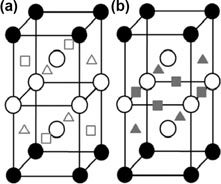
Figure 14. Atomic configurations of He4H4V6 before and after relaxation [62]. Reprinted from Lee S.C. et al 2009 J. Nucl. Mater. 383 244 with permission from Elsevier.
Download figure:
Standard image High-resolution image7.2.5. Suppression of H bubble formation by He.
As stated previously, a vacancy can serve as a trapping centre for H, because it provides an optimal charge density for H and it is energetically favourable for a monovacancy to trap as many as 10 H until an H2 molecule is formed at the centre of the vacancy [87]. Zhou et al reported further that no H2 molecule forms inside a He–V complex, although the number of H atoms trapped by the complex is more than that by an He-free vacancy [61]. This suggests that He can prevent the formation of H2 molecule in W because the required space and optimal charge density for the formation of H2 molecule no longer exists due to the He presence.
It is proposed that the influence of He on H bubble formation can be divided into two aspects [61]. On the one hand, He prefers to bind with defects such as vacancies to hinder the formation of H2 molecule, and thus effectively suppresses H bubble formation. On the other hand, a strong attraction between H and He-defect clusters drives H to segregate towards He, leading to the accumulation of H close to He at the near-surface region. This can block the permeation of H into deeper bulk and thus suppress H bubble formation. It is believed that two different mechanisms both contribute to suppress H bubble formation in W, which can explain the experimentally observed suppression of D bubbles by He [170–172]. Based on the transmission electron microscopy observations, Ueda et al proposed that He bubbles formed near the surface reduce the diffusivity of H by reducing the diffusion channel of H into deeper bulk W [170].
It can be deduced that the same effects should be obtained by replacing He by other inert gas elements such as neon (Ne) and argon (Ar), which have been shown to be able to suppress H bubble formation according to the DFT calculations.
8. Behaviour of impurity and alloying elements and their effects on H
Impurity and alloying elements can have significant effects on the microstructure and its evolution in W. Indeed they can impact the diffusivity of moving species such as point defects, H or He atoms, as well as inhibit clustering or at least prevent the occurrence and consequently the outburst of large bubbles by providing many traps, leading to the formation of many small clusters rather than few large ones [173]. In what follows we briefly summarize the knowledge gathered so far on the influence of impurity and alloying elements with a special emphasis on C and oxygen (O) because of their well-known prominent role in bcc metals such as Fe.
8.1. C
According to the first-principles calculations based on the DFT, a single C atom is shown to be energetically favourable sitting at the OIS in W with a solution energy of 0.78 eV [174]. It is found that the hybridization between C 2p and 1NN W 5d is more pronounced for C at the OIS based on the LDOS calculations, and a broad energy interval is obviously present near the Fermi level. Also, such a strong hybridized interaction is favourable to increase the formation of the directional C–W covalent-like bond, leading to the stability of C at the OIS. The OIS → TIS → OIS path has been demonstrated to be the optimal diffusion path for interstitial C. The energy barrier is calculated to be 1.46 eV, which suggests that it is very difficult for an interstitial C atom to migrate at a lower temperature.
Two C atoms tend to pair up at two neighbouring OISs along the 〈2 1 0〉 direction with an equilibrium distance of ∼3.57 Å [174]. Such a favourable pairing configuration appears to be mediated by a bended 'bridging' W atom. The binding energy of the C–C pair is ∼0.50 eV, which indicates an attractive interaction between C atoms in W. This should be responsible for the higher local C concentration and further the formation of carbide in W.
When a monovacancy is present, the most stable site for C was found to be at a position of ∼1.31 Å off the vacancy centre close to an OIS, with a solution energy of −1.15 eV, much lower than that in the intrinsic W [175, 176]. Such a strong trapping of C by the vacancy implies that vacancies serve as trapping centres and drive large amount of C atoms to segregate, forming CnV complexes. Liu et al investigated the trapping of multiple C atoms in the vacancy and found that the trapping energy per C atom has a tendency to increase with the number of C atoms, except for a minor decrease when the second C atom is introduced.
Zhou et al investigated the energetics and site preference of C atoms in a W Σ5(3 1 0)/[0 0 1] GB [177]. The C atom prefers to sit in an interstitial site rather than a substitutional site in the GB. The segregation energy difference of C between the GB and the free surface is positive (+0.19 eV per C atom), indicating that C enhances the GB cohesion according to the Rice–Wang thermodynamic theory [109].
C impurity plays an important role in the blister formation. Experimentally, Ueda et al [178] indicate that a very small amount of C (∼0.3% or more) significantly enhances blister formation in W, which has been explained by the formation of a carbide layer that prevents H from leaving W. The first-principles calculations indicate that at a short distance the interaction between C and H is repulsive [179, 180], and it becomes negligible (∼0.05 eV) at a distance of ∼2.5 Å [179]. Such repulsion increases the diffusion coefficient of C in pure W [180], and enhances the migration barrier of H to travel through the WC layers, which prevents the implanted H from escaping the W matrix, contributing to the blister formation in W [181]. Lasa et al calculated the D retention in W carbides (WC and W2C) using the empirical potentials [182], from which the D retention is shown to increase linearly with the C content, and the penetration of D is prevented by amorphization. In the W carbides, the D atoms are trapped around the C atoms, which leads to the formation of D2 as well as different hydrocarbons. This is contrary to pure W, in which atomic D is present mainly.
Kong et al further investigated multiple H accumulation around C in pure W and their influence on the stability of nearby lattice sites [183]. It is found that the vacancy formation energies at the nearest-neighbour sites of C and H are lower than that in the intrinsic bulk, which implies that the introduction of C and H at the interstitial site decreases the stability of their nearby lattice sites. This may be attributed to the lattice distortion and charge redistribution induced by the interstitial atoms.
The multiple H atoms are shown to accumulate around the C atom to form C–Hn complexes [183]. When the C atom is trapped at the vacancy, no more than 9 H atoms can stay within the vacancy and the H atoms cannot bind together to form an H2 molecule [179, 183]. The strong trapping of a single H by the vacancy remains almost unchanged in the vicinity of a C atom. However, when the number of H atoms increases, the C effect is enhanced due to the C–H interaction. The trapping energy of H increases with the presence of C, making the Hn–V complex less stable than in the C-free case. It will be thus easier for H to escape from the vacancy in the presence of a C atom.
8.2. O
A single O atom prefers to sit at the TIS with a solution energy of −1.75 eV according to the first-principles calculations [184]. Two O atoms tend to be paired up at the two neighbouring TISs along the 〈3 1 0〉 direction with a large binding energy of 1.60 eV. The equilibrium distance of the O–O pair is ∼2.28 Å, much longer than the bond length in the O2 molecule, indicating that O atoms cannot bind together to form O2 molecules directly in intrinsic W. However, because of this large binding energy, two O atoms can easily attract each other, leading to the formation of O clusters at a high concentration of O impurities. The preferable diffusion path for O is to migrate directly between two nearest neighbouring TISs with a diffusion barrier of 0.17 eV. The diffusion coefficient of O in W is calculated to be 1.50 × 10⁻⁹ m2 s−1 at a temperature of 500 K.
When a monovacancy is present, O will sit 1.28 Å off the vacancy centre close to an OIS with a strong trapping energy of −3.05 eV [183, 184]. This indicates a strong interaction between O and vacancy in W. The extra trapping energy of O with the vacancy suggests that the vacancy formation energy will be lower when more O atoms are trapped in the vacancy. Multi O atoms are repulsive at the vacancy, making the vacancy hold three O atoms without the formation of O2 or O3 molecule. It is suggested according to the bond lengths and the LDOS results that O and neighbouring W atoms form stronger W–O bonds similar to the WO3 compounds.
Recent experimental studies reported that O can act as a trapping site, making large number of H isotope ions to aggregate and further form H blisters [185, 186]. DFT calculations predict a positive binding energy for the O–H pair (∼0.31 eV), suggesting that O has a potential to trap H atoms [183]. The maximum number of accumulated H atoms is 5 surrounding an O atom. The binding energy of H atoms to an O–vacancy complex decreases when the number of H atoms increases, as shown in figure 15. The H binding energy to the O–vacancy complex decreases slightly in comparison with the O-free case. Furthermore, the vacancy formation energies of some lattice sites near the O–Hn complex are found to be negative, suggesting that a vacancy can form spontaneously. Similar case occurs for the C as well (figure 15). The formation energy of the complex is so low that abundant O–Hn/C–Hn complexes may exist and widely distribute in W, and the accumulation of these abundant complexes can serve as the origins for the formation of H bubbles.
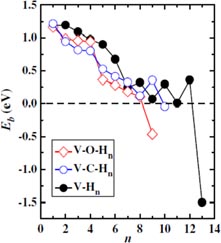
Figure 15. Binding energy of the nth interstitial H atom with stable V–O(C)–Hn−1 complexes. The zero point is the energy of H in the tetrahedral site far away from the V–Hn−1 or V–O(C)–Hn−1 complex [183]. Reprinted from Kong X.S. et al 2013 J. Nucl. Mater. 433 357
Download figure:
Standard image High-resolution image8.3. Other solutes
W is not really a practical engineering material because its machining and welding are generally difficult. To make up for this problem, one well-known solution is the addition of alloying element rhenium (Re), which increases recrystallization temperature and ductility of W. Furthermore, under fusion irradiation conditions, transmutation of W atoms by 14 MeV neutron irradiation can lead to the formation of Re. In certain applications and after long service, as many as 25% of the W atoms can be transmuted [187]. For this reason, the W–Re alloys have been extensively investigated experimentally. Other elements such as Ta and V are, for the same purpose, also under investigation. Muzyk et al [188] indicate that the addition of V and Ta can result in an improved ductility of W and that V atoms are expected to trap SIA defects in dilute W–V alloys. The DFT calculations performed by Li et al [189] indicate that the 1/2 〈1 1 1〉 dislocation slip plane is altered by Re alloying.
Concerning the interactions of solute atoms and H, Golubeva et al [190] investigated D retention in Re-doped W by means of the thermodesorption technique. In the range 1–10% Re, the Re concentration in the W–Re alloy will not influence noticeably the D retention. The DFT calculations by Heinola et al [88] indicate that there is a negligible interaction between Re/Os and H when the solute atoms are in substitutional sites, but such an interaction becomes much more significant when the solute atoms are in interstitial sites. Figure 16 compares the interaction of a series of transition elements (substitution in W) with H, He and a single vacancy predicted by the first principles based on the DFT. For the elements of the first two rows, the interaction of solute with He atoms is always stronger than those with the vacancy or an H atom. The binding energy of the solutes investigated is always positive and thus will favour H solution but by no more than 0.5 eV except for Fe, Ni and Cr which limits the range of temperatures at which they can be effective traps.
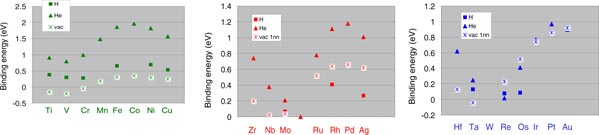
Figure 16. Binding energies of substitutional solute atoms with one vacancy, one He atom or one H atom in W (without taking into account the ZPE).
Download figure:
Standard image High-resolution image
9. Summary and outlook
In summary, modelling and simulation play a critical role in understanding dissolution, diffusion and accumulation behaviours of hydrogen (H) in tungsten (W), which contributes to the final control of retention of H isotopes and blistering in future fusion systems. Much effort has been devoted to the modelling and simulation of H behaviour in W at different scales, which is systematically reviewed in this paper. The review covers the H behaviour in intrinsic W and the effects of defects including vacancies, grain boundaries (GBs), surfaces, as well as helium (He) and other impurities and alloying elements in W. Furthermore, the available empirical interatomic W–W and W–H potentials for the molecular dynamic (MD) simulation are summarized.
For the future, the primary goal of the modelling and simulation is to further understand the different behaviours of H in W, triggering at the control of the retention of H isotopes and blistering in W and the design of plasma-irradiation-resistant materials. So far, most of the data have been obtained using first-principles calculations based on the density functional theory, which have limitations and in particular the effect of temperature on the data needs to be carefully assessed. With the reliable interatomic potentials, the MD and kinetic Monte Carlo (KMC) methods should be employed to further accurately probe the temperature effects and the migration paths of H in W with defects such as vacancies, GBs and dislocations. The effects of impurities and alloying elements as well as their interaction with H need to be further investigated. A combination of modelling and dedicated experiments where each kind of defects can be introduced under controlled conditions is needed to allow a step-by-step validation of results of modelling and simulation. Further, large-scale simulations of H behaviour in W such as rate theory and finite element method using small-scale results as inputs should be further performed, which can provide closer connections to the actual fusion environments. It can be expected that the modelling and simulation in different scales will continually contribute to the final application of W as a plasma-facing material in future fusion systems.
Acknowledgments
This research is supported by the National Magnetic Confinement Fusion Program with Grant No 2013GB109002, the National Natural Science Foundation of China with Grant Nos 51371019, 51171008 and 51325103 (Distinguished Young Scholars), and by CEA with Contract No V3542.001. Great contributions from Wen-Li Yan, Lu Sun, Yi Yu, Jinlong Wang, Peng Tao, Liang-Liang Niu, Xinxin Wang, Yu-Hao Li and Christophe Domain are highly appreciated.