Abstract
We report 121/123Sb nuclear quadrupole resonance (NQR) and 51V nuclear magnetic resonance (NMR) measurements on kagome metal CsV3Sb5 with Tc = 2.5 K. Both 51V NMR spectra and 121/123Sb NQR spectra split after a charge density wave (CDW) transition, which demonstrates a commensurate CDW state. The coexistence of the high temperature phase and the CDW phase between 91 K and 94 K manifests that it is a first-order phase transition. At low temperature, electric-field-gradient fluctuations diminish and magnetic fluctuations become dominant. Superconductivity emerges in the charge order state. Knight shift decreases and 1/T1T shows a Hebel–Slichter coherence peak just below Tc, indicating that CsV3Sb5 is an s-wave superconductor.
Export citation and abstract BibTeX RIS
Kagome lattice has been intensely studied in condensed matter physics due to its geometric frustration and nontrivial band topology. Depending on the electron filling, on-site repulsion U, and nearest-neighbor Coulomb interaction V, several possible states have been proposed as the ground state,[1,2] such as quantum spin liquid,[3–5] charge density wave (CDW),[6] and superconductivity.[7,8]
Recently, superconductivity was discovered in the kagome metal AV3Sb5 (A = K, Rb, Cs), which undergoes a CDW transition before the superconducting transition.[9–12] Scanning tunneling microscopy (STM) observed a chiral charge order that breaks time-reversal symmetry[13] and leads to the anomalous Hall effect in the absence of magnetic local moments.[14–17] This chiral charge order is energetically preferred and tends to yield orbital current.[18] Inelastic x-ray scattering and Raman scattering exclude strong electron-phonon coupling driven CDW,[19] while optical spectroscopy supports that CDW is driven by nesting of Fermi surfaces.[20] High pressure can suppress CDW transition and reveal a superconducting dome in the P–T phase diagram.[21,22] Further increasing pressure, a new superconducting phase emerges.[23–25]
STM studies observed possible Majorana modes[26] and pair density wave,[27] which points to unconventional superconductivity in the surface state. Signatures of spin-triplet pairing and an edge supercurrent have been observed in Nd/K1 – x V3Sb5 devices.[28] Whether the exotic surface superconducting state is intrinsic or comes from heterostructures, such as Bi2Te3/NbSe2,[29] needs to clarify the gap symmetry in the bulk state first. Thermal conductivity measurements on CsV3Sb5 down to 0.15 K showed a finite residual linear term, which suggests a nodal gap and points to unconventional superconductivity.[25] On the other hand, magnetic penetration depth of CsV3Sb5 measured by tunneling diode oscillator showed a clear exponential behavior at low temperatures, which provides an evidence for nodeless superconductivity but does not rule out fully gapped unconventional superconductivity.[30]
In this work, we report nuclear magnetic resonance (NMR) and nuclear quadrupole resonance (NQR) investigations on CsV3Sb5. The splitting of 51V spectra and 121/123Sb spectra demonstrates that a commensurate CDW order forms at 94 K with a first-order transition and coexists with superconductivity. In the superconducting state, Knight shift decreases and a Hebel–Slichter coherence peak appears in the spin-lattice relaxation rate just below Tc, which provides evidences for s-wave superconductivity in CsV3Sb5.
Single crystals of CsV3Sb5 were synthesized using the self-flux method, as reported in Ref. [21]. Superconductivity with Tc = 2.5 K is confirmed by dc magnetization measured using a superconducting quantum interference device (SQUID). The NMR and NQR measurements were performed using a phase coherent spectrometer. The spectra were obtained by frequency step and sum method which sums the Fourier transformed spectra at a series of frequencies.[31] The spin-lattice relaxation time T1 was measured using a single saturation pulse.
Figure 1(a) shows the spectra of 51V with μ0 H (= 8.65 T) ∥ c. 51V with I = 7/2 has seven NMR peaks at 150 K. Below TCDW = 94 K, the magnitude of original peaks decreases gradually and two sets of new peaks arise, which indicates that the CDW transition is commensurate and there are two different sites of V atoms in the CDW state. The coexistence of two phases between 91 K and 94 K demonstrates that the CDW transition is of first-order due to a simultaneous superlattice transition.[10] The quadrupole resonance frequencies of both 51V sites increase with decreasing temperature below 94 K, as shown in Fig. 1(b).

Fig. 1. (a) 51V-NMR spectra with H ∥ c. (b) Temperature dependence of quadrupole resonance frequency νQ. (c) Temperature dependence of the Knight shift of 51V. (d) Temperature dependence of the 51(1/T1 T) measured at the central peaks. The vertical dashed line indicates the position of TCDW.
Download figure:
Standard imageKnight shift 51 K is deduced from the central peaks and is summarized in Fig. 1(c). Below TCDW, two splitting peaks give two Knight shift values, one of which jumps up and the other jumps down. The corresponding 51(1/T1 T) jumps to the opposite side or does not change at TCDW, as shown in Fig. 1(d). We also measured the Knight shift and 51(1/T1 T) with H ⊥ c, as shown in Fig. S1 of the Supplemental Material, which also shows an opposite trend at TCDW. Therefore, the splitting of 51 K is not caused by different hyperfine couplings, but by the change of the orbital part of Knight shift.
51(1/T1 T) in a Fermi liquid state is proportional to the square of the density of states (DOS) around the Fermi energy N(EF). Just below TCDW, 51(1/T1 T) of the right peak jumps to 64% of the value above TCDW, indicative of the decrease of N(EF) by 20%. 51(1/T1 T) of the left peak is smooth at TCDW. The difference of 51(1/T1 T) between two V sites manifests the modulation of DOS at different V positions, which is consistent with 2 × 2 CDW charge order.[27] 51V has a very small quadrupole moment, Q = –5.2 × 10⁻³⁰ m2. Therefore, the relaxation is governed by magnetic fluctuations and can reflect the change in the DOS, even though the electric field gradient (EFG) fluctuates strongly near TCDW. On the contrary, 121Sb and 123Sb have larger quadrupole moments, 121 Q = –54.3 × 10⁻³⁰ m2 and 123 Q = –69.2 × 10⁻³⁰ m2, respectively, which can be used to detect the EFG fluctuations and perform NQR measurement.
In order to study the superconducting state, we must perform measurement at a magnetic field lower than the upper critical field, μ0 Hc2 ∼ 0.5 T.[25] Usually NQR experiments do not need applying magnetic field, however Knight shift cannot be measured at zero field. Here we measure 121 K by applying a perturbing field of 64 Oe that is larger than the lower critical field, μ0 Hc1 ∼ 2 mT.[32] With a perturbing field, the nuclear spin Hamiltonian is the sum of electric quadrupole interactions and the nuclear Zeeman energy[33]

Here νzz
is the quadrupole resonance frequency along the principal axis (c-axis),  , with eq = Vzz
; η is an asymmetry parameter of the EFG,
, with eq = Vzz
; η is an asymmetry parameter of the EFG,  . Vxx
, Vyy
, Vzz
are the EFGs along the x, y, z directions, respectively; θ and ϕ are the polar and azimuthal angles between the direction of the applied field and the principal axis of EFG. When η is small enough to be negligible, the resonance frequency at a small perturbation field along c-axis is
. Vxx
, Vyy
, Vzz
are the EFGs along the x, y, z directions, respectively; θ and ϕ are the polar and azimuthal angles between the direction of the applied field and the principal axis of EFG. When η is small enough to be negligible, the resonance frequency at a small perturbation field along c-axis is

The perturbing field eliminates the degeneration of ± Iz
and results in a spectra splitting. When H0 ⊥ c, the peak of  is split by the perturbing field, while other peaks are not affected.[34]

where m is a half-integer.
There are two isotopes of Sb nuclei which are 121Sb with I = 5/2 and 123Sb with I = 7/2. The NQR spectra should contain two 121Sb peaks and three 123Sb peaks. Figures 2(a) and 2(b) show the spectra with a perturbing field of 64 Oe along c-axis, which eliminates the degeneration of ± Iz and results in a small spectral splitting. There are two different crystallographic sites for Sb in CsV3Sb5 with the atomic ratio of Sb1 : Sb2 = 1 : 4.[9] The relative intensities of different sites are proportional to their atomic ratio,[35] so Sb2 site has larger spectral intensity than Sb1 site. The spectra in Figs. 2(a) and 2(b) are of Sb2 atoms which encapsulate the kagome layer with a graphite-like network. Sb1 atoms located in the kagome plane with V atoms have weak spectra, which are presented in the Supplemental Material. The νzz and η deduced from the spectra above and below TCDW are summarized in Table 1, where η is zero above TCDW reflecting isotropy in the xy-plane. Below TCDW, η of Sb2 changes to finite values, which indicate the breaking of in-plane symmetry and two unequal sites of Sb2 with the ratio of 1 : 2. The slightly decreasing νzz implies that the main change is not the EFG strength, but the EFG direction at Sb2 sites. On the other hand, the EFG at Sb1 site changes frequency obviously without asymmetry.
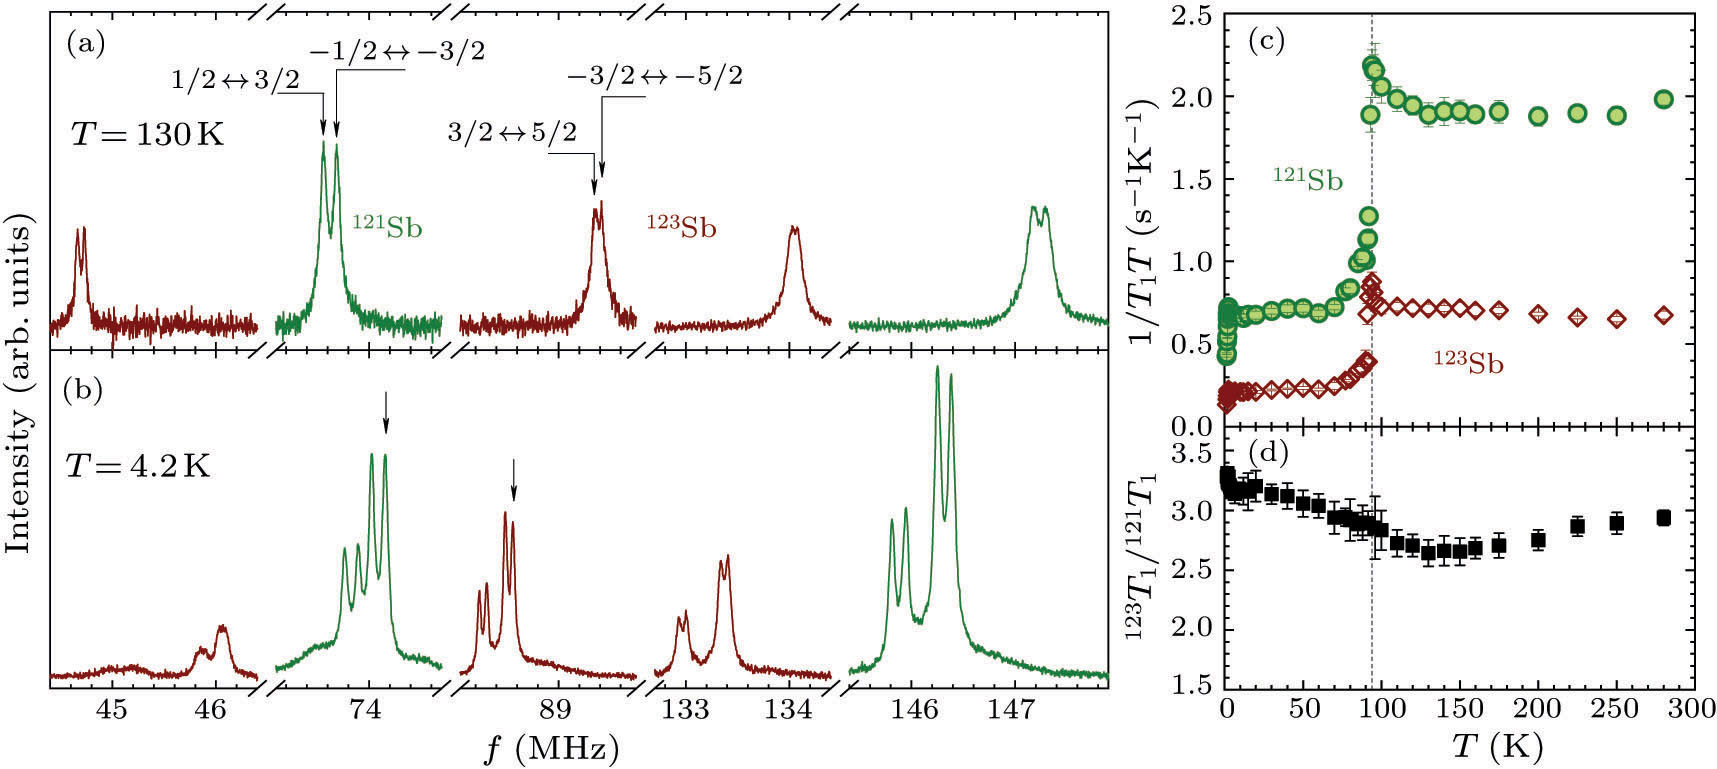
Fig. 2.
121/123Sb NQR spectra with a perturbing field of 64 Oe along c-axis at (a) 130 K and (b) 4.2 K, respectively. The arrows mark the peaks where T1 was measured. (c) Temperature dependence of the 1/T1
T measured with 121Sb at –1/2 ↔ –3/2 peak and 123Sb at –3/2 ↔ –5/2 peak, respectively. (d) Temperature dependence of the 121/123Sb isotopic ratio  . The vertical dashed line indicates the position of TCDW.
Download figure:
Standard imageTable 1. The quadrupole resonance frequencies and asymmetry parameters.
| T | Site | η | 121 νzz | 123 νzz |
|---|---|---|---|---|
| 130 K | Sb1 | 0 | 71.41 | 43.35 |
| Sb2 | 0 | 73.62 | 44.69 | |
| 4.2 K | Sb1 | 0 | 78.19 | 47.16 |
| Sb2' | 0.097 | 73.08 | 44.36 | |
| Sb2'' | 0.099 | 73.31 | 44.50 |
T1 was measured at  peak of 121Sb2 and
  peak of 123Sb2, respectively. After spectra splitting below TCDW, T1 was measured at the right-side peaks, marked by arrows in Fig. 2(b). The degeneration is eliminated by the magnetic field, so the NQR recovery curves are no longer applicable. The recovery curve used for
  transition of 121Sb is

The recovery curve used for  transition of 123Sb is

We use the same fitting function for both above and below TCDW, since the η is small. Figure 2(c) shows the temperature dependence of 1/T1 T of 121/123Sb. Upon cooling, 121/123(1/T1 T) starts to increase a little and drops sharply below TCDW for both 121Sb and 123Sb. With further cooling, 121/123(1/T1 T) becomes constant from 70 K to Tc, which obeys the Korringa relation and suggests that the system is in a Fermi liquid state. 51(1/T1 T) of 51V has shown that DOS loss is only 20%. Here the large drop implies that the EFG fluctuations play an important role above TCDW and are suppressed after CDW transition. Moreover, 121/123(1/T1 T) decreases continuously without sudden jump like 51(1/T1 T). This implies that the superlattice transition has strong effect on V atoms that locate in the kagome plane, but has very small effect on Sb2 atoms that locate outside the kagome plane. Therefore, 121/123(1/T1 T) of Sb2 shows a second-order CDW transition behavior.
In general, a spin-lattice relaxation occurs through magnetic and/or electric-quadrupole channels. The magnetic relaxation is related to the gyromagnetic ratio γn and gives 123 T1/121 T1 = 3.4, while the electric-quadrupole relaxation is related to the quadruple moment Q and gives 123 T1/121 T1 = 1.5.[36] Above TCDW, 123 T1/121 T1 is smaller than 3, as shown in Fig. 2(d), which indicates that both magnetic fluctuations and EFG fluctuations are important. Below TCDW, the ratio increases with decreasing temperature and approaches to 3.4 at zero temperature limit, which indicates that the magnetic process becomes dominant at low temperature. Therefore, the effect of EFG fluctuations in the superconducting state is negligible.
The Knight shift of Sb can be deduced from the spectra splitting. The field calibrated by a Gauss meter has an uncertainty, so the absolute Knight shift value is not reliable in an ultra-low field. The relative Knight shift Δ K = K – K0, where K0 is the average value above Tc, has very weak dependence on field. The Δ K values for all directions are almost unchanged above Tc and decrease below Tc, as shown in Fig. 3, which is consistent with spin-singlet pairing. The perturbing field is much larger than the lower critical field, so the drop below Tc is not from Meissner effect but intrinsic spin susceptibility.

Fig. 3. Temperature dependence of Δ K of 121Sb with (a) H ∥ a, (b) H ∥ a*, and (c) H ∥ c, where a and a* are orthogonal directions in the basal plane. The vertical dashed lines indicate the position of Tc.
Download figure:
Standard imageIn an ultra-low field, 121 K measurements have large errors which preclude further analysis. On the other hand, spin-lattice relaxation rate can be measured accurately. 121/123(1/T1 T) shows a clear Hebel–Slichter coherence peak just below Tc and then rapidly decreases at low temperatures as shown in Fig. 4. It evidences that the superconducting gap is of s-wave symmetry. As for d- or p-wave, gap sign changes over the Fermi surface, which suppresses a coherence peak. In iron-based superconductors, s±-wave also changes gap sign between different Fermi surfaces and suppresses a coherence peak.[37] So far, the Hebel–Slichter coherence peak has only been observed in s-wave superconductors. Here the coherence peak is small, which may be due to residual EFG fluctuations[38] and/or a strong electron-phonon coupling.[39] In other s-wave superconductors, the coherence peaks of Sb are also very small, such as in YbSb2 [40] and BaTi2Sb2O.[36] A recent STM study has suggested the absence of sign-change in the superconducting order parameter.[41] Magnetic penetration depth measured by tunneling diode oscillator has shown a nodeless behavior.[30] These results are both consistent with the s-wave gap symmetry. There is also experimentally observed residual density of states in the superconducting state,[25,41] which may be due to the competition between superconductivity and CDW. Another s-wave superconductor Ta4Pd3Te16 also has a CDW order coexisting with superconductivity and shows residual density of states in the superconducting state.[42]

Fig. 4. Temperature dependence of 121(1/T1 T) (left axis) and 123(1/T1 T) (right axis). A Hebel–Slichter coherence peak appears just below Tc. The curve and line are guides to the eyes.
Download figure:
Standard image121(1/T1 T) is measured at the split peak due to the CDW transition and shows sudden changes at both TCDW and Tc, which indicates that the superconductivity coexists with the CDW state. The coexistence of superconductivity and topological charge order may stimulate exotic excitations in the surface state,[26,43] which needs further investigations. Recently another superconducting phase at high pressure was found in CsV3Sb5.[24,25] Whether the high-pressure superconducting phase is the same as that at ambient pressure needs further studies.
In conclusion, we have performed 51V NMR and 121/123Sb NQR studies on CsV3Sb5. The variation of the NMR and NQR spectra below TCDW can be understood by the occurrence of a first-order commensurate CDW transition. EFG fluctuations are suppressed and magnetic fluctuations become dominant at low temperature. In the superconducting state, 121 K decreases and 121/123(1/T1 T) shows a coherence peak just below Tc, which is the hallmark of the s-wave full gap superconductivity. The superconductivity coexists with the CDW state, which may lead to exotic surface state.
We thank S. K. Su, X. B. Zhou and B. Su for assistance in some of the measurements.
Footnotes
Supported by the National Key Research and Development Program of China (Grant Nos. 2017YFA0302901, 2018YFE0202600, and 2016YFA0300504), the National Natural Science Foundation of China (Grant Nos. 11921004, 11634015, 11822412, and 11774423), the Beijing Natural Science Foundation (Grant No. Z200005), and the Strategic Priority Research Program and Key Research Program of Frontier Sciences of the Chinese Academy of Sciences (Grant No. XDB33010100).