Abstract
We have experimentally demonstrated that the effective thermal expansion coefficient of a fused silica fibre can be nulled by placing the fibre under a particular level of stress. Our technique involves heating the fibre and measuring how the fibre length changes with temperature as the stress on the fibre was systematically varied. This nulling of the effective thermal expansion coefficient should allow for the complete elimination of thermoelastic noise and is essential for allowing second generation gravitational wave detectors to reach their target sensitivity. To our knowledge this is the first time that the cancelation of the thermal expansion coefficient with stress has been experimentally observed.
Export citation and abstract BibTeX RIS

Content from this work may be used under the terms of the Creative Commons Attribution 3.0 licence. Any further distribution of this work must maintain attribution to the author(s) and the title of the work, journal citation and DOI.
1. Introduction
Interferometric gravitational wave detectors operate by sensing the displacements of suspended mirrors. Variations in the position can be induced by gravitational radiation from astrophysical sources at the typical level of 10−18 m or less [1]. The use of ultra-low mechanical loss materials in the final suspension stages of these detectors is necessary in order to lower the thermal displacement noise of the mirrors to a level below 10−19 m Hz−1/2 at 10 Hz [2]. Fused silica is the low loss material of choice as it can be pulled into strong fibres [3] and welded to form a quasi-monolithic suspension [2, 4–6]. It is important to measure the losses of fused silica suspensions in order to accurately predict their thermal noise performance. The dominant loss mechanisms of fused silica fibres are thermoelastic loss [7, 8], surface loss [9, 10], weld loss [11, 12] and bulk loss [10, and references therein]. Thermoelastic loss would be a dominant noise source except for the fact that fused silica has a Young's modulus which increases with temperature [13–17] and this should allow the effective thermal expansion coefficient of fused silica to be nulled by using fibres that are appropriately stressed [8].
The required suspension thermal noise for Advanced LIGO can only be achieved if the effective thermal expansion coefficient can be significantly reduced by applying the correct amount of static stress to the suspension fibres. This nulls the thermoelastic loss of each suspension fibre under tension, which is given by [8]

where Yo is the Young's modulus of the fibre material at room temperature, T is the temperature, ρ is the density, C is the specific heat capacity, α is the thermal expansion coefficient of the fibre material, σo is the static stress on each fibre, ω is angular frequency, τ is the characteristic time for heat to flow across the sample and β = 1/Yo(dY/dT). It is convenient to consider (α − σoβ/Yo) as the effective thermal expansion coefficient.
This paper describes an experiment which was conceived by Faller and had a prototype demonstrated by Reid. The setup was then revised and modified by Bell and Hammond for the results presented in this paper, which shows for the first time that the thermal expansion coefficient of a fused silica fibre can be canceled by the application of a suitable static stress. It is instructive to derive an equation that shows how the extension of silica under static stress varies with temperature. Consider a fibre under some static stress σo. For a temperature change, ΔT, the strain due to the coefficient of linear thermal expansion, α and the change of the Young's modulus with temperature is

The term σo/(Yo + dY/dT) allows for a temperature dependent Young's modulus. Rearranging and keeping only first order terms gives

where the term σo/Yo is the static stretch of the fibre. The effective thermal expansion coefficient αeff is thus [8]

For low values of stress, αeff ≈ α and thus the fibre expands when the temperature increases. However, the magnitude of the Young's modulus for fused silica increases with temperature [13–17] making β positive, and thus for high stress values the β term causes contraction of the fibre as the temperature increases. By choosing a suitable static stress the effective thermal expansion coefficient can thus be nulled to eliminate the thermoelastic loss given by equation (1).
2. Experimental setup and procedure
A measurement of the thermal expansion coefficient of a loaded fibre was performed by placing a 440 μm diameter Suprasil 2A [18] fused silica fibre, which was fabricated using a CO2 laser based pulling machine [19], inside a copper tube which was wrapped in heating wire as shown in figure 1. The setup allows the fibre to be heated and cooled repeatedly from around 290 to 310 K. A capacitive sensor connected to a lock-in amplifier was used to monitor the fibre extension.
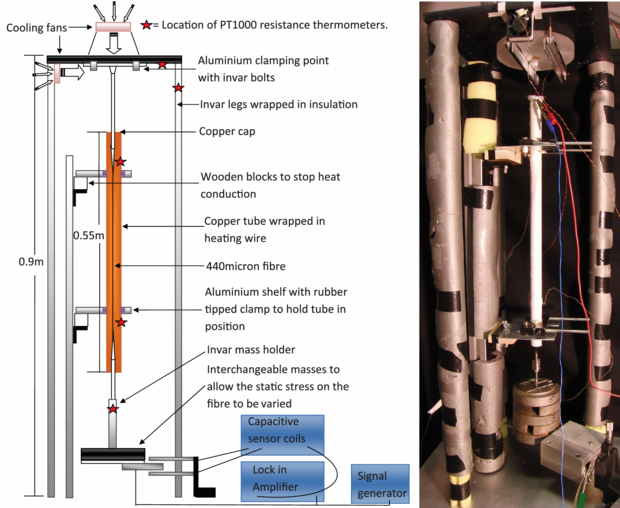
Figure 1. Left: schematic of the apparatus used to measure the thermal expansion coefficient. Right: photograph of the experimental setup.
Download figure:
Standard image High-resolution image2.1. Capacitive sensor
The circuit diagram for the capacitive sensor is shown in figure 2. The net current flowing to the sensor plates (through capacitances C1 and C2) is compared by coupling through a counter-wound transformer with a common centre ground. This was a convenient method to ensure the output voltage was zero when the currents I1 and I2 are identical. As the fibre expands/contracts vertically the value of C2 increases/decreases while C1 decreases/increases. This in turn changes the value of Vout which was amplified and demodulated with the lock-in amplifier. A time constant of 10 s was selected on the lock-in amplifier to remove torsional motion as well as the pendulum/tilt motion of the fibre. The sensor was designed such that the plate carrying the 5 Vrms reference signal had a large overlap compared to the sensing plates. This was shown to reduce the sensitivity due to translation/torsional motion from the mass holder and also tilt of the roof, which couples to horizontal motion, during heating/cooling cycles. The resulting dc voltage, which was proportional to the fibre extension, was then read into a PC through a Labjack U12 Data Acquisition card. The capacitive sensor was calibrated before each data taking run. This was done by mounting the capacitive sensor onto a translation stage with vertical adjustment. The sensor was then moved by an increment of 0.05 mm and once the signal had reached a fixed value (roughly after 20 s) the sensor was then moved another 0.05 mm. The voltage changes from the sensor were monitored for a series of calibration steps and a straight line fit through the data gave a sensitivity of 40.6 V mm−1 as shown in figure 3.
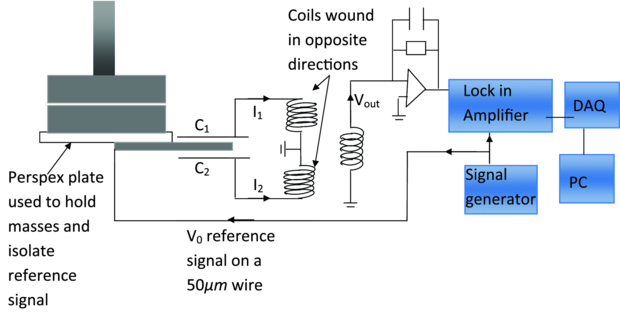
Figure 2. A schematic of the circuit diagram for the capacitive sensor.
Download figure:
Standard image High-resolution image
Figure 3. Top: a calibration plot showing the linear output of the capacitive sensor with a sensitivity of 40.6 V mm−1.
Download figure:
Standard image High-resolution image2.2. Thermal effects
The temperature was measured at various locations as detailed in figure 1 with PT1000 resistance thermometers attached to a Keithley Instruments 2000 multimeter and integrated scan card. This was carried out in order to systematically investigate spurious expansion effects in the components of the experimental setup. In addition the following precautions were taken to minimise systematic heating effects.
- The top stock of the silica fibre was made longer to ensure the roof clamp was sufficiently far away from the heating tube.
- A copper cap was placed on top of the heating tube to reduce the convection current out of the pipe and make the temperature inside the pipe more uniform.
- Two cooling fans were positioned to keep the temperature of the roof at room temperature.
- The silica fibre was welded to a silica mass (shown in figure 4) to reduce expansion which would occur if a metal clamping mechanism had been used to grip the fibre.
- The legs of the support structure and heating tube were decoupled by holding the heating tube on an independent stand.
- The legs of the support structure and lower mass holder were made from invar and the legs were wrapped in insulation to minimise expansions due to heating.
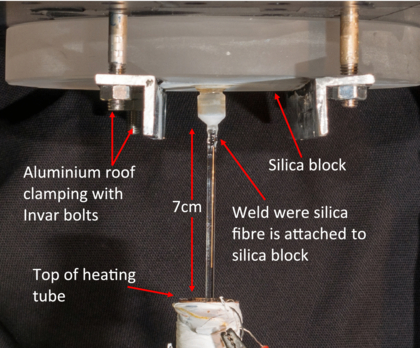
Figure 4. The silica block held in place using two aluminium brackets and held to the roof with invar bolts to which the silica fibre is welded. These precautions are used to reduce systematic thermal effects.
Download figure:
Standard image High-resolution image2.2.1. Temperature monitoring of the experimental apparatus
To remove the thermal influence due to the legs and roof, the fibre was removed from the heating tube and clamped to the roof. A series of heating and cooling cycles were initiated while the fibre motion was monitored using the capacitive sensor, the temperatures of the roof and legs were monitored using PT1000 thermometers. This arrangement is shown in figure 5. During this test no correlation was found between the motion of the fibre and the leg temperature, suggesting that the legs were not expanding or contracting enough to produce a false fibre expansion or contraction measurement. The lower clamp mass holder was also not expanding or contracting enough with temperature to be of concern. The fibre was then returned to the inside of the heating tube. The roof was heated using a heat gun while the temperature of the roof and length change of the system were monitored. This data showed that the fibre position changed by 1.3 × 10⁻⁷ m °C −1 and allows for a correlation coefficient to be measured (RRoof). The measurement of RRoof allows us to remove the signal changes due to the roof deformations by monitoring its temperature as described in section 2.3 which otherwise would wrongly be interpreted as fibre expansions.
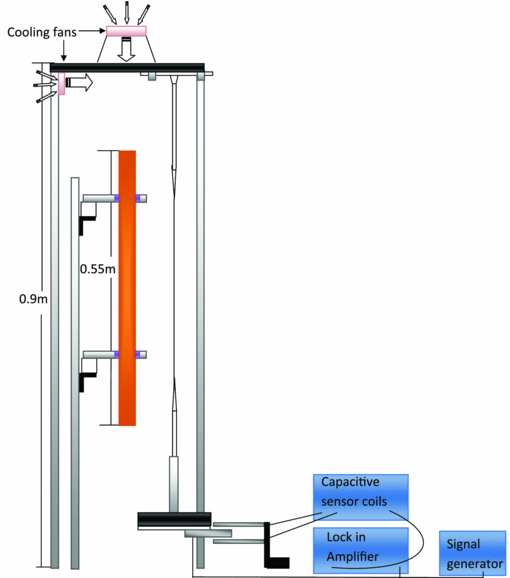
Figure 5. The arrangement of the calibration setup used to determine that changes of the leg temperature had little effect on the measured result and that roof temperature played a more substantial role.
Download figure:
Standard image High-resolution image2.2.2. Poisson's ratio variations
The Poisson ratio, ν, is another mechanism which could effect the stress on the fibre and thus the measurement of the effective thermal expansion coefficient. As the length of the fibre L is extended under stress, the radius of the fibre r will decrease by Δr such that

where ΔL is the extension of the silica fibre when it is stressed. This will make the stress on the fibre larger than initially predicted if the initial fibre radius r is used to calculate the stress on the fibre. Two factors were considered; the static change in the stress and the effect of the Poisson ratio varying with temperature. For the static effect, the Poisson ratio for fused silica is 0.17 at 20 °C [20]. A Poisson's ratio of 0.17 only changes the stress in the fibre by ∼0.04% for a fibre with a radius of 220 μm suspending 1 kg. For the temperature dependent effect, the Poisson ratio has been shown to increase with temperature [20] and at 40 °C the value is ∼0.172 [20] (i.e. 1 × 10⁻⁴ °C−1). This in turn will increase the stress on the fibre by another 0.005%. By performing an analysis of a suspended fibre with an ANSYS finite element model it has been shown that systematic effects due to the Poisson ratio and its change with temperature are insignificant compared with the long term erroneous temperature variations.
2.2.3. Long term drifts
The full data set for this experiment comprises of 5–7 individual measurements of fibre extension as a function of the suspended load. This is combined with systematic tests of the heating tube and fibre temperature profile and results in a measurement campaign of ≃ 4 weeks. It is therefore clear that erroneous temperature effects due to environmental factors can be significant. Drifts over the course of a day, or an individual measurement at a given load, in both the temperature and fibre extension data are removed by subtracting a second order polynomial fit so all the data was centred around zero. These drifts are likely due to the tilt of the table on which the apparatus was sitting as the room temperature varies throughout the course of the day.
Longer term variations, due for example to changes in the ambient temperature of the lab over several weeks, are removed by calibrating the capacitive sensor at the start and end of each measurement. However, it is possible that such temperature variations can affect the measured temperature profile along the fibre. As this profile can only be measured once, due to the fact that the temperature sensors are glued onto the fibre, it is believed that these are the main sources of error in the experiment at a level of roughly ±0.7 °C.
2.3. Measurements
For each individual data point the fibre was heated and cooled consecutively 12 times with a heating and cooling cycle time of 10 000 s. The displacement of the fibre was measured with the capacitive sensor every 2 s along with the temperature of the roof and legs as shown in figure 6. To calculate the effective thermal expansion coefficient of the fibre a regression fit for equation (6), below, was used

where ΔL was the output of the capacitive sensor, RRoofΔTRoof was the length change due to any roof tilt and αeffLΔTTop Tube was the corrected value.
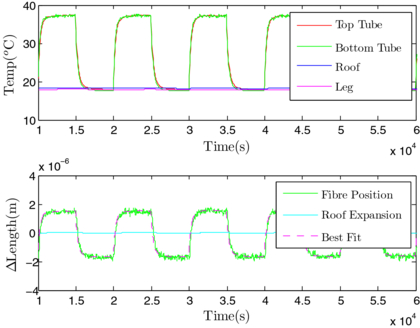
Figure 6. Data taken when a mass of 0.2 kg was hanging from the fibre. Top plot: the heating tube temperature, roof temperature and the temperature of the support structure legs. Bottom plot: a plot of the fibre position after the long term drifts and calibrated expansions for the roof have been removed. The best fit line shows the fit for the calculated effective thermal expansion coefficient assuming the top tube temperature is the temperature of the fibre.
Download figure:
Standard image High-resolution imageThe mass supported by the fibre was increased up to a maximum of 7.1 kg by adding masses onto the lower clamp. Figures 6 and 7 show the data gathered when the experiment was run with masses of 0.2 kg and 7.1 kg respectively. In comparing top and bottom graphs on these figures it was clear that there was a phase change between the heating and extension of the fibre, signifying that the fibre extends for the low mass case and contracts for the high mass case.

Figure 7. Data taken when a mass of 7.1 kg was hanging from the fibre showing that the fibre reduces in length as it was heated. This gives a negative effective thermal expansion coefficient.
Download figure:
Standard image High-resolution imageIt was not sufficient to assume that the temperature change of the fibre from room temperature was uniform along its length and that it experiences the same temperature changes as the copper tube. After the measurements had been taken PT1000 resistance thermometers were glued onto the fibre every 2–3 cm to monitor the change in temperature along the fibre. This temperature change profile is shown in figure 8. The fibre radius was measured using the apparatus described by Cumming et al [21]. The values obtained from these measurements are shown in figure 8. There was an error of ±5 × 10⁻⁶ m on the measurement of the fibre radius while the temperature change plotted has an error of ±0.7 °C and this is the dominant error when taking measurements. This temperature change profile was then used to recalculate the effective thermal expansion coefficients as discussed in the following section.
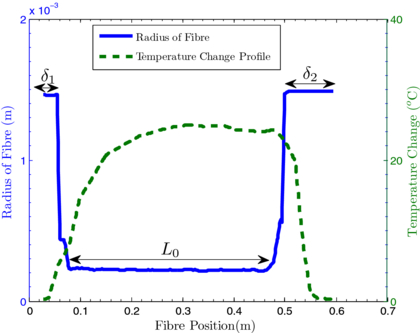
Figure 8. Temperature change profile plotted on top of the fibre dimension profile showing the temperature profile was not uniform along the fibre.
Download figure:
Standard image High-resolution image3. Results
Figure 8 shows clearly that the size of the temperature change experienced by the fibre varies along the length of the fibre. An effective expansion coefficient αeff was then calculated using this temperature change profile rather than assuming the entire length of the fibre experienced the same magnitude of temperature change. To do this the temperature change profile of each fibre was interpolated and divided into 1 mm sections.
It is further important to note that to accurately analyse the fibre the effective expansion coefficient also depends on the geometry of the fibre. As there is a low value of stress in the 1.5 mm radius regions, δ1 and δ2 (see figure 8), the expansion from the β term in these parts of the fibre was negligible. The expansion of all the 1 mm sections in these sections of the fibre can be attributed to be purely from the α coefficient. In the thin 400 μm section Lo, the stress σo on the silica plays a more dominant role and so the expansion coefficient of all the 1 mm sections in this part can be attributed to  . During this analysis the assumption was made that the value of α was constant with temperature and uniform across the entire fibre despite the different 1 mm sections experiencing different magnitudes of temperature changes. This assumption will not effect the integrity of the results calculated in this paper as previous results show [22, 23] that when the thermal expansion coefficient of fused silica was measured over a temperature range of 0 to 40 °C. The largest variation in α that was determined is ∼0.1 × 10⁻⁷ K−1 and so will contribute to an error of <3% to the value of α calculated in this paper.
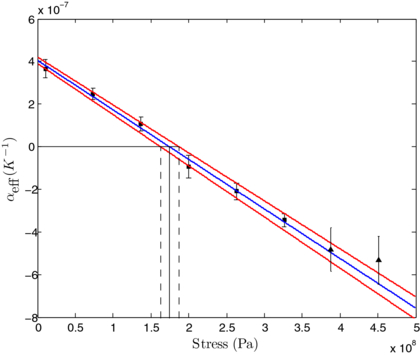
A plot of the effective expansion coefficient against the average static stress in the 440 μm diameter section of the fibre is shown in figure 9. The plot shows the average data from an experiment repeated three times, each done with a nominally identical fibre. Fibre 1 included data up to a maximum hung mass of 7.1 kg (450 MPa) while for fibres 2 and 3, the maximum mass on the fibre was only increased up to 5.2 kg (327 MPa). Thus the two data points shown by the triangle markers with the highest stress values only include measurements made on fibre 1. A linear best fit line to this data is shown by the blue line. This fit does not take into account the two highest stress values which were taken from fibre 1 only. The gradient of this fit was used to calculate a value of β to be (1.67 ± 0.05) × 10−4 K−1 which is higher than previous measured 'bulk' and fibre values of silica [13–17] where the elastic thermal coefficient was found to be ∼1.52 × 10⁻⁴ K−1. The y-axis intercept of the graph determines the value of α to be (4.1 ± 0.2) × 10−7 K−1, where the error for these fitted values is shown by the red line in figure 9. The value of α determined here is lower than the 'bulk' thermal expansion coefficient of ∼5.9 × 10⁻⁷ K−1 which has been directly measured [24, 25], although it does agree with samples of silica which have been aged at high temperatures of 1400 °C [23] for which values of α as low as 3 × 10⁻⁷ K−1 were found. It also confirms previously published indirectly measured values of α for heat treated silica fibres [12, 15]. The fused silica fibre measured in this paper had undergone heat treatment during the manufacture process [19] and so it is expected to show a thermal expansion coefficient similar to samples aged or fabricated at higher temperatures.
Figure 9. Plot showing how the average effective thermal expansion coefficient of three identical silica fibre's varies with the static stress on the fibre. The squares show the average value of three fibres and the triangles show data that was gathered using fibre 1 only.
Download figure:
Standard image High-resolution image
The black line indicates the stress at which αeff becomes zero, this happens at 175 ± 13 MPa where the error on this value is shown by the dashed black lines. The data shown in figure 9 does show some scatter about the linear trend. We performed a P-value statistical test to validate the hypothesis that the data does indeed follow a straight line fit. The P-value statistic from the measured data and the theoretical straight line fit from figure 9 produced a value of 0.95 which is well above the 0.05 (95% confidence value) used to reject a hypothesis [26]. Thus we are confident that the scatter in the data is consistent with a linear trend.
4. Conclusions
We have measured for the first time the variation of the effective thermal expansion coefficient αeff with stress in a silica fibre. These results provide a direct measurement of the thermal expansion coefficient and thermal elastic coefficients of a Suprasil 2A fused silica fibre. We determined the value of α to be (4.1 ± 0.2) × 10−7 K−1 and β to be (1.67 ± 0.05) × 10−4 K−1. These values show that it possible to null the effective thermal expansion of a fused silica fibre with a stress of 175 ± 13 MPa. In Advanced LIGO there are four fibres used to support the 40 kg silica test mass [6]. The majority of the bending energy contained in the fused silica suspensions is stored in an 800 μm diameter region of the fibres which corresponds to a stress of 195 MPa.
This stress value is just outside the one sigma error bars produced with this experiment for which thermoelastic loss can be nulled. For the values of α and β presented in this paper, we calculate that the total suspension thermal noise will be ≈9.7 × 10⁻²⁰ m Hz−1/2, which is lower than the baseline sensitivity of 10−19 m Hz−1/2 at 10 Hz. For a comparison if this cancelation effect did not happen and the αeff was not nulled the total suspension thermal noise would be ≈1.8 × 10⁻¹⁹ m Hz−1/2. This data directly confirms that thermoelastic cancelation of the effective thermal expansions coefficient is essential for allowing second generation gravitational wave detectors to reach their target sensitivity.
Acknowledgments
The authors would like to thank Colin Craig and Stephen Craig for their work towards the construction of the laser fibre pulling machine. We would like to thank Professor Kenneth Strain for his assistance taking photographs and Steve Penn for his useful discussions. We would also like to thank our colleagues in the GEO600 project, the Scottish Universities Physics Alliance (SUPA), and the LIGO Scientific Collaboration for their interest in this work. We also wish to thank the ILIAS Strega project and Leverhulme Trust for support. Author IW Martin is supported by a Royal Society Research Fellowship. We are grateful for the financial support provided by the STFC and the University of Glasgow in the UK and the NSF in the USA.