
Abstract
A number of recent magnetization and transport studies show a rich spectrum of magnetic anisotropies of prototypical diluted magnetic semiconductors (Ga,Mn)As. However, few investigations thus far have provided the quantitative determination of [0 1 0] uniaxial magnetic anisotropy (UMA) and the domain-wall pinning field, which are commonly overshadowed by strong cubic anisotropy and huge Zeeman energy. Here we combine results of planar Hall effect experiments carried out at low magnetic fields, and calculations via a modifying Stoner–Wohlfarth model to address this issue. The results of this work indicate that the strength of [0 1 0] UMA constant can be unexpectedly large, even twice as large as that of [ ] UMA, which differs drastically from the often accepted view that the former is only one tenth of the latter in magnitude. We also obtain quantitative values of the pinning field, which is not constant as expected. Instead, it decreases with increasing temperature or external field. These findings would fulfil the complete picture on magnetic anisotropies of (Ga,Mn)As.
Export citation and abstract BibTeX RIS
1. Introduction
The diluted magnetic semiconductor (Ga,Mn)As provides a fertile ground for the exploration on magnetic anisotropy, making it a promising material for an electrically programmable memory and logic device [1–6]. The coexistence of cubic magnetic anisotropy and uniaxial magnetic anisotropy (UMA) in several in-plane directions has long been extensively investigated [7–14]. The cubic anisotropy (KC) along [0 1 0] (and [1 0 0]) and the uniaxial anisotropy constant of ![$[\overline {1\,} 1\,0]$](https://content.cld.iop.org/journals/0268-1242/29/3/035004/revision1/sst490141ieqn2.gif) (KU) have been clearly determined by magnetization measurements, magnetoresistance, and giant planar Hall effect (PHE) [7, 8, 15, 16]. Corresponding values are directly given by the Stoner–Wohlfarth model due to their relatively large magnitude. Despite the rich anisotropic transport behavior discovered a decade ago [7], the UMA constant in [0 1 0] (KU1) with a small magnitude is hard to determine in a quantitative way because it is overshadowed by its strong cubic anisotropy counterpart and the large Zeeman energy in a strong external field [14]. Such a large external field (comparing to the coercivity of (Ga,Mn)As) is necessary for the establishment of KC and KU [11, 12]. Fortunately, using the anisotropy fingerprint technique, based on summarizing the results of transport measurements into color-coded resistance polar plots, the typically relative magnitude of the anisotropy constants in (Ga,Mn)As is proposed to be of the order: KC : KU : KU1 ≈ 100 : 10 : 1 [11]. However, one has to measure a bundle of transport curves for the painting of anisotropy fingerprints. Now the research interest is whether an elegant and easy approach could quantitatively detect KU1, providing a unique opportunity to fulfil the complete picture on magnetic anisotropies of (Ga,Mn)As in a simple way.
(KU) have been clearly determined by magnetization measurements, magnetoresistance, and giant planar Hall effect (PHE) [7, 8, 15, 16]. Corresponding values are directly given by the Stoner–Wohlfarth model due to their relatively large magnitude. Despite the rich anisotropic transport behavior discovered a decade ago [7], the UMA constant in [0 1 0] (KU1) with a small magnitude is hard to determine in a quantitative way because it is overshadowed by its strong cubic anisotropy counterpart and the large Zeeman energy in a strong external field [14]. Such a large external field (comparing to the coercivity of (Ga,Mn)As) is necessary for the establishment of KC and KU [11, 12]. Fortunately, using the anisotropy fingerprint technique, based on summarizing the results of transport measurements into color-coded resistance polar plots, the typically relative magnitude of the anisotropy constants in (Ga,Mn)As is proposed to be of the order: KC : KU : KU1 ≈ 100 : 10 : 1 [11]. However, one has to measure a bundle of transport curves for the painting of anisotropy fingerprints. Now the research interest is whether an elegant and easy approach could quantitatively detect KU1, providing a unique opportunity to fulfil the complete picture on magnetic anisotropies of (Ga,Mn)As in a simple way.
A combination of PHE measurements and calculations based on the Stoner–Wohlfarth model has been extensively employed to get KC and KU under a large external field [10–15]. When the external field decreases to the same magnitude of the coercivity, the masking effect of the Zeeman energy on the magnetic anisotropy reduces, making the asymmetric reversal of in-plane magnetization arising from the [0 1 0] uniaxial anisotropy detectable [14]. Since the coherent rotation model is not applicable for the reversal process of magnetization at low fields, a domain-wall pinning energy (Epin), associated with the energy barrier which the domain wall encounters as it propagates, is introduced to judge when the rotations occur. In this scenario, it is naturally expected that KU1 and the pinning energy Epin could be determined by the simulation. The experiments and calculations described below demonstrate that [0 1 0] uniaxial anisotropy field (HU1 = 2KU1/M) is unexpectedly large compared to its ![$[\overline 1 \,\,1\;0]$](https://content.cld.iop.org/journals/0268-1242/29/3/035004/revision1/sst490141ieqn3.gif) counterpart (HU = 2KU/M) and the pinning field (Hpin) is sensitive to the external field.
counterpart (HU = 2KU/M) and the pinning field (Hpin) is sensitive to the external field.
2. Experiment and calculation
The (Ga,Mn)As films were grown using low temperature molecular beam epitaxy (LT-MBE) using a modified Veeco Gen II system. Prior to (Ga,Mn)As growth, a 300 nm GaAs buffer was grown at semi-insulating (0 0 1) GaAs with the substrate temperature of TS = 600 °C. Subsequently, a 35 nm thick (Ga0.94Mn0.06)As layer was deposited at low temperature of TS = 220 °C with the growth rate of 0.03 nm s−1. The crystal quality of the epilayer was monitored in situ via reflection high energy electron diffraction with a streaky pattern. Details on the (Ga,Mn)As growth and microstructure characterizations can be found in [17] and [18]. For PHE measurements, 30 µm wide Hall bars along [1 1 0] direction were used, which were fabricated from Ga0.94Mn0.06As films with the coercivity of 20 Oe and Curie temperature (TC) up to ∼135 K measured by a superconducting quantum interference device magnetometer. The PHE is able to provide extensive information on in-plane magnetic anisotropy of ferromagnetic materials. When applying a dc-current (I) along [1 1 0] crystal orientation of (Ga,Mn)As, also the direction of (Ga,Mn)As Hall channel, the transverse Hall voltage Vxy can be acquired, as illustrated in figure 1(a). The planar Hall resistance (RPHR) can be expressed as follows [14]:
where k is a constant concerning the anisotropic resistance and t is the film thickness. The RPHR is relevant to φ, which is the angle between the direction of current and magnetization (M). When the direction of M is oriented to [0 1 0] or ![$[0\;\overline 1 \;0]$](https://content.cld.iop.org/journals/0268-1242/29/3/035004/revision1/sst490141ieqn4.gif) , the value of RPHR reaches its maximum, while minimum is gained once oriented to [1 0 0] or
, the value of RPHR reaches its maximum, while minimum is gained once oriented to [1 0 0] or ![$[\overline 1 \;0\;0]$](https://content.cld.iop.org/journals/0268-1242/29/3/035004/revision1/sst490141ieqn5.gif) according to equation (1). In this case, by comparing the relative magnitude of RPHR we can determine the orientation of M. To quantitatively account for the values of KC, KU and KU1, a modified Stoner–Wohlfarth formulation, by introducing the term of
according to equation (1). In this case, by comparing the relative magnitude of RPHR we can determine the orientation of M. To quantitatively account for the values of KC, KU and KU1, a modified Stoner–Wohlfarth formulation, by introducing the term of ![$[\overline 1 \;1\;0]$](https://content.cld.iop.org/journals/0268-1242/29/3/035004/revision1/sst490141ieqn6.gif) and [0 1 0] uniaxial anisotropies, was used to fit the experimental results of the angle-scan curves. With respect to the Stoner–Wohlfarth model of coherent rotation of magnetization, the total energy density E of an arbitrary single domain M orientation can be explained by the equation [11, 15]
and [0 1 0] uniaxial anisotropies, was used to fit the experimental results of the angle-scan curves. With respect to the Stoner–Wohlfarth model of coherent rotation of magnetization, the total energy density E of an arbitrary single domain M orientation can be explained by the equation [11, 15]
where θ represents the angle between the magnetic field H and ![$[\overline 1 \;1\;0]$](https://content.cld.iop.org/journals/0268-1242/29/3/035004/revision1/sst490141ieqn7.gif) direction. For the fixed field H in angle-scan mode, each θ uniquely corresponds to a value of φ that satisfies the local minimum of E/M. The positions of minima in equation (2) determine the direction of magnetization at the field H. Subsequently, we can feed the value of φ of equation (2) into equation (1) to acquire the best fitting results to the angle-scan curves.
direction. For the fixed field H in angle-scan mode, each θ uniquely corresponds to a value of φ that satisfies the local minimum of E/M. The positions of minima in equation (2) determine the direction of magnetization at the field H. Subsequently, we can feed the value of φ of equation (2) into equation (1) to acquire the best fitting results to the angle-scan curves.
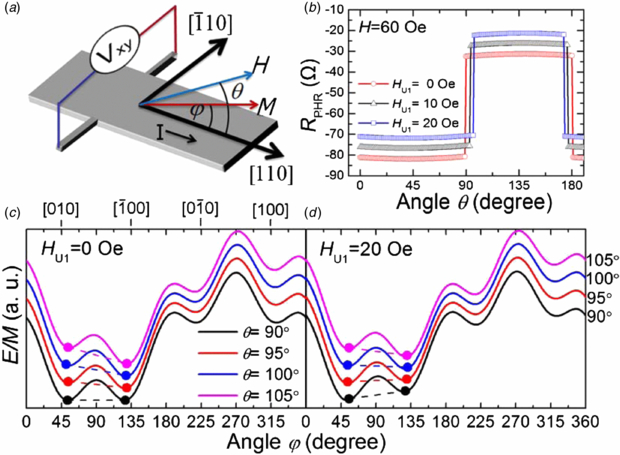
Figure 1. (a) Measurement configuration of the Hall device. The direction of Hall device, θ and φ are defined in the sketch. (b) Theortical calculated curves on the effect of the [0 1 0] uniaxial anisotropy on the magnetization reversal process. (c) and (d) Comparison of the energy density profiles at four representative field directions (θ = 90°, 95°, 100°, and 105°) for [0 1 0] uniaxial anisotropy field HU1 = 0 and 20 Oe, where the energy difference between the neighboring minima at φ = 45° and 135° is highlighted by dashed lines.
Download figure:
Standard image High-resolution image3. Results and discussion
We have theoretically investigated the effect of [0 1 0] uniaxial anisotropy field (HU1 = 0, 10, and 20 Oe) on the rotation asymmetry under angle-scan mode (RPHR ∼ θ curve), as shown in figure 1(b), in which a typically low field H = 60 Oe is used, the same order of magnitude as the coercivity of 20 Oe. When HU1 = 0, the low and high RPHR of the curve are virtually symmetric in shape, with a sharp transition exactly at 90°. However, the delay of the transition from [0 1 0] to ![$[\overline 1 \;0\;0]$](https://content.cld.iop.org/journals/0268-1242/29/3/035004/revision1/sst490141ieqn8.gif) with a noticeable asymmetry of PHE curve is clearly recognizable in figure 1(b) for the introduction of HU1 (HU1 = 10 and 20 Oe). That is, the angular width of the curve around [0 1 0] axis expands while that around
with a noticeable asymmetry of PHE curve is clearly recognizable in figure 1(b) for the introduction of HU1 (HU1 = 10 and 20 Oe). That is, the angular width of the curve around [0 1 0] axis expands while that around ![$[\overline 1 \;0\;0]$](https://content.cld.iop.org/journals/0268-1242/29/3/035004/revision1/sst490141ieqn9.gif) axis shrinks. This feature is a good indication for the stability difference of magnetization between two in-plane easy axes, easier to stay at [0 1 0] and harder to stay at
axis shrinks. This feature is a good indication for the stability difference of magnetization between two in-plane easy axes, easier to stay at [0 1 0] and harder to stay at ![$[\overline 1 \;0\;0]$](https://content.cld.iop.org/journals/0268-1242/29/3/035004/revision1/sst490141ieqn10.gif) . Such transition from symmetric to asymmetric RPHR ∼ θ curve can be explained by free energy density profile (E/M ∼ φ) calculated by equation (2). A comparison of E/M ∼ φ profiles at four representative field directions (θ = 90°, 95°, 100°, and 105°) for HU1 = 0 and 20 Oe is shown in figures 1(c) and (d), in which the energy difference between the neighboring minima at φ = 45° and 135° is highlighted by dashed lines. When HU1 = 0 and θ = 90°, the energy is equal around φ = 45° and 135°, whereas the energy around φ = 135° is noticeably higher as HU1 = 20 Oe is superimposed, leading to a comparable energy when the field is applied at θ = 100°. This tendency means that it is possible to rotate from [0 1 0] to
. Such transition from symmetric to asymmetric RPHR ∼ θ curve can be explained by free energy density profile (E/M ∼ φ) calculated by equation (2). A comparison of E/M ∼ φ profiles at four representative field directions (θ = 90°, 95°, 100°, and 105°) for HU1 = 0 and 20 Oe is shown in figures 1(c) and (d), in which the energy difference between the neighboring minima at φ = 45° and 135° is highlighted by dashed lines. When HU1 = 0 and θ = 90°, the energy is equal around φ = 45° and 135°, whereas the energy around φ = 135° is noticeably higher as HU1 = 20 Oe is superimposed, leading to a comparable energy when the field is applied at θ = 100°. This tendency means that it is possible to rotate from [0 1 0] to ![$[\overline 1 \;0\;0]$](https://content.cld.iop.org/journals/0268-1242/29/3/035004/revision1/sst490141ieqn11.gif) at θ = 90° when HU1 = 0, whereas the reorientation only occurs as the field direction increases to around θ = 100°. It is then concluded that the asymmetric rotation is intimately correlated to [0 1 0] uniaxial anisotropy and its value could be determined by the simulation of the asymmetry of the RPHR ∼ θ curve measured at low fields.
at θ = 90° when HU1 = 0, whereas the reorientation only occurs as the field direction increases to around θ = 100°. It is then concluded that the asymmetric rotation is intimately correlated to [0 1 0] uniaxial anisotropy and its value could be determined by the simulation of the asymmetry of the RPHR ∼ θ curve measured at low fields.
Angle-scan mode is employed to study the magnetization reversal process. In the experiment, we exerted a counterclockwise (CCW) angle scan of H with θ from 0° to 360° while the magnitude of H was kept as a constant. Given that the coercivity of (Ga,Mn)As is 20 Oe, fields of 330, 110, 90, and 75 Oe with magnitudes exceeding coercivity are chosen to study the magnetization reversal process under the angle-scan at a low temperature of 10 K. We note that the shape of RPHR ∼ θ curve at 330 Oe behaves as a sinusoidal function, because the energy of the system is primarily dependent on the fourth term (the Zeeman energy) in equation (2) and thus RPHR is proportional to sin 2φ according to equation (1). The Stoner–Wohlfarth formulation is employed to simulate the angle-scan curve with the field of 330 Oe, because the domain rotation under a high field can be fitted by the coherent rotation model. Corresponding experimental and calculated angle-scan curves at 330 Oe are presented figure 2(a). The values of cubic anisotropy HC and HU are calculated to be 330 ± 10 Oe and 15 ± 2 Oe, respectively, under least-square approximation. Differently, when the field decreases to 110 Oe (figure 2(b)), the RPHR ∼ θ curve becomes a rather square-like shape. The most eminent feature here is that the low resistance state around [0 1 0] and ![$[0\;\overline 1 \;0]$](https://content.cld.iop.org/journals/0268-1242/29/3/035004/revision1/sst490141ieqn12.gif) turns out to be wider than the high resistance state, e.g.,
turns out to be wider than the high resistance state, e.g., ![$[\overline 1 \;0\;0]$](https://content.cld.iop.org/journals/0268-1242/29/3/035004/revision1/sst490141ieqn13.gif) and [1 0 0], and this tendency is more remarkable as the field is reduced, reflecting an enlarged asymmetry. These features are reproduced by the calculations based on modifying the Stoner–Wohlfarth formulation by introducing the [0 1 0] uniaxial anisotropy, as expressed in equation (2). According to the best fit, the [0 1 0] uniaxial anisotropy field HU1 is calculated to be anomalously large, 33 ± 3 Oe, which is even twice as large as its
and [1 0 0], and this tendency is more remarkable as the field is reduced, reflecting an enlarged asymmetry. These features are reproduced by the calculations based on modifying the Stoner–Wohlfarth formulation by introducing the [0 1 0] uniaxial anisotropy, as expressed in equation (2). According to the best fit, the [0 1 0] uniaxial anisotropy field HU1 is calculated to be anomalously large, 33 ± 3 Oe, which is even twice as large as its ![$[\overline 1 \;1\;0]$](https://content.cld.iop.org/journals/0268-1242/29/3/035004/revision1/sst490141ieqn14.gif) counterpart HU. Although the magnetic anisotropies of (Ga,Mn)As are quite sensitive to the film growth [11], the semi-quantitative estimation that the ratio follows KC : KU : KU1 ≈ 100 : 10 : 1 is normally accepted [11, 19]. Hence we combine results of PHE and calculations to determine that their ratio could be KC : KU : KU1 ≈ 10 : 1 : 1, reflecting the importance of the [0 1 0] uniaxial anisotropy [20]. This finding is also supported by the measurements carried out at lower fields of 90 Oe (figure 2(c)) and 75 Oe (figure 2(d)).
counterpart HU. Although the magnetic anisotropies of (Ga,Mn)As are quite sensitive to the film growth [11], the semi-quantitative estimation that the ratio follows KC : KU : KU1 ≈ 100 : 10 : 1 is normally accepted [11, 19]. Hence we combine results of PHE and calculations to determine that their ratio could be KC : KU : KU1 ≈ 10 : 1 : 1, reflecting the importance of the [0 1 0] uniaxial anisotropy [20]. This finding is also supported by the measurements carried out at lower fields of 90 Oe (figure 2(c)) and 75 Oe (figure 2(d)).
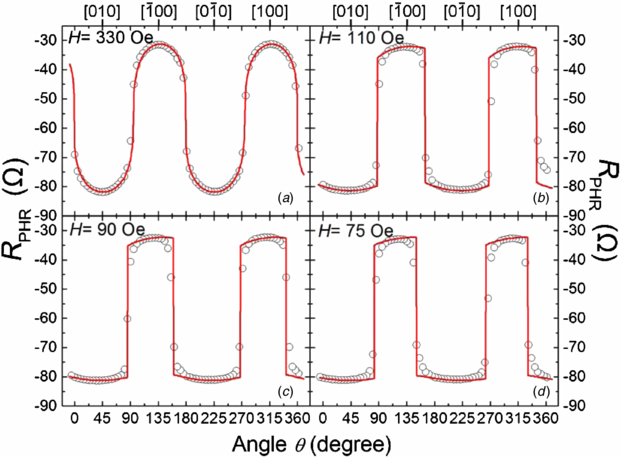
Figure 2. Angle-dependent planar Hall resistance with external magnetic field of 330, 110, 90, and 75 Oe measured at 10 K. The circles and solid line are the experimental and the best fitting curves under Stoner–Wohlfarth fomulation, respectively.
Download figure:
Standard image High-resolution imageWe then discuss the reorientation of magnetization at several typical angles θ when a typically low field H of 60 Oe is applied, from the viewpoint of free energy density profiles as a function of angle φ. Corresponding profiles are displayed in figure 3 and the polar plots for the magnetic easy axis are also shown in the inset. It is found that there are four energy minima angles, rather than a single energy minimum as high fields (e.g., 330 Oe; not shown) being applied [21]. A closer inspection of the curves in figure 3 reveals the information as follows: the angle φ locates at the position of θ when θ = 45° along [0 1 0] direction, and φ remains close to this location with a subtle lateral shift even when θ = 90°. Finally, φ rotates to 135° as θ = 135° along ![$[\overline {1\;} 0\;0]$](https://content.cld.iop.org/journals/0268-1242/29/3/035004/revision1/sst490141ieqn15.gif) . Differently, once θ stays at 180°, φ rotates to 225°, the direction of
. Differently, once θ stays at 180°, φ rotates to 225°, the direction of ![$[0\;\overline {1\;} 0]$](https://content.cld.iop.org/journals/0268-1242/29/3/035004/revision1/sst490141ieqn16.gif) . The same tendency is observed when θ is in the range of 225° to 360°. This magnetization rotation coincides with the experimental results in figure 2: the magnetization tends to stay around [0 1 0] direction, instead of
. The same tendency is observed when θ is in the range of 225° to 360°. This magnetization rotation coincides with the experimental results in figure 2: the magnetization tends to stay around [0 1 0] direction, instead of ![$[\overline 1 \;0\;0]$](https://content.cld.iop.org/journals/0268-1242/29/3/035004/revision1/sst490141ieqn17.gif) , producing the asymmetric rotation observed.
, producing the asymmetric rotation observed.
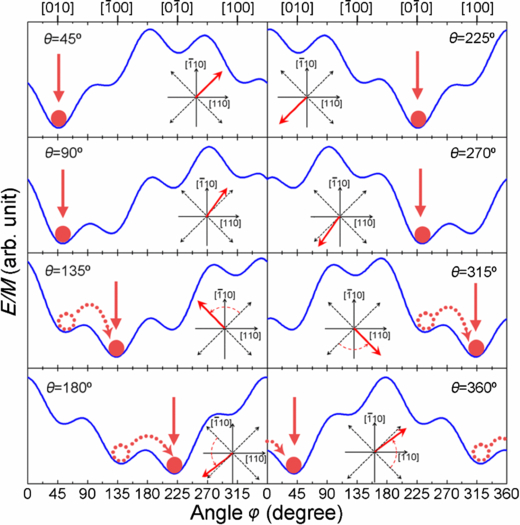
Figure 3. Evolution of energy density profiles as a function of angle φ for H = 60 Oe at several typical angles θ (θ = 45°, 90°, 135°, 180°, 225°, 270°, 315°, and 360°). The solid arrows and solid circles denote the present magnetization state, while dotted circles and dotted arrows represent the magnetization reversal process to the neighboring minimum. Polar plots for the magnetic easy axis are also shown in the inset.
Download figure:
Standard image High-resolution imageThe situation changes dramatically when the temperature is enhanced to 30 K. The shape of RPHR ∼ θ curves in figure 4(a) changes to be a peak at both low and high resistance states rather than a sinusoidal-like curve in figure 2(a) when H = 330 Oe, indicating that this field is strong enough to dominate the magnetic energy and the direction of magnetization follows the position of single energy minimum when the field is rotated. Similarly, the magnetization reversal process is also shown when a low field of 90 Oe is applied (figure 4(b)). Using equations (1) and (2), we extract the values of HC, HU and HU1 as 45 ± 4 Oe, 20 ± 2 Oe, and 30 ± 3 Oe, respectively. The uniaxial anisotropy fields are comparable at 30 K, supporting the findings of KU : KU1 ≈ 1 : 1 at 10 K. Remarkably, HC drops dramatically with the increase of temperature, i.e., HC at 30 K is only one tenth of that at 10 K. In contrast, we note that both HU1 and HU are stable with increasing temperature.

Figure 4. Angle-dependent planar Hall resistance with external magnetic field of 330 and 90 Oe performed at 30 K. The open circles and solid line are the experimental and the fitting curves under Stoner–Wohlfarth fomulation, respectively.
Download figure:
Standard image High-resolution imageFor ![$[\overline 1 \;1\;0]$](https://content.cld.iop.org/journals/0268-1242/29/3/035004/revision1/sst490141ieqn18.gif) UMA, recently both the cutting-edge nano-characterization methods [22] and theoretical calculations [23–25] proved that the local lattice distortion of Mn2+ ion impurities along the
UMA, recently both the cutting-edge nano-characterization methods [22] and theoretical calculations [23–25] proved that the local lattice distortion of Mn2+ ion impurities along the ![$[\overline 1 \;1\;0]$](https://content.cld.iop.org/journals/0268-1242/29/3/035004/revision1/sst490141ieqn19.gif) direction was responsible for the UMA [26]. Given that both [0 1 0] and
direction was responsible for the UMA [26]. Given that both [0 1 0] and ![$[\overline 1 \;1\;0]$](https://content.cld.iop.org/journals/0268-1242/29/3/035004/revision1/sst490141ieqn20.gif) UMA show quite similar temperature dependence with respect to our results discussed above, the strong [0 1 0] UMA in our case is most likely attributed to an enhanced Mn density along this direction and a resultant serious local lattice distortion around Mn2+. This speculation is also supported by the observation of gradual switching between [0 1 0] and [1 0 0] easy-axes with nail-like peaks both in PHE and spin injection experiments using our (Ga,Mn)As films [3, 14], in contrast to extensively reported sharp switching with plateau peaks [1, 8, 11, 12, 15]. Such asymmetric distribution of Mn2+ might be due to the unintended and unknown preparation conditions [22]. It is well known that the magnetic properties of (Ga,Mn)As vary from sample to sample and depend highly on the film growth conditions, the MBE chamber, epitaxy conditions, strain and co-doping, etc [11, 22, 27]. And even the samples grown by the same MBE chamber can be divided into two groups: large [0 1 0] or large
UMA show quite similar temperature dependence with respect to our results discussed above, the strong [0 1 0] UMA in our case is most likely attributed to an enhanced Mn density along this direction and a resultant serious local lattice distortion around Mn2+. This speculation is also supported by the observation of gradual switching between [0 1 0] and [1 0 0] easy-axes with nail-like peaks both in PHE and spin injection experiments using our (Ga,Mn)As films [3, 14], in contrast to extensively reported sharp switching with plateau peaks [1, 8, 11, 12, 15]. Such asymmetric distribution of Mn2+ might be due to the unintended and unknown preparation conditions [22]. It is well known that the magnetic properties of (Ga,Mn)As vary from sample to sample and depend highly on the film growth conditions, the MBE chamber, epitaxy conditions, strain and co-doping, etc [11, 22, 27]. And even the samples grown by the same MBE chamber can be divided into two groups: large [0 1 0] or large ![$[\overline 1 \;1\;0]$](https://content.cld.iop.org/journals/0268-1242/29/3/035004/revision1/sst490141ieqn21.gif) UMA [11]. It would be a huge challenge to directly characterize asymmetric Mn2+ distribution [22, 26], which needs further study.
UMA [11]. It would be a huge challenge to directly characterize asymmetric Mn2+ distribution [22, 26], which needs further study.
We now turn toward the quantitative analysis of the domain-wall pinning field (Hpin), which has a profound influence on the magnetization reversal process at low fields, in contrast to the coherent rotation at high fields [28, 29]. To elucidate the usefulness of Hpin, figure 5 presents an energy density profile (E/M ∼ φ) concerning the difference between the two neighboring minima at the moment of magnetization transition, as marked by the dotted arrow. An energy barrier (EB) exists between two neighboring minima, states I and II, which hinders the magnetization transition. That is, the magnetization cannot be reoriented when state II begins to be lower than state I; instead, the pre-requisite for the reorientation is that the energy difference is larger than the pinning energy Epin, |EI−EII| ⩾ Epin, as denoted in figure 5. Hence Epin is not a term of equation (2), but serves as a criterion to judge when the domains are reoriented.
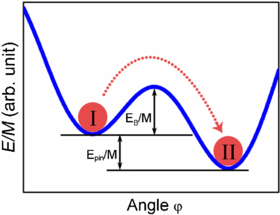
Figure 5. Schematic of energy barrier (EB/M) and domain-wall pinning field (Epin/M) for the angle-dependent planar Hall resistance measured at low fields.
Download figure:
Standard image High-resolution imageWe now address the question whether this concept can be demonstrated by experimental data in conjunction with calculations based on the modified Stoner–Wohlfarth model. Clockwise (CW) and CCW angle scans of H with θ in the range of 0°–360° are shown in figure 6, where H is fixed at 330, 110, 90, and 75 Oe. The data taken at 4 K and 10 K are presented in the left and right column, respectively. We focus firstly on the data measured at 4 K. When the sample is at 330 Oe, there is no clear shift of RPHR ∼ θ curve for the CW and CCW angle scans, and they are overlapped. These experimental curves can be perfectly reproduced by equations (1) and (2). When the field reaches a comparatively low value of 110 Oe, the curves with two different scans shift to opposite directions, producing a hysteretic window between the curves, where the energy can be described by |EI−EII| < Epin. The most interesting result here is that the calculated spectra with a term from Epin adding to equation (2) display the shift accurately replicating those of experimental RPHR ∼ θ curve. Hpin is 40 Oe at 4 K when H = 110 Oe, in contrast to Hpin = 0 Oe for H = 330 Oe. Measurements performed over a range of fields offer more insight into the pinning effect on domain walls. With further decreasing H to 90 Oe, the hysteresis window expands, corresponding to an increase of Hpin to 48 Oe, while it is 58 Oe with H = 75 Oe (bottom left panel in figure 6).
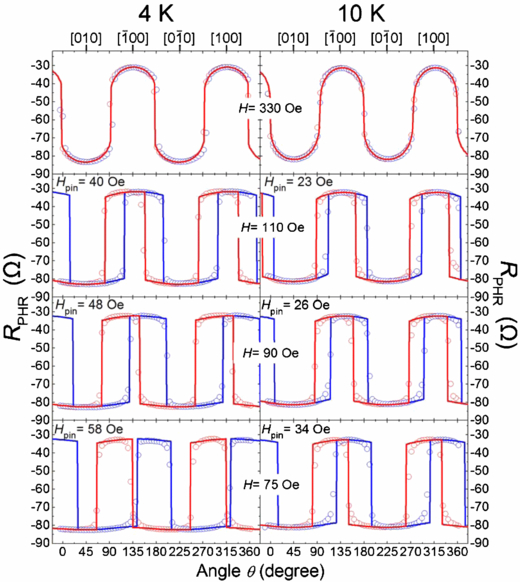
Figure 6. CW and CCW angle scans of H with θ in the range of 0° ∼ 360°, where H is fixed at 330, 110, 90, and 70 Oe. The data taken at 4 K and 10 K are presented in the left and right column, respectively.
Download figure:
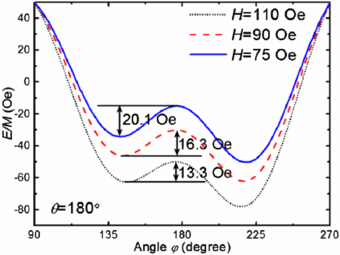
Standard image High-resolution imageSimilar measurements were performed at 10 K, and the influence of the temperature on the domain-wall pinning field is resolvable. The hysteretic window in the same external field is much smaller than its counterpart at 4 K. According to the calculation, this decay is due to the drop of Hpin with increasing temperature. These quantities assume values of Hpin = 0, 23, 26, and 34 Oe for the field of 330, 110, 90, and 75 Oe, respectively. This finding confirms that Hpin is not constant. Instead, it is not only relevant to [1 1 0] (or ![$[1\;\overline 1 \;0]$](https://content.cld.iop.org/journals/0268-1242/29/3/035004/revision1/sst490141ieqn22.gif) ) uniaxial anisotropy and temperatures [21, 30], but also strongly sensitive to the temperature. We then conclude that the decrease of external field causes the rising of pinning field, which decreases with the increase of temperature. The influence of temperature on Hpin can be explained as follows: (i) the increase of temperature reduces the cubic anisotropy, accompanied by the drop of the energy barrier; (ii) the increase of temperature contributes to the energy of the system and makes the motion of domain wall easier. The effect of external field on Hpin can be elucidated by the energy density profiles (E/M ∼ φ). A typical series with magnetic fields of 110, 90, and 75 Oe at θ = 180°, just before the magnetization reversal, is shown in figure 7. It is noted that the energy barrier EB and Epin abruptly drop with enhancing the external field. Corresponding HB = 20.1, 16.3, and 13.3 Oe and Hpin = 35.3, 32.0, and 28.1 Oe for H = 75, 90, and 110 Oe, respectively, suggesting that the magnetization reversal process becomes easier as H increases.
) uniaxial anisotropy and temperatures [21, 30], but also strongly sensitive to the temperature. We then conclude that the decrease of external field causes the rising of pinning field, which decreases with the increase of temperature. The influence of temperature on Hpin can be explained as follows: (i) the increase of temperature reduces the cubic anisotropy, accompanied by the drop of the energy barrier; (ii) the increase of temperature contributes to the energy of the system and makes the motion of domain wall easier. The effect of external field on Hpin can be elucidated by the energy density profiles (E/M ∼ φ). A typical series with magnetic fields of 110, 90, and 75 Oe at θ = 180°, just before the magnetization reversal, is shown in figure 7. It is noted that the energy barrier EB and Epin abruptly drop with enhancing the external field. Corresponding HB = 20.1, 16.3, and 13.3 Oe and Hpin = 35.3, 32.0, and 28.1 Oe for H = 75, 90, and 110 Oe, respectively, suggesting that the magnetization reversal process becomes easier as H increases.
Figure 7. The calculated energy density profiles when the external fields are 110, 90, and 75 Oe at θ = 180°, and the energy barrier is highlighted.
Download figure:
Standard image High-resolution image
4. Conclusion
In summary, we have investigated the angle dependence of the magnetization reversal process of the (Ga,Mn)As films at low fields. We realize the simulation of measured curves at low fields, via which quantitatively calculate the values of magnetic anisotropy field and domain-wall pinning field with the modified Stoner–Wohlfarth model. The [0 1 0] uniaxial anisotropy KU1 in our system is found to be twice as large as its ![$[\overline {1\;} 1\;0]$](https://content.cld.iop.org/journals/0268-1242/29/3/035004/revision1/sst490141ieqn23.gif) counterpart KU, producing the ratio of the order of KC : KU : KU1 ≈ 10 : 1 : 1, in contrast with the previously reported relative strength of the anisotropy terms: KC : KU : KU1 ≈ 100 : 10 : 1. The domain-wall pinning field decreases with enhancing external field and temperature. The quantitative determination of [0 1 0] uniaxial anisotropy and domain-wall pinning field would advance the completeness of the magnetic anisotropies of (Ga,Mn)As.
counterpart KU, producing the ratio of the order of KC : KU : KU1 ≈ 10 : 1 : 1, in contrast with the previously reported relative strength of the anisotropy terms: KC : KU : KU1 ≈ 100 : 10 : 1. The domain-wall pinning field decreases with enhancing external field and temperature. The quantitative determination of [0 1 0] uniaxial anisotropy and domain-wall pinning field would advance the completeness of the magnetic anisotropies of (Ga,Mn)As.
Acknowlegments
This work was supported by National Natural Science foundation of China (grant nos 51322101, 51202125 and 51231004), National Basic Research Program of China (grant no 2010CB832905), and National Hi-tech (R&D) project of China (grant no 2014AA032604). We thank M Utz, Professor D Bougeard, and Dr D Schuh in University of Regensburg for providing the (Ga,Mn)As wafers.