Abstract
The new full-metal ITER-like wall (ILW) at JET was found to have a profound impact on the physics of disruptions. The main difference is a significantly lower fraction (by up to a factor of 5) of energy radiated during the disruption process, yielding higher plasma temperatures after the thermal quench and thus longer current quench times. Thus, a larger fraction of the total energy was conducted to the wall resulting in larger heat loads. Active mitigation by means of massive gas injection became a necessity to avoid beryllium melting already at moderate levels of thermal and magnetic energy (i.e. already at plasma currents of 2 MA). A slower current quench, however, reduced the risk of runaway generation. Another beneficial effect of the ILW is that disruptions have a negligible impact on the formation and performance of the subsequent discharge.
Export citation and abstract BibTeX RIS
1. Introduction
The occurrence of tokamak disruptions is a key issue for ITER and could restrict its operational capabilities. In such events a rapid loss of the thermal energy followed by a quench of the plasma current results in large heat loads and electromagnetic forces on surrounding structures [1]. Furthermore, disruptions usually cause significant deconditioning, affecting the performance of subsequent discharges. Hence, considerable effort has been devoted to understanding the physics of disruptions, what causes them, how they can be avoided [2–4], their impact [5–7] and how to mitigate the effects [8–11].
In all these aspects the recent replacement of carbon (C) plasma-facing components (PFCs) with a metallic wall provided new challenges for the operation of JET. The ITER-like wall (ILW) consists of beryllium (Be) tiles in the main chamber and both bulk tungsten (W) and tungsten-coated tiles in the divertor [12]. The tolerable heat loads with the new wall are more restricted, with melting occurring already for heat loads of ∼20 MJ m−2 s−1/2 for Be and at ∼50 MJ m−2 s−1/2 for W [13]. For Be the melt limit will already be reached for a fast quench (∼2.5 ms) of 1 MJ thermal energy. About half of the magnetic energy is usually coupled back into the toroidal conducting structures such as the vacuum vessel or poloidal field coils [14], hence the other half can heat the PFCs. As an example, at a plasma current of Ip = 2 MA about 9 MJ of magnetic energy is available, which if quenched in 50 ms and deposited on typically 1 m2 could cause Be melting. This is a worst case estimate because the wetted area can be larger. Moreover, for C PFCs a significant part of this energy is usually radiated. Nevertheless, it raises the question of how much more vulnerable the ILW is to damage by disruption heat loads.
Another intriguing question is whether the change in the plasma-facing material itself can significantly affect the physics of disruptions. Changes in density or radiation control may also create new problems (i.e. new disruption causes) yielding a higher disruption rate [4]. Moreover, recycling and impurities are known to play a role in the physics of the density limit [15–17]. In section 2, a summary of the first studies on the impact of the ILW on disruption causes will be given. Next, in section 3, the effect of the ILW on the dynamics of the disruption process itself will be presented. Previous operations with Be main chamber belt limiters at JET already showed a considerable slower current quench time compared with operations with C PFCs [18]. The reasons for this difference and the consequences for heat loads, vessel forces as well as the efficiency of mitigation by massive gas injection will be discussed. Section 4 will compare out-gassing and deconditioning by disruptions with C PFCs and the ILW and will analyse the impact on the formation and performance of subsequent discharges. Despite the vulnerability of the new PFCs, intentional disruption studies featured heavily in the first experimental programme carried out with the ILW, in order to answer these issues. The main conclusions will be summarized in the final section.
2. Disruptions causes and the ILW
Over the last few years of operation with C PFCs, the (unintentional) disruption rate was found to drop significantly to a relatively low level of about 3.4% just before the installation of the new ILW [4]. First operations with the new ILW broke this trend, with an increased disruption rate; from August 2011 until mid of June 2012 about 2300 plasma discharges (with Ip > 1 MA) have been run, of which 8.6% disrupted unintentionally, more than twice the previous rate. Moreover, the later part of period, which featured high-performance operations, showed a disruption rate of 10–15%. To add to this, a large number of disruptions were carried out intentionally because assessment of disruption loads was key to expanding of the operational range with the new wall, bringing the total disruption rate to 13.2%.
2.1. New causes of disruptions
A more detailed study on the impact of the ILW on disruption causes is ongoing but two main differences are clear. Firstly, the ILW altered the density control; hence, recipes tuned during C wall operations did not work anymore and had to be retuned. Transient wall pumping by the Be main-chamber PFCs resulted in several cases in too low a density and error field locked modes. Most issues with density feedback were brought under control during the first three months of operation. Secondly, more disruptions were caused by strong accumulation of impurities, originating from W sputtering, while direct influx of W and Ni micro-particles has also been observed. Tungsten sputtering is determined mainly by the divertor plasma temperature and impurity content [19]. Control of impurity accumulation and peaking proved to be difficult, leading to strongly peaked impurity density and radiation profiles. This is similar to strong density peaking seen with the previous C PFCs that could eventually lead to a radiative collapse [4]. With the ILW the core radiation can be strong enough to cause hollow temperature profiles.
A typical example is shown in figure 1, where W accumulation occurs during the step-down of auxiliary neutral beam injection (NBI) power. Early signs are a change in sawtooth activity (seen here as a reduction in the n = 1 sawtooth precursor) and an increase in radiation from about t = 22.5 s. Soon after this, strong W lines can be observed by VUV spectroscopy and the temperature profile becomes hollow with a core temperature decreasing below Te = 370 eV. Most likely this affects the current density profile and the associated magnetohydrodynamic (MHD) activity is reminiscent of observations in JET and other devices [20, 21]. An MHD precursor instability (with a toroidal mode number n = 1) eventually creates a locked mode, at t = 23.845 s, causing a first thermal quench (and typical current spike). Instead of leading to a full disruption of the plasma, it actually results in a flushing of the core impurities and an increase in the core temperature back to a maximum of Te = 1.7 keV. These very high post-thermal quench temperatures lead to a nearly negligible current quench rate. A quasi-stationary mode persists and a second thermal quench (and current spike) takes place at t = 24.898 s. The plasma becomes vertically unstable thereafter and a further decrease in plasma temperature yields a faster current quench. The observations illustrate a few interesting points: the plasma improves after the thermal quench and the temperatures during the current quench may be high enough to slow it down significantly. The consequences of these slower current quenches will be discussed in the next section.
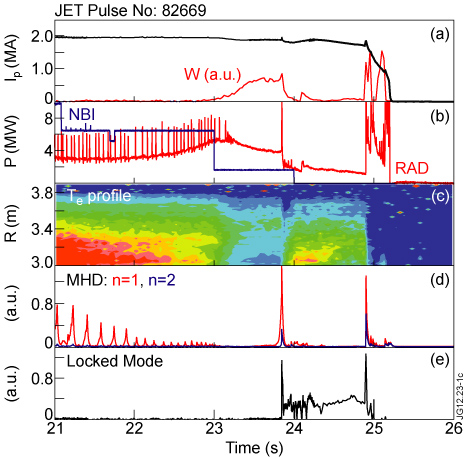
Figure 1. Example of a disruption caused by impurity accumulation. (a) Plasma current and core W spectroscopy intensity. (b) NBI and radiation power as measured by the bolometer. (c) Contour plot of electron temperature (Te) profile from the core at R = 3.0 m to the edge at R = 3.9 m. The levels range from blue (Te = 0 keV) to red at Te = 2 keV. (d) MHD activity with toroidal mode numbers n = 1 and n = 2. (e) Amplitude of the locked mode.
Download figure:
Standard image2.2. The density limit
In tokamaks, disruptions occur when the density is very high [22]. This well-known operational limit has, however, little to do with the actual average plasma density and is more related to radiation instabilities that develop at the plasma edge. For increasing edge density the corresponding temperature decreases, increasing the radiation efficiency of typical impurities. The line radiation eventually exceeds the local heating power with the result that below a specific temperature for a given impurity the edge temperature collapses. Deuterium recycling and re-ionization can also play a role in the cooling process of the plasma edge, becoming important when impurity concentrations are low [15]. The contraction of the plasma current profile due to the edge cooling eventually triggers MHD instabilities that cause the disruption.
Two density-limit disruptions with C PFCs and the ILW, respectively, are compared in figure 2. The main parameters of both ELMy H-mode discharges are similar; with BT = 3.1 T, Ip = 2.0 MA, q95 = 4.5, using the same high triangularity configuration with 〈δ〉 = 0.42 and comparable NBI heating powers PNB = 8–10 MW. The striking difference is that only 2.4 bar l of deuterium was injected in the plasma with C PFCs while 11.4 bar l was needed to disrupt the plasma with the ILW. In the latter case a maximum gas dosing rate of 5.5 × 10²³ electrons s−1 was reached, >5 times more than in C.
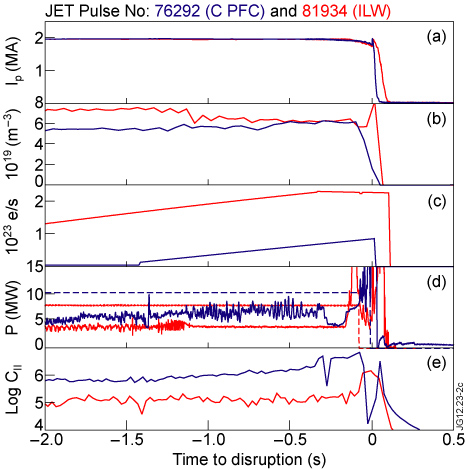
Figure 2. Comparison of density-limit disruptions with C PFCs and the ILW with similar main parameters BT = 3.1 T, Ip = 2.0 MA, q95 = 4.5, a high triangularity configuration with 〈δ〉 = 0.42 in ELMy H-mode using PNB = 8–10 MW. (a) Plasma current as a function of the time to the disruption, indicated by the current spike at t = 0 s. (b) Line-averaged density. (c) Deuterium dosing rate in electrons per second. (d) NB powers for both pulses (dashed) and the radiation powers. (e) Log of the C II line intensity (90.4 nm) in a.u.
Download figure:
Standard imageThe disruption process with C PFCs typically showed a back transition from H to L-mode, detachment of the outer divertor, formation of an X-point and inner-wall MARFE (i.e. localized radiation instabilities) that triggered MHD instabilities and eventually the disruption [22]. The inner divertor is usually already fully detached much earlier in the discharge. In figure 2 it can be seen that for C PFCs this whole process starts ∼150–200 ms before the disruption. The loss in confinement due to the H to L back transition usually leads to a drop in density due to the lower particle confinement in L-mode, thus the actual disruption takes place below the maximum achievable density. With the ILW the H to L back transition and drop in density takes place 1.1 s before the disruption. The maximum achievable density is set by a non-disruptive H-mode density limit. The physics related to the confinement back transition is unlikely to be related to the events that eventually trigger the disruption in L-mode.
The exact limit at which the edge becomes unstable due to impurity radiation losses is of course determined by the edge impurity content, as shown in figure 2; with the ILW the C influx was found to be more than one magnitude lower [24]. The beryllium content of ILW plasmas, which results from physical sputtering, decreases strongly at high densities. It was observed that the onset of the radiation instability or MARFE occurred with the ILW at a significantly lower edge temperature [23]. For ILW edge plasmas D and Be can be considered the main radiators. Because the radiation efficiency for Be is about a factor of 10 lower than for C and the optimum radiation temperature is ∼2 eV compared with ∼10 eV for C, the radiation instability develops at much lower temperatures. This makes it possible to operate at higher edge (and line-averaged) densities with the ILW with the ultimate limit probably dominated by radiation from deuterium-related species [23].
3. Impact on current quench, forces and heat loads
In figure 2 another important difference is the substantially longer current quench time for the disruption with the ILW. The observation in figure 2 is quite representative and in figure 3 the statistics of current quench times is shown for a large number of C PFCs and ILW cases. For JET, the current quench time can range from several tens to hundreds of milliseconds. Here, the normalized current quench times are defined as 5/3 of the time it takes to reduce the current from 80% of its pre-disruption value to 20%, divided by the plasma cross-section area. The figure shows that the current quench times are systematically longer for the ILW and 49% of disruptions have a 'slow' normalized current quench time arbitrarily defined as 5/3 t80−20/S > 19 ms m−2 compared with 5.8% for C PFC disruptions. Only 4.2% of the ILW disruptions have an arbitrary 'fast' normalized current quench time below 5 ms m−2 (these were almost all vertical displacement events (VDEs)), contrasting with 45% of C PFC disruptions. Some of the very slow current quench cases exhibit multiple thermal quenches and current spikes, each in turn step-wise reducing the plasma temperature.
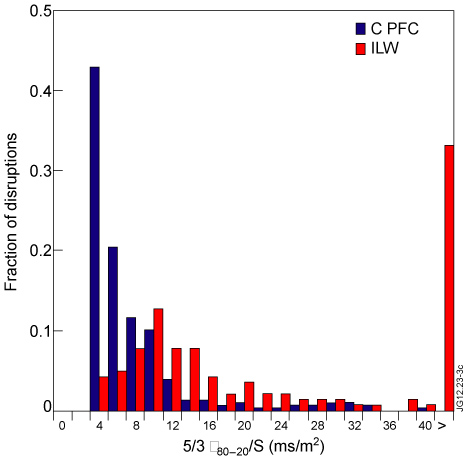
Figure 3. Statistical comparison of the current quench times 5/3 t80−20/S for C PFCs and ILW operations. The statistics are based on all 308 unintentional disruptions over the C PFCs period 2008–2009, that did not exhibit runaway formation, and 142 unintentional disruptions for the first operations of the ILW in 2011 and 2012, that were not mitigated by massive gas injection.
Download figure:
Standard imageDissipation of both thermal and magnetic energy during a disruption can be described by a set of coupled differential equations:


The (poloidal) magnetic energy can be dissipated by Ohmic heating (POH), induced by the poloidal field coils but also coupled back into toroidal conductors via transformer action (Pcoupled), as described in [14], or by accelerating electrons to relativistic velocities forming so-called runaway electron beams. Heat loads due to such runaway electrons could pose a serious threat to the PFCs [1, 26]. The power coupled back to external circuits and structures during the current quench phase is not negligible and usually between 40% and 50% of the magnetic energy is dissipated in this way. The thermal and runaway electron energy can be conducted directly to the PFCs (Pcond). Part of the thermal energy will be radiated (Prad). Neglecting runaways, equation (1) is the energy form of Ohm's law,

The first part on the right-hand side is the flux provided by the poloidal field coils to drive the plasma current (i.e. the loop voltage) but also the coupling of current or plasma energy back into these coils or any other toroidal conductors such as the vacuum vessel during a current quench due to the mutual inductance, M. Here IT are the currents flowing in these conductors. It is clear that the current quench duration relates to the L/R time of the plasma, the ratio of the plasma inductance, L (for JET approximately 4 µH), and its resistance, R, and hence should scale, assuming Spitzer, as
 , where Zeff and 〈Te〉 are the average effective charge and electron temperature, respectively [25]. If one neglects the mutual inductance, it is easy to calculate that a current quench time lower than 27 ms would correspond to temperatures as low as 〈Te〉 ∼ 5 eV (for Zeff = 4) while those above 154 ms would suggest temperatures above 〈Te〉 ∼ 40 eV.
The radiation during disruptions with the ILW was found to be lower compared with the levels found during C PFC disruptions. Note that lower post-thermal quench temperatures for C PFCs are not only the result of the higher radiation but they also enhance the impurity radiation efficiency. For the two cases shown in figure 2, a total of Erad = 3 MJ is radiated during the disruption with the C PFCs, which contrasts to Erad = 1.5 MJ with the ILW. Both cases have an identical magnetic energy of Emag = 10 MJ and similar thermal energy Etherm ∼ 1 MJ at the time of the thermal quench. Figure 4(a) shows a direct correlation between the duration of the current or magnetic energy quench and the fraction of energy that is radiated. For C PFCs the heat load due to the thermal quench may have released more C into the remaining plasma, with post-thermal quench temperatures close to the optimum temperature for C radiation (∼10 eV). Hence further cooling by line-radiation losses, similar as with the onset of a density-limit disruption, can be expected [13]. For the ILW radiation losses are not dominant and the temperature after the thermal quench may settle at higher values (i.e. ≫100 eV), well above the optimum for Be line radiation. As shown in figure 1 the temperature may even increase again after a thermal quench.
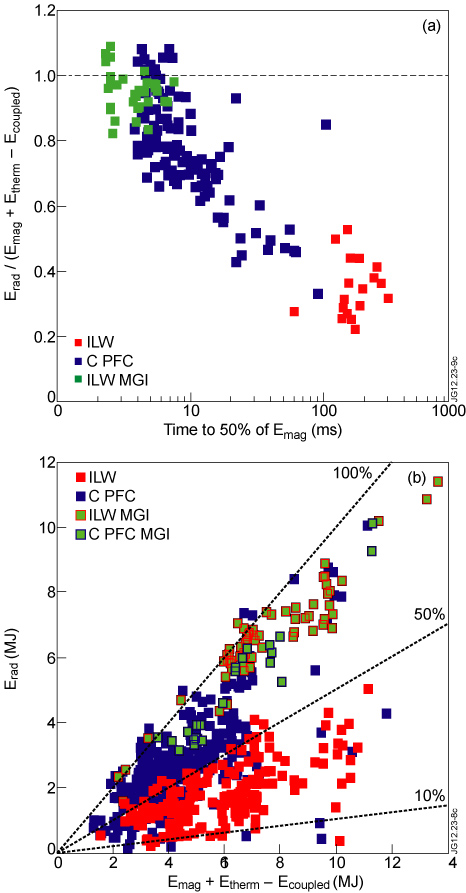
Figure 4. (a) Fraction of energy not coupled back into the toroidal conductors, that is radiated during the current quench versus the time it takes to reduce the magnetic energy
 to 50%. (b) Total energy radiated during the current quench phase versus the part of the total energy that is not coupled back into the toroidal conductors. In both graphs blue represents unmitigated disruptions with C PFCs, and red those with the ILW. In green those mitigated by MGI, which in (b) are differentiated between those with C PFCs (blue edge), and ILW (red edge).
Download figure:
Standard imageThe higher post-thermal quench temperature, lower Zeff, and thus longer current quench time has several consequences. Firstly, a slower reduction in plasma current reduces eddy currents in the surrounding conductors, thus lowering the resulting eddy current forces. Moreover, a slower quench of plasma current induces a smaller toroidal electric field. This electric field can accelerate electrons to high energies, so-called runaway electrons. Experiments have so far shown that disruptions that produced runaways with C PFCs do not create any when repeated with the ILW, identical to that found with earlier JET experiments with Be limiters [18]. This suggests that the longer current quench lowered the toroidal electric field below the level critical to generate runway electrons. The latter also depends on Zeff and Te but scales as
 [26]. It should be said that this result does not exclude the formation of runaway beams with an ILW, but merely makes them less likely.
3.1. Disruption heat loads
During disruptions with the ILW a smaller fraction of the total energy is radiated, and thus a larger fraction is directly conducted to the wall. Figure 4(b) also shows that for C PFC disruptions up to 100% of the energy that is not coupled back into the poloidal field coils was radiated. This contrasts with the ILW, where more than 50% is never radiated. This is especially true for VDEs that make early contact and have shown radiation fractions as low as 10% of the total energy. It is obvious from the calculations presented in the introduction that this could lead to melt damage. It should be noted that the magnetic energy is more slowly dissipated due to the longer current quench with the ILW; however, this is not sufficient to compensate for the larger fraction of conducted energy.
For the density-limit disruptions shown in figure 2, both high triangularity configurations become vertically unstable after the thermal quench and interact with the upper part of the vessel. The peak and average temperatures measured by a fast infra-red camera are shown in figure 5. The temperatures found for the ILW case are significantly higher with an increase of ΔT = 450 °C reaching a peak temperature while the comparable C PFC case had ΔT ∼ 210 °C. As mentioned above a significant higher fraction of the total energy was radiated during the C PFC current quench.

Figure 5. (a) Plasma current for three discharges; two density-limit disruptions with C PFCs and the ILW, shown in figure 2 and an intentionally triggered VDE with the ILW, at a lower plasma current, shown in black. (b) Vertical position. (c) Maximum temperature measured in the upper part of the vessel (upper-dump plates, upper inner-wall protection). This does not necessarily have to be at the same location in time. Note that the vessel operating temperature at JET is 200 °C. (d) Total radiated energy during the current quench phase.
Download figure:
Standard imageAdded to figure 5 is an example of an intentionally triggered upward VDE. The plasma configuration is similar to the other two discharges, though the plasma has a lower total energy content of Emag + Etherm = 5.5 + 2.2 = 7.9 MJ prior to the disruption. Nearly 49% of the magnetic energy was coupled back into the toroidal conductors but only 0.6 MJ of it was radiated, remaining 4.3 MJ to be directly conducted to the PFCs. The peak temperature exceeding the Be melt limit (1287 °C) was measured in these cases in the upper part of the vessel. In-vessel video inspection following these experiments showed signs of Be melting on protection tiles near the top of the machine. It should be noted that peak temperatures obtained by these events depend strongly on the detailed interaction between the plasma and the PFCs. Reshaping of the plasma configuration and movements of the contact point could spread the heat loads and lead to strong asymmetries in the deposition and thus temperature patterns on, for example, the upper protection tiles. It is therefore not straightforward to connect peak temperatures with the average heat loads expected during a disruption [7, 28]. Detailed analysis showed that the total power load in the upper part of the vessel due to such disruptions scaled with the available total pre-disruption energy [28].
3.2. Disruption forces
Electromagnetic forces are exerted on the vessel, either by eddy currents, induced by the plasma current decay and displacement, or by so-called halo currents, that run from the plasma through the surrounding conductors it touches [5]. Larger halo currents can be generated if the plasma touches early in the current quench phase. Hence, if the plasma moves vertically faster (i.e. a faster vertical growth rate) than the plasma current drops (i.e. a slow current quench), the fraction of plasma current in the halo is expected to be higher [5]. Lower halo fractions can be obtained even with slow current quenches, as long as the vertical growth rate is slower [29]. This is the case for the example shown in figure 1, which has a very slow current quench and a maximum halo fraction of not more than 5% of the pre-disruption current. The overall picture found with the ILW is that no significant change in toroidal asymmetry with respect to the C PFCs is observed, though slightly higher halo fractions are obtained. In figure 6 the halo currents and vessel forces are shown for the two density-limit disruptions discussed in the previous section (figure 2). The duration of the current quench is between 30 and 100 ms for these two plasmas. The high triangularity plasma configuration 〈δ〉 = 0.42 has a high vertical growth rate (γ ∼ 50–100 s−1), leading to a VDE directly after the thermal quench. Thus, the VDE can be considered fast with respect to the current quench. The halo current fraction in both cases is similar at ∼30% in spite of the slower VDE growth rate for the ILW case (see figure 6(c)). The toroidal asymmetry or toroidal peaking factor (TPF) is in both cases approximately unity. Thus, the force induced by the halo currents is expected to be the same. Previously (with C PFCs), the reaction of the vessel was found to scale proportionally to the halo current [5]. A large difference is seen, however, in the reaction of the vessel to the applied force by the halo current, with a significantly larger reaction by the vessel for the ILW (i.e. the peak-to-peak value of the force swing shown in figure 6(d)).

Figure 6. Comparison of halo currents and vessel reaction forces induced due to the two density-limit disruptions with C PFCs and the ILW, shown in figure 2. (a) Plasma current as a function of the time to the disruption, i.e. the thermal quench at t = 0 s. (b) Average halo current measured by coils at the upper part of the vessel. (c) Vertical plasma position, indicating the VDE that develops after the thermal quench. (d) Measured dynamic reaction force of the JET vessel.
Download figure:
Standard imageThe larger reaction force can directly be explained by the longer current quench phase, and thus the halo duration. The JET vessel characteristic time (fo ∼ 14 Hz) is longer than the duration of most disruptions. Thus, the vessel processes the force like a mass–damper–spring system, creating the damped oscillations seen in figure 6(d). The maximum displacement obtained in such a system is directly proportional to the force if this is applied continuously or for much longer than the natural frequency of the spring (the JET vessel). Hence one could express the vertical vessel displacement in units of an equivalent static force (Fv). For the JET vessel a static force of Fv = 1 MN is equivalent to a vessel excursion of about 1.3 mm. However, for shorter impulses the maximum displacement can be much larger than the continuous application of a force of the same magnitude. A maximum is found when the impulse duration is resonant with the vessel characteristic time. For shorter durations, as is mostly the case for JET, the vessel reaction force would scale proportionally to the impulse, i.e. proportional to the time-integrated halo force. Figure 7(a) shows that there is a spread of more than a factor of 2 in the reaction forces for disruptions that produce similar halo currents and TPF. A better correlation is found in figure 7(b), where Fv is plotted against the force impulse. Clearly, the longer current quench duration can affect the reaction forces and vessel displacements due to disruptions, either for vertical displacements, as discussed above, or radial displacements, as discussed elsewhere [13, 27].
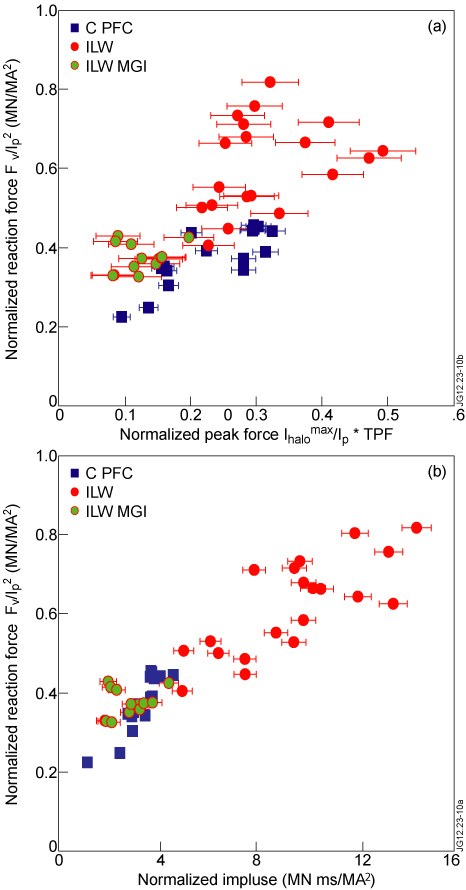
Figure 7. (a) Equivalent static force required for the measure vessel excursion normalized to the plasma current squared versus the normalized halo current force, similar to that presented in [5] for a set of high triangularity C PFCs and ILW disruptions. (b) The same parameter versus the time-integrated halo force or impulse also normalized to the plasma current. Those ILW disruptions mitigated by means of MGI are separately labelled.
Download figure:
Standard image3.3. Mitigation by massive gas injection
The above results showed that mitigation of disruption heat loads and forces has become a necessity with the ILW. Massive gas injection has been a tested method for several years at JET [11]. In figure 4(b) it can be seen that MGI is capable of increasing the radiation fraction to nearly 100% with the ILW, thus significantly reducing the fraction of energy conducted to the PFCs and reducing the current quench duration. In figure 7 it is shown that the reduction in current quench duration for MGI-mitigated ILW disruptions resulted in a lower reaction force on the vessel, albeit not as low as found for natural disruptions with a similar plasma configuration that occurred with C PFCs. This could be explained by the fact that a fast current quench due to MGI is sometimes preceded by a slower current decay when the gas is not effective yet during which a halo current is able to build up during this period (a more detailed analysis of MGI with the ILW is given elsewhere [28]).
MGI was previously never applied at JET as an active mitigation technique, i.e. used in a closed-loop protection system, triggered by real-time warning signs. In order to avoid further melt damage and to reduce the large vessel reaction forces seen for unmitigated ILW disruptions, MGI has been used for the first time as part of an active protection system at JET. It has become an obligatory requirement for all operations with Ip ⩾ 2.5 MA. Since the first use of MGI as part of an active protection system, more than 35 high current disruptions have been mitigated. It should be noted that the effectiveness of the total system also depends, in addition to the MGI efficiency to increase the fraction of radiation, on appropriate warning signs/signals and the reaction time. So far, in all cases the gas reached the plasma after the thermal quench but during the current quench. As discussed in the introduction it is possible that a fast quench at high thermal energy could also result in melt damage. The intentional VDE shown in figure 5 shows two temperature maxima, the first linked to the fast thermal quench and the next to the slower dissipation of a larger amount of magnetic energy. For most unintentional, natural disruptions, this has not been an issue up to know as the thermal energy was degraded significantly prior to the onset of such disruptions. This was either due to MHD activity that affected the confinement, very high radiation due to impurities (as shown in figure 1) or simply because other warning signs had initiated, for example the shut-down of auxiliary heating systems. However, for high-performance operations, foreseen in the future, the trigger for the MGI protection has to be optimized in order to also mitigate the thermal quench of high thermal energy plasmas.
4. Out-gassing and deconditioning
Disruptions can lead to significant degradation of the tokamak conditioning. For operations with C PFCs, conditioning at JET was usually obtained by baking of the vessel, glow-discharge cleaning or Be evaporation. Frequent glow-discharge cleaning was carried out during weekends [30]. The impact of a disruption could be noted in the subsequent discharge by an increased recycling, and higher impurity content, yielding performance (i.e. confinement) degradation. Moreover, in quite a few cases it prevented plasma formation or breakdown entirely. Over the last two years of operation with C PFCs, it has been found that 27% of all first breakdown attempts, following a disruption, failed, yielding a significant loss of operational time. Sometimes, additional conditioning, using the aforementioned techniques, had to be applied to regain the plasma.
Important, for the deconditioning due to disruptions, is their impact on the PFCs and the resulting release of material, either hydrogen isotopes or impurities, retained by the wall. The out-gassing can be quantified by the peak pressure seen in the vessel after the discharge [31]. A comparison of out-gassing by disruptive and non-disruptive discharges during both C and ILW operation is shown in figure 8. As expected the out-gassing for disruptive discharges is significantly larger than for non-disruptive cases. More interestingly, with the ILW the disruptive out-gassing has dropped by about one order of magnitude on average. This indicates that the reservoir of material that can be released by disruptions is smaller with the ILW. The reverse is seen for non-disruptive discharges, for which the ILW shows a slightly higher out-gassing compared with C PFCs. This is consistent with a lower long-term retention (i.e. less stays behind after the discharge) [24]. Residual gas analysis has revealed that the composition of the gases released by the ILW is characterized by much lower C and O levels (one order of magnitude) compared with C PFCs. With the ILW no breakdown failures attributable to deconditioning have occurred so far making operations more efficient. This statement covers all disruptions including those that were mitigated by MGI. The question as to what extent MGI affects the general plasma performance will not be addressed here.
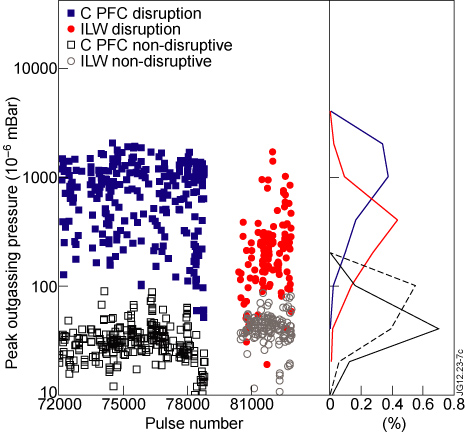
Figure 8. Peak pressure in the tokamak measured after the discharge with Penning gauges, which indicates the amount of out-gassing, for all unintentional disruptions (Ip > 1 MA) over the period 2008–2009 (C PFCs pulse no 72003–78806) and 2011–2012 (ILW pulse no 80128–82881). These are compared with a series of undisruptive examples. Discharges performed in He or without cryogenic divertor pumping or disruptions that were mitigated by MGI are not shown.
Download figure:
Standard imageRadiation spikes are observed in some ILW pulses and have been shown to be caused by particles of W, the most common, but also by particles of Ni or Fe, which enter the plasma. A correlation is found between the influx of micro-particles and the preceding disruptions with the ILW. The influx of these particles was detected and counted using radiation spikes. Such particles occurred in about 25% of all discharges following a disruption, which is almost seven times the average. The occurrence of these impurity influxes was also found to drop over time, during the progress of the experimental campaigns, the opposite trend to that of disruption frequency which increased. This indicates that disruptions do not form the micro-particles, but more likely redistribute existing particles, making them accessible to subsequent discharges. Over time, more and more of these particles must have reached locations from which even disruptions could not move them. Most discharges survived these radiative micro-particles. Their occurrence during the first phase of operation with the new wall is similar to that with C PFCs. Note that with the ILW, the influx of high-Z micro-particles rarely caused disruptions, in contrast to the influx of W due to sputtering, as discussed in section 2.
Dust particles can be observed after disruptions, using the JET high-resolution Thomson scattering diagnostic [32]. Plasma-facing material can be eroded and re-deposited creating unstable surface layers, which can be converted into dust particles by large thermal or mechanical loads [33]. As discussed above, unmitigated disruptions could conduct significant energies to the ILW, as only part of the total energy is radiated. But erosion and dust formation can also take place during the limiter operation. After the disruption laser light used by the diagnostic is scattered by particles in the tokamak vessel. It is difficult to determine whether the amount of scattered light is due to a few big particles or a larger number of smaller particles. For a rough comparison here the total amount of scattered light per disruption is used as a measure of the amount of dust seen after a disruption. For both C PFCs and ILW operation the amount of scattered light from dust particles was found to increase with the vessel reaction force, as shown in figure 9. The comparison in figure 9 also showed that the amount of dust observed with the new metal wall is a factor of 10 lower compared with the levels seen over the last two years of C PFC operations. Up to now there is no indication of an increase in the detected dust level during the ongoing operations with the ILW. ILW plasmas are much cleaner than their C PFC counter parts with typical Zeff in H-mode in the range 1.2–1.4 with ILW compared with 1.8–2.5 with C PFCs. Cleaner plasmas mean less material migration and so slower growth of deposits that can be converted into dust.

Figure 9. Average amount of dust per disruption as a function of the vessel reaction force due to disruptions. Here the amount of dust is defined as the total integrated laser light scattered by the material in the vessel, seen by the JET high-resolution Thomson scattering diagnostic, after a disruption. The integration is performed over all radial channels and over the duration of the signal. Larger error bars are found for the C PFC data because of the larger variation of the data per disruptions in each bin, especially for the bin Fv = 1.8–2.4 MN.
Download figure:
Standard image5. Conclusions
The new JET ITER-like wall has had a significant impact on disruption physics at JET. The strong reduction of C concentration seen from the very first ILW discharges has two direct consequences. Firstly, the onset of the disruptive 'density limit', the MARFE development, occurs at lower divertor temperatures, well below the optimum temperature for C radiation, and thus it is possible to achieve higher line-averaged plasma densities. Secondly, lower radiation and higher temperatures are observed during unmitigated ILW disruptions, which lengthen the current quench phase, increase the impulse to the vessel and result in a larger fraction of the total energy being conducted to the wall which is vulnerable to melting.
A clear distinction between the non-disruptive H-mode density limit, resulting in a confinement back transition to L-mode, and the disruptive L-mode density limit was found. Triggering such disruptions with the ILW required significant higher gas dosing (factor 5) compared with C PFC operation. This suggests that impurity radiation losses at the edge are more relevant to the process that drive the plasma unstable than recycling and re-ionization losses [23].
Typical current quench times suggest that for C PFCs, the temperatures after the thermal quench would have been merely several tens of eV and close to the optimum temperature for C radiation. The influx of wall material due to the heat pulse of the thermal quench impacting on the C PFCs could be seen as self-mitigating in this case, increasing the impurity content, radiative fraction, lowering the temperature and thus enhancing the current quench rate. This does not take place with the ILW because of the absence of carbon. In several cases, flux surfaces were restored after the thermal quench, radiation levels remained low and Ohmic power could even restore the plasma temperatures, yielding longer current quench phases. VDEs have, even at a low current (Ip = 1.5 MA, Etot = 7–8 MJ), caused Be melt damage as a result of heat loads associated with the dissipation of magnetic energy. High heat loads due to fast thermal quenches in high-performance discharges could also pose an additional problem but have so far not occurred during the first operations with the ILW. The longer current quench time resulted in larger reaction forces and vessel displacements. Active mitigation by MGI therefore became a necessity for ILW operations both because of heat loads and forces. For the first time it has been applied as an active protection system at JET. On the positive side, the longer current quench rates and thus lower toroidal electric fields have made it more difficult to generate runway electron beams.
Cleaner machine conditions after the installation of the ILW are indicated by lower dust levels and fewer influxes by high-Z micro-particles. Disruptions with the ILW, unmitigated and even those mitigated by MGI, were found to have a negligible impact on the following discharge. So far no cases have been found where the plasma formation failed because of deconditioning due to disruptions. A lower fraction of non-sustained breakdown failures made JET operations, and especially dedicated disruption experiments, more efficient.
Acknowledgments
This research was funded partly by the European Communities under the contract of Association between EURATOM and FOM and was carried out within the framework of the European Fusion Development Agreement. The views and opinions expressed herein do not necessarily reflect those of the European Commission.
© Euratom 2012.