Abstract
We report the breakdown electric field and energy density of laser ablated BaTiO3/Ba(1−x)SrxTiO3 (x = 0.7) (BT/BST) relaxor-ferroelectric superlattices (SLs) grown on (100) MgO single crystal substrates. The dielectric constant shows a frequency dispersion below the dielectric maximum temperature (Tm) with a merger above Tm behaving similarly to relaxors. It also follows the basic criteria of relaxor ferroelectrics such as low dielectric loss over wide temperature and frequency, and 50 K shift in Tm with change in probe frequency; the loss peaks follow a similar trend to the dielectric constant except that they increase with increase in frequency (∼40 kHz), and satisfy the nonlinear Vogel–Fulcher relation. Well-saturated ferroelectric hysteresis and 50–80% dielectric saturation are observed under high electric field (∼1.65 MV cm−1). The superlattices demonstrate an 'in-built' field in as grown samples at low probe frequency (<1 kHz), whereas it becomes more symmetric and centered with increase in the probe frequency system (>1 kHz) which rules out the effect of any space charge and interfacial polarization. The P–E loops show around 12.24 J cm−3 energy density within the experimental limit, but extrapolation of this data suggests that the potential energy density could reach 46 J cm−3. The current density versus applied electric field indicates an exceptionally high breakdown field (5.8–6.0 MV cm−1) and low current density (∼10–25 mA cm−2) near the breakdown voltage. The current–voltage characteristics reveal that the space charge limited conduction mechanism prevails at very high voltage.
Export citation and abstract BibTeX RIS
1. Introduction
With increased fossil fuel costs and worries about anthropogenic climate change, the power and energy industry has initiated research, development and new technologies based on the issues pertinent to harvesting sources of green energy (e.g., wind and solar power) as well as both large- and small-scale storage materials and devices. The most ideal energy storage devices will have three qualities: high power density, high energy density and low cost. Nature makes it difficult to obtain both high energy and power density in one system by any method [1–4]. Scientists are looking for either a hybrid system or some novel materials that possess both the qualities. Ragone plots indicate that electrostatic capacitors are efficient in delivering very high power (104–107 W kg−1) density, but they have never been considered as potential candidates for the energy density devices. Supercapacitors possess a moderate amount of power (102–105 W kg−1) and energy (0.1–10 W h kg−1) density. Li ion batteries and solid oxide fuel cells have very high energy densities 10–200 W h kg−1 and 200–2000 W h kg−1 respectively, but have never been considered as power electronics due to very slow motion of mobile charge carriers [1]. It has been considered that materials having high bipolar density with nano dipoles (polar nano regions (PNRs)) may be potential candidates for high power as well as high energy devices.
The current high power electronics market mainly uses high-k dielectrics (dielectric constant less than 100, with linear dielectric). Although these dielectrics show very high electric breakdown strength (>3–12 MV cm−1), their dielectric constant is relatively very low which in turn offers 1–2 J cm−3 volume energy density. Recently, polymer ferroelectrics, antiferroelectrics and relaxor ferroelectrics have shown better potential and higher energy density compared to the existing linear dielectrics [5–10]. Major concerns with high dielectric constant ferroelectrics are high dielectric saturation/tunability under high electric field and low breakdown field. Chu et al presented the high breakdown field and energy density in the P(VDF–TrFE) copolymer system; the introduction of defects in this system converts it to a relaxor ferroelectric with almost negligible remanent polarization. The main problems with ferroelectric polymers are very low dielectric constant with 70–80% dielectric saturation under high electric field. The slim hysteresis of relaxor ferroelectrics provides high electric displacement or charge density, a large area to store the energy and fast discharge capacity [2].
Recently, Yao et al has reported a series of relaxor/antiferroelectric, i.e. (Pb0.97La0.02)(Zr0.90Sn0.05Ti0.05)O3 (PLZST) antiferroelectric thin films, Pb(Zn1/3Nb2/3)O3–Pb(Mg1/3Nb2/3)O3–PbTiO3 (PZN–PMN–PT) relaxor-ferroelectric thin films and poly(vinylidene fluoride) (PVDF)-based polymer blend thin films that show high energy density (10–25 J cm−3); however, the frequencies used, real dielectric saturation and electric field factors are not clearly stated [4]. Ceramic–polymer and ceramic–glass composites are also considered as some of the favorite areas for high energy density capacitors. The relative energy density of ceramic–polymer composites is often found to be less than that of the unfilled polymer matrix; a similar situation prevails for glass–ceramic composites [11–14].
The energy density of either linear or nonlinear dielectrics can be obtained from the discharge energy density with an applied field; it is represented by the integral  where
where  is the energy density, E is the applied electric field and P is the charge density (in the case of ferroelectric materials it is the polarization or displacement charge). Different kinds of dielectrics and their dielectric responses under external fields are presented by the schematic cartoon diagram in figures 1(a)–(d); the shaded area represents the effective energy density of the system.
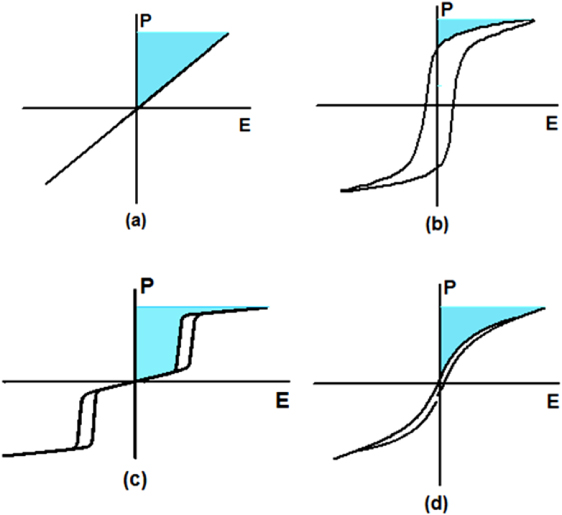
Figure 1. A schematic cartoon of the P–E behavior of (a) linear, (b) ferroelectric, (c) antiferroelectric and (d) relaxor/relaxor- ferroelectric materials. The shaded area of the polarization (P) and electric field (E) is related to the stored energy density of the dielectrics.
Download figure:
Standard imageThe direct way to calculate the energy storage capacity per unit volume of the material is

The direct way to calculate the energy storage capacity per unit mass of the material is
where C is the capacitance, V is the voltage, ε is the dielectric constant of the material, ε0 is the dielectric constant of vacuum, tele and tdie are the thicknesses of the electrode and the dielectric, Eb is the breakdown field, Vb is the breakdown voltage, ρele and ρdie are densities of the electrode and the material, A is the area of the electrode, m is the mass of the SL thin film and η is the voltage factor in order to save the capacitor from breakdown. The dielectric is stressed during the continuous application of external electric field which, in turn, causes premature electrical breakdown of the capacitor. To be on the safe side, one should use an external field of almost half of the breakdown field, i.e., V = ηVb ∼ ηEb (0 < η < 1).
The dielectric spectra as a function of frequency indicate that the slow charge storage and slow discharge capacity in any dielectric capacitor are mainly due to interfacial or space charge polarization which occurs at the 'electrode–dielectric interface, grain boundaries, near defects, voids and/or oxygen defects. To get rid of the space charge effect on the charge–discharge behavior of the capacitor, energy storage capacity, dielectric saturation and polarization measurements can be carried out above 1 kHz. For high power and high energy applications (grid level or transport) near MHz frequency is important where the ionic, dipolar and electronic modes are the most important entities [15, 16].
For quite some time, superlattices (SLs) have been considered as one of the top material science constructs for in depth research within the scientific community. Their properties are often extreme because they are constructed of alternating layers of different polar and non-polar perovskite oxides such as BaTiO3 (BT), SrTiO3 (ST), LaAlO3 (LAO) and PbTiO3 (PT) [17–22]. The physical and functional properties of these SLs are different from the parent materials and this may be due to changes in the unit cell, stress–strain and the lattice mismatches across the interface between the layers and/or at the film–substrate interface. These SLs have shown several extreme properties, among them several discoveries are improper ferroelectricity, 2D electron gas between the SL layers, superconductivity, high polarization and low loss compared to the parent layers, folded acoustic phonon, stress induced ferroelectricity, phonon softening, novel physics, artificial crystal structure, self-developed exchange bias, etc.
In the long list of discoveries related to SLs, we would like to present one more discovery that relates the high energy density capacity and breakdown strength BT/Ba(1−x)SrxTiO3 (BST) with a constant periodicity of ∼80 Å and a total stack height of 6000 Å (0.6 μm). The nature of the dielectric response suggests a relaxor ferroelectric, i.e. 50 K nonlinear shift in the dielectric maximum temperature with change in probe frequency. We have measured the energy density and breakdown strength of BT/BST SLs from the P–E loop (>1 kHz), C–V loop (>1 kHz) and temperature dependent I–V characteristics; they provide a very high breakdown field (5.8–6.0 MV cm−1) and energy density (12.24–46.19 J cm−3). All these measurements were carried out at high frequency in order to avoid the participation of the space charge effect and electrode–electrolyte interfacial charge that generally slow down the fast discharge properties of capacitors. It was a commonly held belief in scientific communities that only high-k materials can have a high breakdown field. We have observed for the first time that high dielectric constant relaxor-ferroelectric (>100) materials sustain a very high breakdown field which opens a new field for high energy density capacity research.
2. Experimental details
BT/Ba0.30Sr0.70TiO3 (BT/BST) SLs having a constant modulation period of Λ = 80 Å were grown on a (001) MgO substrate by pulsed laser deposition. The stacking periodicity Λ/2 was precisely maintained by controlling the number of laser shots; the total thickness of each SL film was ∼6000 Å = 0.6 μm. An excimer laser (KrF, 248 nm) with a laser energy density of 1.5 J cm−2, pulse repetition rate of 10 Hz, substrate temperature 830 °C and oxygen pressure of 200 mTorr was used for SL growth. The details of the structural characterization such as orientation, phase purity and surface morphology were obtained using x-ray diffraction (XRD), polarized Raman spectra and atomic force microscopy (AFM) (Veeco) of SL samples synthesized in similar conditions and the results were presented in [22, 23]. The breakdown field, dielectric saturation and ferroelectric hysteresis were obtained utilizing a Keithley electrometer, an HP4294 impedance analyzer and a radiant tester respectively. All these electrical measurements were in the metal–insulator–metal (MIM) configuration with Pt as the top electrode with an area of ∼10−4 cm2 and conducting La0.67Sr0.33MnO3 as the bottom electrode. The details of the growth and characterization techniques are published elsewhere [22, 23].
3. Dielectric constant and polarization under temperature and electric field
BT/BST SLs exhibit exceptionally high electric field stress sustainability capacity over a wide range of frequencies and temperatures. Figure 2(a) demonstrates the low frequency dependent polarization (P)–electric field (E) data that indicate well-saturated slim hysteresis with an in-built electric field for the as grown samples. As we increase the probe frequency, the hysteresis seems to be fatter and shifted towards the center. This may be due to in-built polarization in the SL structure; with increase in probing frequency, the in-built polarization starts to oppose switching of the polarization which in turn means that a higher coercive field is required to switch the polarization, hence fatter and more centered polarization. Still this explanation is not widely accepted and further requires extensive research on these issues. Maxwell–Wagner space charge is always an important factor for such behavior; however, the experimental facts are opposite in nature. Recently, it has been demonstrated that the in-built electric field in epitaxially grown thin films is good for MEMS application with high functional properties [24]. High dielectric saturation/tunability is one of the weak characteristics of the ferroelectric materials which restrict their utilization as high power capacitors. To get exact dielectric saturation in the SL system, a capacitance–electric field (C–E) measurement was carried out (see figure 2(b)). The dielectric saturation is calculated using the equation [3]

where ε(0) and ε(E) are the dielectric constant at zero and applied electric field E, respectively.
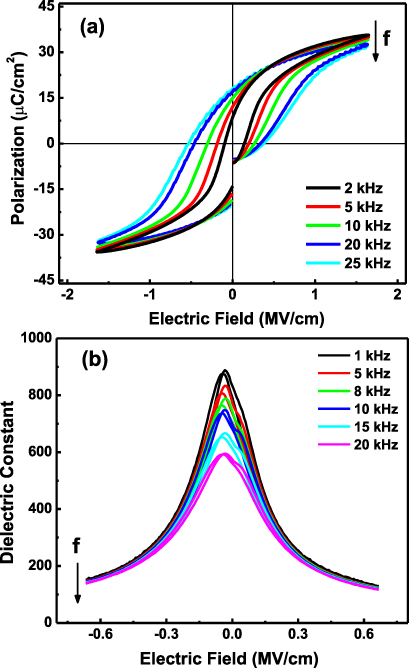
Figure 2. Room temperature (a) ferroelectric hysteresis loops measured at 1.65 MV cm−1 at different frequencies and (b) dielectric constant versus bias electric field curves recorded for various frequencies from BT/BST SLs.
Download figure:
Standard imageIt was found that this SL structure gave almost 70–80% dielectric saturation depending upon the probe frequency; it was also observed that after 0.5 MV cm−1 applied field the SL dielectric constant became saturated; however, we have made an extrapolation of the P–E and C–E data to get exact and accurate energy densities; these values can be seen in table 1. The dielectric constant and loss tangent response as a function of temperature for various frequencies are given in figure 3. Figure 3(a) shows a very high dielectric constant (700–1000), shifting of the dielectric maximum temperature (Tm) ∼ 50 K towards the higher temperature side with increasing probe frequency, dielectric dispersion below Tm and a complete merger of the frequency dependent dielectric dispersion above Tm similar to normal ferroelectric relaxors. Similar frequency dependence was observed in the loss tangent as is shown in figure 3(b). We fitted the Tm of the dielectric spectra with a nonlinear Vogel–Fulcher (VF) relation (equation (4)) as shown in the inset of figure 3(a) [25–27],

where f is the experimental frequency, f0 is the the pre-exponential factor, Ea is the the activation energy, kB is the the Boltzmann constant and Tf is the static freezing temperature. From the nonlinear fitting of the real part of the dielectric data (inset to figure 3(a)) we found Ea = 0.02 eV,f0 = 1 × 10⁸ Hz and Tf = 300 K; the determined parameters are in good agreement with those reported for other relaxors. Similar relaxor behavior in Ba0.8Sr0.2TiO3/Ba0.2Sr0.8TiO3 SL was observed by Gregg's group [28, 29]; they studied this system both theoretically and experimentally, and their results suggest that the interface effect between dielectric and ferroelectric layers plays an important role in the dielectric properties of the SL; effects like enhancement of the dielectric constant and the broad temperature dependence of the dielectric peaks can be explained in terms of the Maxwell–Wagner (MW) model. Our group also observed the MW space charge effects in PZT/CFO multilayers with a very high shift in dielectric constant and lower maximum temperature with increase in probing frequency [30]. Here the situation is surprisingly different, for example, the Tm shift is around 50 K, there is a high dielectric loss for high frequency (a kind of fingerprint for relaxor behavior) and the ferroelectric hysteresis is well defined with increase in probe frequency which favors the in-built polarization effect rather than space charge effects.
Table 1. The energy density calculated from different dielectric constant values (Uε1) at fixed E = 5 MV cm−1 and Uε2 calculated from different electric fields at fixed ε = 160, and the energy density calculated from the P versus E curve (UP) at different electric field values.
| Dielectric constant (ε) | Energy density
 (J cm−3)
(fixed E = 5 MV cm−1) (J cm−3)
(fixed E = 5 MV cm−1) |
Electric field (E) (MV cm−1) | Energy density
 (J cm−3)
(fixed ε = 160) (J cm−3)
(fixed ε = 160) |
Energy density UP = ∫E dP (J cm−3) |
|---|---|---|---|---|
| 50 | 55.33 | 1.65 | 19.28 | 12.24 |
| 100 | 110.67 | 3 | 63.75 | 22.79 |
| 160 | 177.08 | 5 | 177.08 | 46.19 |
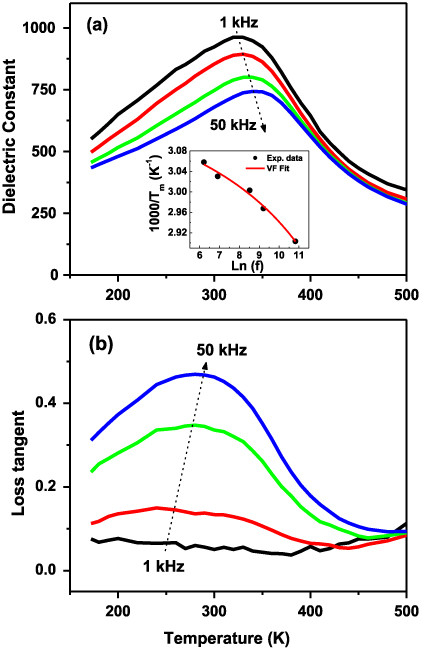
Figure 3. Temperature and frequency dependent (a) dielectric constant and (b) loss tangent of BT/BST SLs. The inset of figure 3(a) shows the nonlinear Vogel–Fulcher fit of the dielectric data.
Download figure:
Standard image4. Determination of the energy density from the P–E loop
It is interesting to have a close look of all the different kinds of dielectric materials and their energy density capacity from the model P–E loop. Figures 1(a)–(d) represent the common P–E responses of linear dielectric, ferroelectric, antiferroelectric and relaxor/relaxor-ferroelectric materials. Note that the relaxor materials have both nonlinear and linear P–E regions, the nonlinear ferroelectric region followed by the linear dielectric saturated region at extremely high field. The combination of nonlinear and linear P–E loops in the first quadrant of the hysteresis is a really good feature of high energy storage devices with fast discharge capacity.
BT/BST SLs show very slim asymmetric hysteresis with an in-built electric field (as grown samples) for frequencies <1 kHz, whereas with increase in probe frequency and away from the space charge regions, they become more symmetric and centered as seen in figure 2(a). A very high electric field (≧1.65 MV cm−1) was utilized to get the energy density of the SLs; the energy density was calculated using the integral  ; the upper portion of the hysteresis area provides almost 12.24 J cm−3 (see the blue curve and the gray shaded area in figure 4). We did not utilize higher voltage to get the energy density from the P–E loop due to experimental limitations (high frequency and high voltage). BT/BST SLs show extremely low leakage current density (<1 mA cm−2) under high electric field (3–4 MV cm−1) without breakdown (see figure 6). We extrapolate the linear part of the P–E loop and calculate the energy density up to 5 MV cm−1 electric field (for η = 0.75); this maximum electric field value was chosen for the extrapolated data; since the current density versus electric field data (figure 6) show that the breakdown field is above 5 MV cm, the extrapolated data provide almost 46 J cm−3 (see the red curve and the light blue shaded area in figure 4). The real and extrapolated energy densities can be seen from the shaded area of the P–E loop of figure 4. The energy density as a function of applied field for different frequencies is given in the inset of figure 4 and suggests extremely high potential to store the energy density.
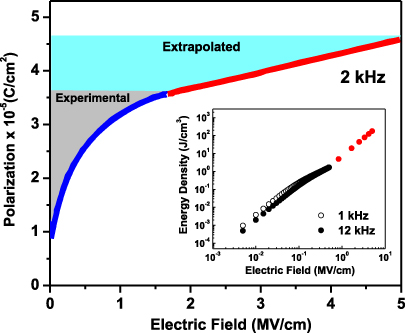
Figure 4. The shaded area of the polarization–electric field loop represents the real (blue curve and gray shaded area) and extrapolated (red curve and light blue shaded area) energy densities of the BT/BST SLs. The inset shows the energy density as a function of the applied field for different frequencies; the red dots show the extrapolated data.
Download figure:
Standard imageIt is unlikely that high energy density will be obtained with high dielectric constant and low applied field; in the previous report, in most of the cases the energy density calculated for the P–E loop was obtained from low frequency data. In this case, the discharge capacity with very slow carriers, space charge and interface-related mobile carriers will dominate on the P–E loop.
Figure 5(a) presents the P–E loops measured at different electric fields under 2 kHz at room temperature. The inset of figure 5(a) shows a slim and well defined loop for the 80–100 V applied to the LSMO/(BT/BST)/Pt capacitor. Using these data the discharge (release) (Ud), and charge (Uc) (storage) energy densities were calculated using the following relation:

Areas I and II correspond to the yellow and gray shaded areas respectively in figure 5(b). The Ud and Uc densities as a function of electric field are shown in the inset to figure 5(b). It was found that all the energy densities calculated for BT/BST SL capacitors increase with the electric field. In particular, Ud was found to increase with electric field from 6 J cm−3 at 0.8 MV cm−1 to 12 J cm−3 at 1.66 MV cm−1. A similar value of discharge energy density (9 J cm−3 at 4 MV cm−1) was reported for P(VDF–TrFE–CFE) 58.3/43.3/7/5 mol% by Chu et al [2]. The charge–discharge efficiency (η) of the capacitors was calculated using the relation η = Ud/Uc × 100%; the efficiency of the BT/BST SL varied from 59 to 67% at maximum applied voltages of 0.8 and 1.66 MV cm−1 respectively. A similar range of efficiency was found for poly(vinylidene fluoride–hexafluoropropylene) (PVDF–HFP). For application, the efficiency of a high energy density capacitor is an essential parameter to avoid damage in the capacitor [31].
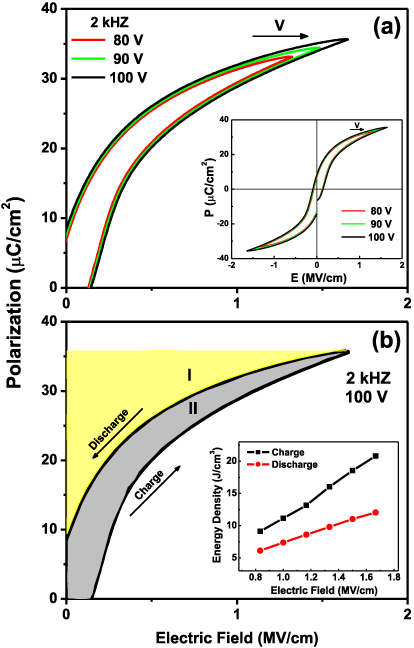
Figure 5. (a) The charge–discharge cycle of the BT/BST SL capacitor at different electric fields. The inset shows the P–E loops of the BT/BST SL at different electric fields. (b) The charge–discharge cycle of BT/BST SLs at 2 kHz and the related electrical energy densities: area I (yellow shaded area) corresponds to the discharged or released energy density and area II (gray shaded area) is the energy loss density. The inset shows the dependence of the charge, discharge and loss energy densities as a function of the electric applied field for the BT/BST SL.
Download figure:
Standard image5. Current (I)–voltage (V) characteristics
In order to check the breakdown strength of the BT/BST SL, we examined the I–V characteristics over a wide range of temperature and applied electric field. It can be seen from figure 6 that the SL shows a very low leakage current density (∼4–38 mA cm−2) at 5 MV cm−1. The breakdown strengths on both electrodes (Pt and LSMO) were observed to be similar; however, the leakage current densities were less than 4 mA cm−2 along the LSMO side and 38 mA cm−2 along the Pt side at 5 MV cm−1. The aforementioned current density at 5 MV cm−1 is quite impressive compared to the existing data from the literature on high energy density capacitors [4]. All energy density calculations were carried out below 5 MV cm−1. The LSMO electrode looks to be more efficient compared to the Pt electrode; the effect of electrodes on the breakdown strength is under investigation. For real device applications, these capacitors should be robust to at least ±50 K near room temperature. The wide range temperature dependent I–V characteristics of the devices are shown in figure 7. It can be easily observed that there is only a one to two order of magnitude enhancement in the current density with increase in temperature up to 350 K. This indicates that the energy density can be robust over ambient temperature. The leakage current behavior of the SL structures was modeled with different leakage current mechanisms; it was found that none of the leakage mechanisms, i.e., Schottky emission, Poole–Frenkel emission or space charge limited conduction (SCLC), fitted well with the experimental I–V data over a wide range of voltage [32–36]. Only at high electric voltage does the log–log plot of the I–V curve fit linearly over a small interval of electric field (50–70 V). The fact that the slope of the I–V curves increases with increase in applied voltage from 2.1 to 3.9 supports the SCLC mechanism. This general behavior is presented more clearly in the inset to figure 5 at 300 K. This voltage dependent current behavior generally fitted well with the trap modified SCLC conduction mechanism.
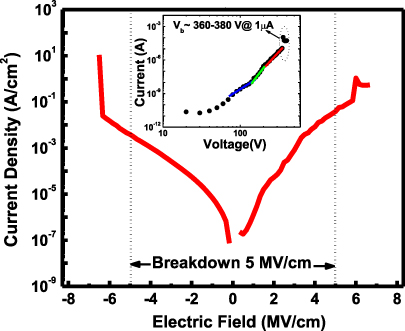
Figure 6. The current density versus electric field of the BT/BST SL shows that the breakdown electric field is ∼5 MV cm−1. The inset shows the space charge limited conduction (SCLC) mechanism.
Download figure:
Standard image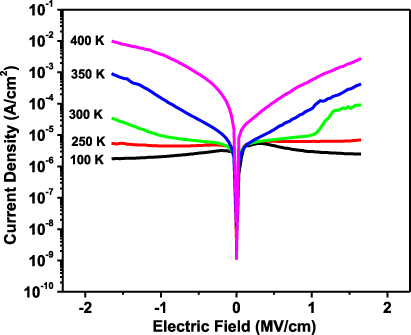
Figure 7. The temperature dependence of the current density versus the electric field of the BT/BST SL.
Download figure:
Standard image6. Conclusions
We have demonstrated the energy density and breakdown strength of high quality relaxor-ferroelectric superlattices. These SLs obey the basic nature of relaxor ferroelectrics such as dielectric dispersion and their merger below and after Tm, respectively, nonlinear V–F relation and low dielectric loss with frequency dispersion. As grown samples show asymmetric polarization hysteresis (a normal feature of SLs) with in-built electric field below (<1 kHz) which is more symmetric and centered with increase in frequency. A high dielectric constant and dielectric saturation (70–80%) were also observed. The upper area of the P–E loops provides high energy density (>12.24 J cm−3) which is well supported by direct measurements. The J–E characteristics illustrate a very high breakdown field (∼5.8–6 MV cm−1) with low leakage current density (10–35 mA cm−2); utilization of the breakdown field (5 MV cm−1) and extrapolation of the P–E and C–E loops indicate that the system possesses a very high potential to store the energy density (∼46 J cm−3). The above experimental facts rule out the earlier mythology that only high-k (<100) dielectrics will be suitable for high power energy applications. This kind of relaxor-ferroelectric superlattice possesses both nonlinear (dielectric saturation part) and linear (saturated dielectric part) regions in the P–E curve that can be helpful to the design of new kinds of high energy density dielectrics capable of both high power and energy density applications.
Acknowledgments
This work was supported by NSF-EFRI-RPI-1038272 grant. One of the authors (N Ortega) is also thankful to the DOE-DE-FG02-08ER46526 for financial support.