

Abstract
The pressure-driven collapse in the structure of network-forming materials will be considered in the gigapascal (GPa) regime, where the development of in situ high-pressure neutron diffraction has enabled this technique to obtain new structural information. The improvements to the neutron diffraction methodology are discussed, and the complementary nature of the results is illustrated by considering the pressure-driven structural transformations for several key network-forming materials that have also been investigated by using other experimental techniques such as x-ray diffraction, inelastic x-ray scattering, x-ray absorption spectroscopy and Raman spectroscopy. A starting point is provided by the pressure-driven network collapse of the prototypical network-forming oxide glasses B2O3, SiO2 and GeO2. Here, the combined results help to show that the coordination number of network-forming structural motifs in a wide range of glassy and liquid oxide materials can be rationalised in terms of the oxygen-packing fraction over an extensive pressure and temperature range. The pressure-driven network collapse of the prototypical chalcogenide glass GeSe2 is also considered where, as for the case of glassy GeO2, site-specific structural information is now available from the method of in situ high-pressure neutron diffraction with isotope substitution. The application of in situ high-pressure neutron diffraction to other structurally disordered network-forming materials is also summarised. In all of this work a key theme concerns the rich diversity in the mechanisms of network collapse, which drive the changes in physico-chemical properties of these materials. A more complete picture of the mechanisms is provided by molecular dynamics simulations using theoretical schemes that give a good account of the experimental results.
Export citation and abstract BibTeX RIS

Content from this work may be used under the terms of the Creative Commons Attribution 3.0 licence. Any further distribution of this work must maintain attribution to the author(s) and the title of the work, journal citation and DOI.
1. Introduction
Network structures are at the heart of many glassy and liquid materials that have widespread importance, where examples include the glasses used in photonics and other technologies [1–7], silicates in geophysics [8, 9], and water in chemical processes and biological systems [10, 11]. A prerequisite for understanding the physico-chemical behaviour of these materials is knowledge about their atomic-scale structure. For example, the compressibility and transport properties (e.g. viscosity, diffusion coefficients, thermal conductivity) will depend on the network connectivity and how this responds to (i) changes in state variables such as the pressure and temperature and (ii) the incorporation of additional elements. The structure of disordered materials may change gradually when a state variable such as pressure P is varied, or abruptly as in so-called polyamorphic transformations [12–14]. For glass, the structure may also be influenced by the route taken e.g. whether the material is cold-compressed, shock-compressed or formed by quenching from a high-pressure liquid.
Neutron diffraction is a powerful tool for helping to solve the structure of amorphous and liquid materials [15–21]. In consequence, there have been several investigations of disordered materials under pressure, including water [22–24], ionic solutions [25] and liquid deuterium chloride [26] using Ti–Zr pressure cells up to ≃0.6 GPa, and molten salts using more specialist apparatus at high temperatures and pressures up to 0.5 GPa [27]. Neutron diffraction has not, however, been extensively used in the investigation of glassy and liquid materials at higher pressures owing to the experimental challenges involved: There is a need to measure with good counting statistics the diffraction pattern for a small sample that is free from artifacts associated with scattering from the gasket used to contain the sample, and from the anvils of a high-pressure press.
In this topical review, particular attention will be given to the recent development of in situ high-pressure neutron diffraction methods to investigate structurally disordered materials in the gigapascal (GPa) pressure regime, where extensive use is made of a Paris-Edinburgh press [28–31]. Indeed, it is now possible to extract site-specific information on the structure of disordered materials by using the method of neutron diffraction with isotope substitution [32, 33]. A starting point will be provided by the structural changes that occur under cold compression (i.e. pressurisation at constant temperature) in the prototypical network-forming glasses B2O3 [34], SiO2 [35] and GeO2 [32, 36, 37]. At ambient conditions, the network of B2O3 is based on corner-sharing planar BO3 triangles, and therefore has a different topology to the networks of SiO2 and GeO2 that are based on corner-sharing AO4 (A = Si or Ge) tetrahedra [38]. There are also differences between the topologies of these tetrahedral glasses, as measured e.g. by the ring-size distributions, that originate from different mean inter-tetrahedral A–O–A bond angles (≃151° for SiO2 [39] as compared to ≃132° for GeO2 [40]). The structural changes that occur under cold compression in the archetypal chalcogenide glass GeSe2 will also be considered where, in contrast to its oxide counterparts, the network at ambient conditions includes both edge-sharing and corner-sharing tetrahedra along with a significant fraction of homopolar (like-atom) bonds [41, 42]. In the case of GeSe2, conventional neutron and x-ray diffraction experiments yield essentially the same structural information, but site-specific information can be provided by using the method of neutron diffraction with isotope substitution [33].
The information that neutron diffraction provides on glassy and liquid materials is complementary to that obtained from other in situ high-pressure experimental techniques, as will be emphasised by the case examples that will be considered. These techniques include x-ray diffraction [43–47], Raman spectroscopy [48, 49], inelastic x-ray scattering (also known as x-ray Raman spectroscopy) [47, 50], and x-ray absorption spectroscopy (XAS), where the latter involves both the x-ray absorption near-edge structure (XANES) and extended x-ray absorption fine structure (EXAFS) methods [47, 51–53]. There have also been several in situ investigations on the high-pressure dependence of the low frequency dynamics in network-forming glasses, where the vibrational density-of-states is characterised by a 'boson peak' i.e. an excess of states above the Debye level for acoustic waves [54–59]. The relation or otherwise of this feature to various disorder-related properties remains the subject of debate [60]. Although nuclear magnetic resonance (NMR) methods have provided a wealth of information on glass structure at ambient conditions, it has proved challenging to employ in situ NMR methods to look at the structure of glass under pressure. Some progress is, however, now being made with e.g. the development of an NMR probe that can operate at pressures up to 2.5 GPa [61]. All of the information provided by experiment can be used inter alia to test the results obtained from molecular dynamics simulations. In turn, once an appropriate theoretical scheme has been found for the atomic interactions, these simulations can be used to establish a more complete overview of the pressure-driven mechanisms of network collapse [62–66].
For completeness, we note that there is also an interest in permanently densified glass recovered from extreme conditions [67–72]. For instance, because a liquid can explore localities on an energy landscape that are inaccessible to the crystalline state, the structure of the glass recovered from a compressed high-temperature melt may give information on atomic configurations of the melt that is not accessible from crystallography. There are, however, pitfalls for the unwary e.g. the structure of a 'fragile' network-forming glass may be very different to that of the high-temperature liquid from which it was quenched [73]. In general, permanent densification will change the physico-chemical properties of a glass. It may therefore be possible to obtain technologically relevant glassy materials via high-pressure processing [74].
The manuscript is organised as follows. A summary of diffraction theory is given in section 2, and the high-pressure setups used for typical neutron diffraction experiments on glasses and liquids in the gigapascal (GPa) pressure range will be introduced in section 3. The methods required to analyse high-pressure neutron diffraction data will be summarised in section 4. The pressure-induced structural transformations of several key network-forming materials will then be described, starting with the oxide glasses B2O3 (section 5), SiO2 (section 6) and GeO2 (section 7). The role played by the oxygen-packing fraction in governing structural changes to the network-forming motifs in glassy and liquid oxide materials will be discussed in section 8 [74]. The pressure-induced structural transformations in glassy GeSe2 will then be considered in section 9, before continuing in section 10 with a description of high-pressure neutron diffraction as applied to other disordered materials. Finally, a summary will be given in section 11, and future perspectives will be considered.
2. Diffraction theory
In a neutron or x-ray diffraction experiment on a glass or liquid, the information on its structure can be represented by the total structure factor [20]

In this equation, α and β denote the chemical species, cα represents the atomic fraction of chemical species α, fα(k) and
 are the form factor (or bound coherent scattering length) for chemical species α and its complex conjugate, respectively, k is the magnitude of the scattering vector, and Sαβ(k) is a Faber-Ziman [75] partial structure factor where Sαβ(k) = 394Sβα(k). Sαβ(k) takes a limiting value Sαβ(k → ∞) = 1, and is related to the partial pair-distribution function gαβ(r) via the Fourier transform
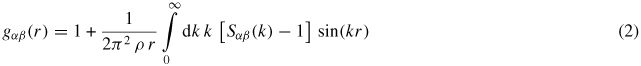
where ρ is the atomic number density and r is a distance in real space. The mean coordination number of atoms of type β, contained in a volume defined by two concentric spheres of radii ri and rj centered on an atom of type α, is given by

In a neutron diffraction experiment in which the scattering is from atomic nuclei alone and the incident neutron energy is not close to a nuclear resonance energy so that absorption cross-sections are small, the scattering lengths can be treated as real k-independent numbers that are usually represented by the symbol bα. This scenario holds for all of the neutron diffraction work reported in this review. In an x-ray diffraction experiment, however, the k-dependence is important, and in order to remove the associated slope and improve the resolution of peaks in the corresponding real-space function, the total structure factor is often re-written as

where <f(k)> = ∑αcαfα(k) is the mean form factor. For neutron diffraction experiments, the mean coherent scattering length <b> = ∑αcαbα replaces <f(k)> in equation (4). The corresponding real-space information is represented by the total pair-distribution function G(r) as obtained from the Fourier transform relation
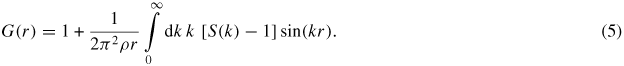
For neutron diffraction, equation (5) becomes

The corresponding expression for x-ray diffraction is, however, more complicated because the x-ray form factors are k-dependent. A means of removing this form-factor effect and extracting coordination numbers from a measured x-ray G(r) function is described in [76]. At r-values smaller than the distance of closest approach between the centres of two atoms gαβ(r) = gαβ(r → 0) = 0 such that G(r) = G(r → 0) = 0.
In an experiment, a diffractometer can only access a finite k-space range with a maximum cutoff value kmax such that S(k) is truncated by a modification function M(k) where M(k) = 1 for k ⩽ kmax and M(k) = 0 for k > kmax. Equation (5) for the total pair-distribution function is then re-written as
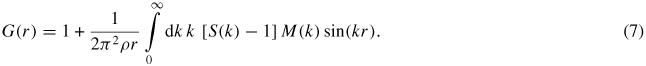
In general, S(k) will show oscillations at kmax such that equation (7) leads to a convolution of the desired structural information (as given for neutron diffraction by equation (6)), with the Fourier transform of M(k). The severity of the resultant Fourier transform artifacts, which can be large when using a step function for M(k), can be reduced by using instead a Lorch [77] function, albeit at the expense of a broadening of r-space features. The Lorch function is defined by M(k) ≡ sin (ak)/(ak) for k ⩽ kmax, a = π/kmax, and M(k) = 0 for k > kmax where a rigorous derivation is given in [78]. To facilitate a like-for-like comparison between measured and molecular dynamics results, the reciprocal-space functions constructed from simulations can be Fourier transformed according to equation (7) using the same M(k) function that was applied to the experimental data.
For a binary system, the total structure factor of equation (1) can also be written in terms of the Bhatia–Thornton [79] number–number, concentration–concentration and number–concentration partial structure factors, denoted by
 ,
,
 and
and
 , respectively, where

In this formalism, the number density fluctuations as represented by
are separated from the concentration fluctuations as represented by
, and their cross-correlation is represented by
. These partial structure factors give information on the topological and chemical ordering in a system, as discussed for network glass-forming materials in [21, 38, 80]. In the case when the imaginary part of fα(k) can be neglected and fα(k) = fβ(k) then
![$F(k) = \left<f(k)\right>^2\left[S_{\rm NN}^{\rm BT}(k)-1\right]$](https://content.cld.iop.org/journals/0953-8984/27/13/133201/revision1/cm509082ieqn005.gif) or
or
 , i.e. the number–number partial structure factor would be measured directly in a diffraction experiment. It follows that, because an incident neutron or x-ray cannot distinguish between the scattering centres,
contains no information on the chemical ordering: All of the nuclei look alike. The Fourier transform of
, denoted by
, i.e. the number–number partial structure factor would be measured directly in a diffraction experiment. It follows that, because an incident neutron or x-ray cannot distinguish between the scattering centres,
contains no information on the chemical ordering: All of the nuclei look alike. The Fourier transform of
, denoted by
 , therefore gives information on the relative distribution of pairs of scattering particles but cannot distinguish between them, i.e. information is gained on the topological ordering. An example of this scenario will be considered in section 9 for the case of glassy GeSe2. In comparison, if <f(k)> = 0 then
would be measured directly in a diffraction experiment. The Fourier transform of
, denoted by
, therefore gives information on the relative distribution of pairs of scattering particles but cannot distinguish between them, i.e. information is gained on the topological ordering. An example of this scenario will be considered in section 9 for the case of glassy GeSe2. In comparison, if <f(k)> = 0 then
would be measured directly in a diffraction experiment. The Fourier transform of
, denoted by
 , gives information on the chemical ordering, i.e. on the occupancy by α and β atoms of the sites described by
. An example of such a material, namely the Ti–Zr alloy used in high-pressure neutron diffraction experiments, is given in section 4.4.
, gives information on the chemical ordering, i.e. on the occupancy by α and β atoms of the sites described by
. An example of such a material, namely the Ti–Zr alloy used in high-pressure neutron diffraction experiments, is given in section 4.4.
In general, the total structure factor F(k) of equation (1) or (8) measured for a binary system will comprise three overlapping partial structure factors. The complexity associated with these overlapping correlation functions can, however, be reduced by using the method of neutron diffraction with isotope substitution or by using anomalous x-ray scattering [20, 21, 81, 82]. The method of in situ high-pressure neutron diffraction with isotope substitution has now been applied to the investigation of two glasses at pressures up to ≃8 GPa, namely GeO2 and GeSe2 [32, 33]. The method gives site-specific information on the coordination environment of each of the chemical species in the glass, and the details will be explained in section 7.1 for glassy GeO2 and in section 9.1 for glassy GeSe2.
In the following, the total structure factors and pair-distribution functions will be denoted by SN(k) and GN(r) in the case of neutron diffraction, or by SX(k) and GX(r) in the case of x-ray diffraction.
3. High-pressure neutron diffraction setups
The neutron diffraction experiments reviewed in this article all employed a Paris-Edinburgh press [28–31], with anvils having either a single or double toroid profile so that a sample at pressure can be supported by an annular gasket arrangement [83]. The maximum working pressure depends on the choice of profile and anvil material e.g. cubic BN anvils with a single toroid profile are often used for work at pressures up to ∼8 GPa while sintered diamond anvils with a double toroid profile are often used for work at pressures up to ∼17.5 GPa [31]. These pressures are generally set below the breakage point of the anvils because there is a significant contribution to a measured diffraction pattern from scattering by the anvils and by the shielding attached to them. It is therefore desirable to recover anvils intact to ambient conditions to ensure that they can be re-employed, thus enabling the background scattering to be reproduced for the different measurements that are needed to complete a high-pressure diffraction experiment on a glassy or liquid material (section 4).
Since pressure is defined in terms of the applied force per unit area, the sample size is necessarily small in high-pressure neutron diffraction experiments. For double and single toroid anvils using standard gaskets, the sample takes the shape of a cylinder with a spherical cap placed on each planar face and, at ambient pressure, the sample volumes are ≃33.7 and ≃91.2 mm3, respectively. The geometry in a diffraction experiment means, however, that scattering from the caps is not observed (section 3.1). In consequence, the observed sample volume for double and single toroid anvils using standard gaskets is reduced to ∼20.1 and ∼45.2 mm3, respectively, i.e. either 2.5% or 6% of the sample volume in a typical diffraction experiment at ambient conditions (assuming a cylindrical container of 5 mm diameter and 40 mm height). At the highest pressures the observed sample volume is again smaller by a factor of ∼4. The sample volume for the encapsulated gaskets employed with single toroid anvils, which can be used to hold liquid samples [84], is ≃55 mm3 at ambient pressure.
In the interest of optimising the counting statistics, it is not desirable to collimate a neutron beam so that it can be separately focussed on the sample and on a pressure calibration standard, as in high-pressure synchrotron x-ray experiments where the incident flux is orders of magnitude higher than in neutron scattering experiments. However, if in a neutron diffraction experiment a pressure calibration standard is incorporated with the sample, the measured diffraction pattern will contain an unwanted contribution from that standard. It is therefore necessary to construct calibration curves for the load applied to a press versus the pressure at the sample position [36, 37]. Calibration curves for the single toroid anvil profile are given in figure 1 for both standard and encapsulated [84] gaskets. A calibration curve for the double toroid anvil profile is given in figure 2. It should be noted that, if a pressure transmitting medium is incorporated with a sample to promote hydrostatic conditions, the scattering from this medium will contaminate the diffraction pattern measured for the sample.
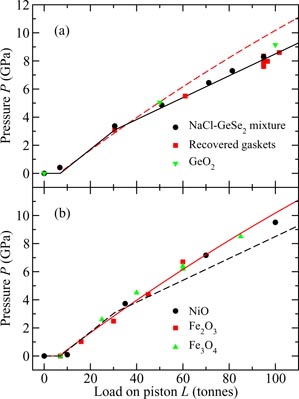
Figure 1. Calibration curve giving the load L applied to the piston of a V4 or VX5 variant PE press [31] versus the pressure P at the sample position for single toroid anvils at a temperature of ≃300 K [37]. In (a) the data points are for standard Ti–Zr gaskets and correspond to (i) a calibration run using a mixture of NaCl and glassy GeSe2 (•); (ii) measurement of the dimensions of recovered gaskets after various samples were compressed using different loads ((red) ▪) [36]; and (iii) consideration of the diamond Bragg peaks measured when various GeO2 glass pellets were compressed in sintered diamond anvils ((green) ▾). In (b) the data points are for encapsulated Ti–Zr gaskets [84] and were obtained from the diffraction patterns measured for crystalline NiO (•), Fe2O3 ((red) ▪) or Fe3O4 ((green) ▴). In (a) the solid calibration curve corresponds to the measured data points and the broken calibration curve corresponds to (b). In (b) the solid calibration curve corresponds to the measured data points and the broken calibration curve corresponds to (a).
Download figure:
Standard image High-resolution image
Figure 2. Calibration curve giving the load L applied to the piston of a V3 variant PE press [31] versus the pressure P at the sample position for double toroid sintered diamond anvils [37]. The calibration curve was deduced from (i) the diffraction patterns measured for a perovskite held in encapsulated Ti–Zr gaskets with a methanol-ethanol-water pressure transmitting medium and a MgO pressure marker (∘); (ii) the diffraction patterns measured for crystalline ice held in encapsulated Ti–Zr gaskets ((red) ▪); and (iii) a Le Bail analysis of the Bragg peaks measured for sintered diamond anvils at different pressure points when various samples, contained in standard gaskets, were compressed. For the latter, the unit cell volume to pressure conversion was made on the basis of the perovskite experiment and the data points correspond to samples of GeO2 ((blue) ▴), SiO2 ((blue) ▾) or B2O3 ((black) □) glass and crystalline vanadium ((green) •). These data points have been shifted downwards by 2 GPa but show the same P versus L behaviour as for the perovskite and ice samples, i.e. although there is an uncertainty in the absolute values of the diamond Bragg peak data points from study (iii) (e.g. the anvils in standard and encapsulated gasket experiments may not be at the same position for the same applied load) their relative values are the same as for studies (i) and (ii).
Download figure:
Standard image High-resolution image3.1. Neutron diffraction experiments
The scattering geometries associated with typical in situ high-pressure neutron diffraction experiments with a Paris-Edinburgh press are sketched in figure 3. The scattered neutrons are either (a) in the same plane as the incident beam, or (b) in a plane that is perpendicular to the incident beam, where the latter is directed along the compression axis through the anvil mounted on the breech of the press. These scattering geometries are employed when using, for example, (a) the diffractometer D4c [85] or D20 [86] at the steady state reactor source of the Institut Laue-Langevin, or (b) the time-of-flight diffractometer PEARL at the ISIS pulsed neutron source [37]. In diffraction experiments, the magnitude of the scattering vector is given by k = (4π/λ) sin θ, where λ is the incident wavelength and 2θ is the scattering angle [20]. For D4c and D20 experiments, λ is fixed and k is varied by changing 2θ. Conversely, for PEARL experiments, 2θ is fixed at ≃90° and k is varied by changing λ such that
 .
.

Figure 3. Representations of the (a) in-plane and (b) transverse scattering geometries used for in situ high-pressure neutron diffraction experiments with a Paris-Edinburgh press, showing the anvils of the press (dark shading), binding rings (light shading) and Ti–Zr gasket (intermediate shading). In (a) the incident beam of intensity I0 and the scattered beam of intensity
 are both in the same plane, such that gasket material is in both the incident and scattered beams. In (b) an incident beam of intensity I0 is directed through one of the anvils and impinges directly on the sample, and the scattered beam of intensity
is observed at a scattering angle 2θ ≃ 90°, i.e. gasket material is in the scattered beam alone. The illustrated profile is for single toroid anvils.
are both in the same plane, such that gasket material is in both the incident and scattered beams. In (b) an incident beam of intensity I0 is directed through one of the anvils and impinges directly on the sample, and the scattered beam of intensity
is observed at a scattering angle 2θ ≃ 90°, i.e. gasket material is in the scattered beam alone. The illustrated profile is for single toroid anvils.
Download figure:
Standard image High-resolution imageIf cubic BN anvils are used in the setup given in figure 3(a) with a fixed incident neutron wavelength [30], then absorption by the boron of the anvils will give a scattering geometry in which a cylindrical sample is surrounded by an annular gasket. The incident and scattered beams both lie in a plane perpendicular to the axis of the cylinder, i.e. both beams pass through the gasket material but direct scattering is not observed from the spherical caps of the sample. For this experimental setup with single toroid anvils, a pressure gradient of about 2% is found for the observed part of the sample from an x-ray diffraction experiment using a sample of crystalline NaCl at 6 GPa [87].
The setup of figure 3(b) leads to reduced anvil scattering relative to the setup shown in figure 3(a), which is advantageous when using sintered diamond anvils that can access higher pressures as compared to BN anvils. In this case, the collimation and neutron shielding leads, in a first approximation, to a scattering geometry in which a cylindrical sample surrounded by an annular gasket is illuminated by an incident beam that impinges directly on the flat face of the sample cylinder. The scattered beam is in a plane perpendicular to the incident beam, and passes through the gasket material [37].
4. High-pressure neutron diffraction data correction procedures
The diffraction theory outlined in section 2 is based on the small sample limit where neutrons (or x-ray photons) are not attenuated by the sample and there are no multiple scattering events [20]. In this case, the single scattered intensity measured for a sample containing NS illuminated scattering centres is given by

where dσ/dΩ|S is the differential scattering cross-section for the sample and a(θ) is a calibration coefficient that converts cross-sections to measured intensities. In the case of neutron diffraction experiments,

where F(k) is given by equation (1) or (8), bα,inc represents the bound incoherent-scattering length of chemical species α, and Pα(k) is a term that arises from inelastic scattering of neutrons by the nuclei of chemical species α. For heavy nuclei, the Pα(k) functions can be calculated in terms of the moments of dynamical structure factors [88, 89]. The small sample limit is not, however, met in most experiments, and for high-pressure neutron diffraction there is the added complication that the sample will be contained by a gasket within the anvils of a press. The measured data sets must therefore be corrected for beam attenuation, multiple scattering and container scattering to obtain the desired structural information. In the following, these analysis procedures will be outlined for the in-plane and transverse scattering geometries described in section 3.1.
4.1. In-plane scattering geometry
Consider a diffraction experiment that uses the scattering geometry shown in figure 3(a) where λ is fixed and the intensity of scattered neutrons is measured at a scattering angle of 2θ. Let
 denote the measured intensity for the sample S in its container C, and let
 denote the measured background intensity. Then the background-corrected intensity for the sample in its container can be written as

In this equation, IS(θ) and IC(θ) are the single scattered intensities for a bare sample and for an empty container, respectively; Ai, j(θ) (i, j = S, C) is an attenuation factor that refers to neutrons scattered in medium i and attenuated, through absorption and scattering, in medium j [90, 91]; and MSC(θ) is the multiple scattering cross-section for the sample in its container and can be calculated within the quasi-isotropic approximation [92]. Similarly, the background-corrected intensity for an empty container can be written as

where MC(θ) is the multiple scattering cross-section for the empty container. By solving equations (11) and (12), and using equation (9), it follows that
If the intensity is also measured for a piece of vanadium in the container then, because the coherent scattering length of vanadium is small (bV = −0.3824(12) fm) but its incoherent scattering length is large (bV,inc = 6.35(4) fm [93]), it follows from equation (10) that
![${\rm d}\sigma/{\rm d}\Omega|_{\rm V} \simeq b_{\rm V, inc}^2\left[1+P_{\rm V}(k)\right]$](https://content.cld.iop.org/journals/0953-8984/27/13/133201/revision1/cm509082ieqn013.gif) where PV(k) is the inelasticity correction for vanadium. Thus, the left hand side of equation (13) is known so that the vanadium measurement can be used to find the calibration coefficient a(θ) [15, 16].
where PV(k) is the inelasticity correction for vanadium. Thus, the left hand side of equation (13) is known so that the vanadium measurement can be used to find the calibration coefficient a(θ) [15, 16].
In a typical experiment, diffraction patterns are measured for (i) an un-squashed empty Ti–Zr gasket, (ii) the sample in its Ti–Zr gasket at different pressures, (iii) several empty Ti–Zr gaskets that have been recovered from different high pressures in order to estimate the gasket scattering under load, and (iv) the empty anvils with different anvil separations. To assist in the data normalisation at different pressures, where the anvils have different separations, additional diffraction patterns are also measured at ambient pressure for large and small vanadium pellets contained in un-squashed and recovered (i.e. previously squashed) Ti–Zr gaskets, respectively. For each applied load, the scattered intensity is saved at regular intervals to test the stability of the measured diffraction patterns.
In a high-pressure diffraction experiment it is not possible to measure exactly the container and background scattering at each pressure point. For instance, the geometry of an empty gasket in the press under a given applied load will not replicate that of a gasket containing a sample under the same load because the mechanical properties of the sample will affect the gasket deformation. It is therefore necessary to estimate the contribution from the gasket and background at each pressure point by the use of a suitable interpolation procedure. Drewitt et al [36] describe the implementation of one such procedure that has now been used with success in several in situ high-pressure neutron diffraction investigations of glassy materials [32–36, 76].
4.2. Transverse scattering geometry
Consider a diffraction experiment that uses the scattering geometry shown in figure 3(b) where the scattering angle is limited to a small range of values about 2θ ≃ 90° and k is varied by changing the incident wavelength λ. For this geometry the sample is illuminated directly by the incident neutron beam, and it is convenient to consider directly the k-dependence of the measured intensities. Then equation (11), which describes the background-corrected intensity for the sample in its container, can be re-written as [37]

where the calibration coefficient a(k), attenuation coefficient AS,SC(k) and multiple scattering cross-section MSC(k) are also written in terms of k. The method for calculating AS,SC(k) is given in the appendix to [37]. If the sample is replaced by vanadium then, as described in section 4.1,
such that equation (14) can be solved to find a(k). It follows that

where
 is the background-corrected intensity for the vanadium in its container,
 [1 + PV(k)] + MVC(k)}/NSAS,SC(k), NV is the number of vanadium scattering centres illuminated by the incident neutron beam, AV,VC(k) and MVC(k) are the attenuation coefficient and multiple scattering cross-section for the vanadium in its container, respectively, and X(k) = MSC(k)/NSAS,SC(k).
In a typical experiment, diffraction patterns are measured for (i) an empty Ti–Zr gasket with a small applied load, (ii) the sample in its gasket at several different pressures, and (iii) an empty Ti–Zr gasket that has been recovered from high pressure. To normalize the data sets, diffraction patterns are also measured for a piece of vanadium contained in a Ti–Zr gasket at comparable loads to the sample in order to match the sample geometry at each pressure point. For each applied load, the scattered intensity is saved at regular intervals to test the stability of the measured diffraction patterns. A full description of the measurement and data analysis protocols is given by Salmon et al [37].
It should be noted that the transverse scattering geometry as implemented by PEARL does not allow diffraction patterns to be measured in the region k ⩽ 1.55 Å−1. It is therefore desirable to extrapolate the data to small-k values before Fourier transforming into r space, which can be achieved by fitting a Lorentzian function to the measured low-k region of a data set [37]. The so-called first sharp diffraction peak (FSDP), which is a signature of atomic ordering on an intermediate length scale [94], is the lowest-k feature in the diffraction patterns of many network-forming materials and often takes a Lorentzian profile. The FSDP can usually be identified in the measured data sets at high pressures such that information from this peak is included in the fitting procedure. The efficacy of this procedure has been extensively tested for GeO2 glass by comparing the results with those obtained from independent neutron diffraction experiments that used an in-plane scattering geometry such that the full extent of the FSDP could be observed [37].
4.3. Sample in gasket versus empty gasket counting times
In a neutron (or x-ray) diffraction experiment at a central facility, access to beam time is generally limited. For a given beam time allocation, the question therefore arises as to the relative counting times for a sample in its gasket versus the empty gasket. A calculation aimed at minimising the statistical error on the measured differential scattering cross-section for the sample (equation (13)) is described elsewhere [95].
4.4. Diffraction patterns for Ti–Zr gaskets under pressure
In a neutron diffraction experiment, the total structure factor F(k) of equation (8) can be re-written as

where the neutron scattering lengths have been treated as real k-independent numbers and
 (I, J = N, C) denotes a Bhatia–Thornton [79] partial structure factor. In the case when <b> = 0 it follows that F(k) will be a constant if
![$S_{\rm CC}^{\rm BT}(k) \equiv c_\alpha c_\beta \left\{1+c_\alpha c_\beta \left[S_{\alpha\alpha}(k) + S_{\beta\beta}(k)-2S_{\alpha\beta}(k)\right]\right\}$](https://content.cld.iop.org/journals/0953-8984/27/13/133201/revision1/cm509082ieqn017.gif) = 0. This situation can be achieved in the case of a random substitutional alloy for which Sαα(k) = Sββ(k) = Sαβ(k) [80]. A gasket made from this type of alloy will not therefore contribute k-dependent structure to a measured neutron diffraction pattern. By contrast, in an x-ray diffraction experiment on the same alloy, <f(k)> ≠ 0 and Bragg peaks will be observed.
= 0. This situation can be achieved in the case of a random substitutional alloy for which Sαα(k) = Sββ(k) = Sαβ(k) [80]. A gasket made from this type of alloy will not therefore contribute k-dependent structure to a measured neutron diffraction pattern. By contrast, in an x-ray diffraction experiment on the same alloy, <f(k)> ≠ 0 and Bragg peaks will be observed.
The alloy Ti0.676Zr0.324 [31] is commonly used as the gasket material for high-pressure neutron diffraction work on glassy and liquid materials, where the composition is chosen to give a mean coherent scattering length <b> = 0: The coherent scattering lengths of Ti and Zr are −3.438(2) and 7.16(3) fm, respectively [93]. The alloy is made by a process that involves hot isostatic pressing to remove voids [31]. The material does not, however, form a perfect random substitutional alloy such that concentration fluctuations appear, e.g. there may be some preference for like-atom bonding. These fluctuations manifest themselves by k-dependent structure in the neutron diffraction pattern measured for an unsquashed gasket, and if e.g. like-atom crystallites are sufficiently large then small Bragg peaks will also be observed. The x-ray diffraction patterns measured for unsquashed gaskets generally show the formation of single crystallites with preferred orientations (Wilson Crichton, private communication). When a gasket is deformed at high-pressure, these crystallites can break-up and flow under plastic deformation. This process leads to a more homogeneous distribution of smaller crystallites, as confirmed by the x-ray diffraction patterns measured for gaskets recovered from high pressures. The neutron diffraction patterns become less structured (see figure 6 in [36]), i.e. the concentration fluctuations become less severe. The diffraction pattern for a Ti0.676Zr0.324 gasket can therefore depend on the orientation of the gasket and will, in general, change under load. This can lead to difficulties in making an accurate correction for gasket scattering, especially at low pressures [76].
4.5. Equations of state
As indicated in sections 4.1 and 4.2, it is important to know the pressure-volume (or pressure-density) equation of state in order to be able to make accurate data corrections for neutron (and x-ray) diffraction experiments. Angel [96] gives an account of commonly employed equations of state, and a description of the uncertainties on measured equation of state parameters.
The equation of state measured by x-ray diffraction for a piece of Ti0.676Zr0.324 gasket material at room temperature is shown in figure 4 [97]. The number density corresponds to the α-phase of this material at pressures <12 GPa, and to an average of the α- and ω-phases at higher pressures. The fraction of the high-pressure ω-phase was estimated to be about 10% at 12 GPa and 42% at 20 GPa. The corresponding phase transitions and equations of state for Ti [98], Zr [99] and TiZr [100] are described elsewhere.
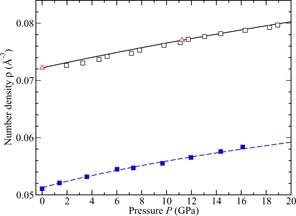
Figure 4. The pressure dependence at room temperature of the atomic number density ρ as measured for (i) the null scattering alloy Ti0.676Zr0.324 by Zeidler et al [97] ((blue) ▪) and (ii) vanadium by Nakamoto et al [101] (□) and Ding et al [102] ((red) △). The broken (blue) and solid (black) curves give third order Birch–Murnaghan equation of state fits for (i) the α-phase of Ti0.676Zr0.324 [97] and (ii) vanadium [101], respectively.
Download figure:
Standard image High-resolution imageFigure 4 also shows the equation of state for vanadium at room temperature as measured by x-ray powder diffraction (i) at pressures up to 224 GPa with either He or no pressure transmitting medium in the work by Nakamoto et al [101] and (ii) at pressures up to 76 GPa with a He pressure transmitting medium in the work by Ding et al [102]. Fits to these data sets using a third order Birch–Murnaghan equation of state gave (i) a zero-pressure isothermal bulk modulus B0 = 152.1 GPa with a first pressure derivative
 [101] or (ii) B0 = 158(1) GPa and
 [102]. Ding et al [102] also investigated the equation of state for vanadium at pressures up to 155 GPa with no pressure transmitting medium, and a fit to this data using a third order Birch–Murnaghan equation of state gave B0 = 195(3) GPa and
 . The bulk modulus of vanadium measured at ambient pressure and temperature using ultra-sonic methods is 157.12 GPa [103].
For disordered materials, the equation of state can be measured by using, for example, ultra-sonic methods [104, 105], Brillouin scattering [106, 107], optical microscopy [108], strain-gauge techniques [109, 110], x-ray absorption spectroscopy [111] and transmission x-ray microscopy [112]. It is also possible to use diffraction methods to estimate the density of glasses and liquids under high-pressure conditions [113]. As indicated by the discussion of sections 4.1 and 4.2, however, the accuracy of the results will diminish as the data corrections become more important e.g. as the sample attenuation increases.
5. Structure of B2O3 glass
B2O3 is an archetypal network glass-forming material that is an important component in industrial glasses such as Pyrex®, a boroaluminosilicate that has widespread laboratory and household use [114]. At ambient conditions, the structure of B2O3 glass is based on corner-sharing planar BO3 triangles that link to form a low-density network. In comparison, of the two known crystalline polymorphs of B2O3, the structure made from corner-sharing BO3 triangles is 41% more dense [115]. In the glass, three of the BO3 triangles can join to form a planar boroxol ring (figure 5) and, although there has been an intense debate on the fraction of boron atoms f in such rings [116–121], the majority of recent studies using a variety of techniques favour a large fraction f ∼ 0.75, where the precise value may depend on the sample preparation and thermal history [122–128]. It has proved particularly difficult, however, to model the structure of B2O3 glass with such high f-values, although this issue has now been addressed [129, 130]. For example, a first-principles molecular dynamics model with f = 0.75 [129] gives a good account of the measured (i) neutron total structure factor, (ii) 11B and 17O nuclear magnetic resonance spectra, and (iii) Raman spectra in which the boroxol ring breathing mode manifests itself by a sharp peak at 808 cm−1 [131]. The network topology of B2O3 glass is therefore very different to vitreous silica and germania where the ambient-pressure structure is based on corner-sharing AO4 (A = Si or Ge) tetrahedra. In view of this difference in topological ordering, the openness of the glass network under ambient conditions, and the observation that spontaneous crystallisation only occurs at pressures above ∼0.4–1 GPa [132, 133], there has been much interest in the density-driven transformations in B2O3 [34, 107, 126, 131, 134–153].
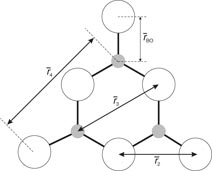
Figure 5. Schematic of a planar B3O6 boroxol group showing several of the characteristic interatomic distances. The B and O atoms are indicated by the small shaded and large open circles, respectively. The figure is adapted from Zeidler et al [34].
Download figure:
Standard image High-resolution imageB2O3 glass has been investigated under cold compression at pressures up to 9.5 GPa by using x-ray diffraction [147], up to 22.5 GPa by using boron K-edge inelastic x-ray scattering [145], and up to 17.5(5) GPa by using neutron diffraction [34]. The neutron diffraction work employed the diffractometer D4c for the pressure range from ambient to 8.2(5) GPa and the diffractometer PEARL at higher pressures. The samples were isotopically enriched with 11B because 10B has a large neutron absorption cross-section. The weighting factors for the B–B, B–O and O–O partial structure factors are 0.1868 : 0.4910 : 0.3225 for neutron diffraction (assuming a sample of 11B2O3) versus 0.0865 : 0.4152 : 0.4983 for x-ray diffraction at k = 0. Neutron diffraction therefore offers complementary information to x-ray diffraction because it is more sensitive to the boron atom correlations.
The measured SN(k) and SX(k) functions are shown in figure 6 at pressures up to 17.5 GPa and 8.5 GPa, respectively. At ambient pressure, the total structure factors show an FSDP at a position kFSDP = 1.57(2) Å−1 for SN(k) as compared to kFSDP = 1.64(2) Å−1 for SX(k), where the discrepancy in position can be attributed to the different weighting factors for the partial structure factors in neutron versus x-ray diffraction experiments [34]. As the pressure is increased from ambient to ∼8.5 GPa, the height of the FSDP reduces and there is an almost linear increase in kFSDP where the gradient is different for the neutron versus x-ray diffraction results [34]. At higher pressures it becomes difficult to discern the FSDP from the principal peak which takes a position of ≃3.2 Å−1 under ambient conditions.

Figure 6. The pressure dependence of the (a) neutron total structure factor SN(k) and (b) x-ray total structure factor SX(k) for B2O3 glass. In (a) the solid (black) curves show spline fits to the data sets measured by Zeidler et al [34] as given by the points with vertical error bars. For the experiments at pressures of 13.0 and 17.5 GPa, the region k ⩽ 1.55 Å−1 was not accessible by measurement and the solid (black) curves in this region correspond to fitted Lorentzian functions [37]. In (b) the solid (black) curves show the experimental results from Brazhkin et al [147]. In (a) and (b) the experimental results are compared to those obtained at comparable pressures from AIM molecular dynamics simulations (light solid (green) curves) [34]. The high-pressure data sets have been displaced vertically for clarity of presentation.
Download figure:
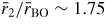
Standard image High-resolution imageThe pressure dependence of the neutron and x-ray total pair-distribution functions is shown in figure 7. The peaks in GN(r) are sharper than in GX(r) because SN(k) extends to a larger kmax value as compared to SX(k) (figure 6). For this reason, much of the following discussion on r-space features will refer to the neutron diffraction results. The first peak in GN(r) or GX(r) arises from the B–O partial pair-distribution function gBO(r). At ambient pressure, the peak position gives a mean B–O bond distance
 , and the mean B–O coordination number
 . These parameters do not change within the experimental error until a pressure greater than 6.3(5) GPa is attained (figure 8). The first peak in GN(r) is then observed to broaden asymmetrically with the appearance of a shoulder on its high-r side. For example, it takes a position of 2.36(1) Å at both 6.3(5) and 7.1(5) GPa but
 increases from 3.0(1) to 3.3(1) over this pressure range. At higher pressures, the B–O distance elongates to accommodate an increasing number of nearest-neighbour oxygen atoms such that
 = 1.42(1) Å and
 at 17.5(5) GPa. As shown in figure 8(b), the neutron diffraction results [34] tie together the x-ray diffraction [147] and inelastic x-ray scattering [145] results for the pressure dependence of
.
at 17.5(5) GPa. As shown in figure 8(b), the neutron diffraction results [34] tie together the x-ray diffraction [147] and inelastic x-ray scattering [145] results for the pressure dependence of
.

Figure 7. The pressure dependence of the (a) neutron total pair-distribution function GN(r) and (b) x-ray total pair-distribution function GX(r) for B2O3 glass. The solid (black) curves show the Fourier transforms of the measured SN(k) and SX(k) functions given by the solid (black) curves in figure 6, except at r-values smaller than the distance of closest approach between two atoms where they show the calculated GN(r → 0) = 0 or GX(r → 0) = 0 limiting values. The chained (red) curves give the Fourier transform artifacts in this small-r region. The light solid (green) curves show the Fourier transforms of the AIM SN(k) and SX(k) functions given in figure 6 where the same transform procedures were used as in the experiments [34]. The high-pressure data sets have been shifted vertically for clarity of presentation.
Download figure:
Standard image High-resolution image
Figure 8. The pressure dependence at room temperature in B2O3 glass of the mean B–O (a) bond distance
and (b) coordination number
as measured by (i) neutron diffraction (ND) [34] (▪), (ii) x-ray diffraction (XRD) [147] ((blue) ▴), or (iii) inelastic x-ray scattering (IXS) [145] ((green) ◊). In (a)
is taken from the position of the first peak in the measured total pair-distribution functions, and the results are compared to those obtained for the weighted mean position <rBO> = ∫dr r gBO(r)/∫dr gBO(r) from AIM molecular dynamics simulations (broken (red) curve with ∘ symbols) [34]. In (b) the measured
values are compared to those found from AIM molecular dynamics simulations [34] (broken (red) curve with ∘ symbols), the first-principles molecular dynamics simulations of Brazhkin et al [147] (broken (green) curve), and the empirical potential molecular dynamics simulations of both Takada [144] (solid (blue) curve) and Huang et al [107] (chained (magenta) curve). The figure is adapted from Zeidler et al [34].
Download figure:
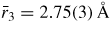
Standard image High-resolution imageAt ambient conditions, the second peak in GN(r) at
 will have contributions from the O–O distances within BO3 triangles and from the B–B distances between corner-linked triangles. If planar boroxol rings are formed from the linkage of three regular equilateral BO3 triangles as shown in figure 5, these distances will be equal such that
 [118]. From experiment, the measured ratio at ambient conditions
 and changes little over the measured pressure range [34]. The third and fourth peaks at
 and
and
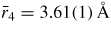 will have contributions from boron to second-neighbour oxygen distances, where in the case of boroxol ring formation
 if both atoms lie within a ring and
 if the B atom within a ring has its second-neighbour oxygen atom outside of that ring (figure 5). In general, it is difficult to distinguish between models for B2O3 glass with small (f < 0.1) and large (f = 0.75) numbers of boroxol rings on the basis of the measured pair-correlation functions alone [130]. However, if it is assumed that the third peak in GN(r) has a large contribution from boroxol rings then its disappearance at ≳13 GPa is consistent with the in situ high-pressure Raman scattering experiments of Grimsditch et al [131] where the intensity of the boroxol ring breathing mode at 808 cm−1 vanishes at a pressure ∼14 GPa (figure 9).
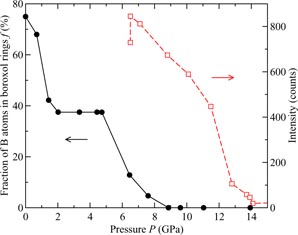
Figure 9. The pressure dependence of the fraction of boron atoms within boroxol rings f ((black) •) as obtained from AIM molecular dynamics simulations in which a boroxol-rich (f = 0.75) model for B2O3 glass at ambient pressure was cold compressed [34]. Also shown is the pressure dependence of the intensity of the boroxol ring mode ((red) □), that is positioned at 808 cm−1 under ambient conditions, as measured in the cold-compression Raman scattering experiments of [131]. In the latter, the first data point corresponds to a pressure of ∼6 GPa for which the experimental value of f is unknown.
Download figure:
Standard image High-resolution imageThe general trends found from experiment are reproduced by molecular dynamics simulations using a newly developed aspherical ion model (AIM) in which the shape of polarisable oxygen anions is allowed to change in response to their coordination environment [34]. The AIM reproduces the pressure-density equation of state as measured by Brazhkin et al [147] at pressures up to 9 GPa, an agreement that possibly extends to 18 GPa because the simulated results fall in between various extrapolations of the experimental data [34]. This ability to reproduce the measured equation of state is in contrast to previous models for B2O3 glass [107, 144, 147]. The AIM results for the neutron and x-ray total structure factors and total pair-distribution functions are compared to experiment in figures 6 and 7, respectively. The model accounts for all of the main features in the measured data sets, and supports the interpretation of the measured diffraction patterns given in the above discussion. The first peak in GN(r) is sharper than found by experiment at the highest pressures, although some of this discrepancy may result from experimental artifacts since the first peak in the GN(r) function measured by PEARL at 8.5(5) GPa is broader than the first peak in the GN(r) function measured by D4c at a comparable pressure of 8.2(5) GPa (see figure 4 in [34]).
The AIM gives a pressure dependent change to the magnitude of
that is comparable to experiment (figure 8(a)), and it also gives a better account of the measured pressure dependence of
as compared to previous molecular dynamics simulations [107, 144, 147] (figure 8(b)). The AIM molecular dynamics results for the pressure dependence of the fraction of boron atoms in boroxol rings is shown in figure 9. The model gives a progressive dissolution of boroxol rings as observed by experiment [131, 142], but overestimates the rate of this dissolution [34]. Notwithstanding, the AIM is presently the model of choice for the investigation of B2O3 and borate glasses from low to moderately high pressures.
6. Structure of SiO2 glass
Silica, or SiO2, is the canonical 'strong' network glass-forming material [154] whose high-pressure properties are often used as a reference for geophysically relevant silicates [134, 155–165]. At ambient conditions, the glass forms a chemically ordered network of corner sharing SiO4 tetrahedra [7] with an obtuse inter-tetrahedral bond angle Si–O–Si of ≃151° [39]. With increasing density, x-ray diffraction together with Raman and infrared spectroscopy experiments indicate a compaction of the network via a decrease in this Si–O–Si bond angle at pressures ≲10 GPa, followed by a gradual increase in the mean Si–O coordination number
 from four to six at higher pressures [156–158, 160–164]. It is desirable, however, to have complementary information from other structural probes in order to guide in the development of accurate atomistic models for the compaction of the glass. Neutron diffraction offers this opportunity because the weighting factors for the Si–Si, Si–O and O–O partial structure factors are 0.0694 : 0.3880 : 0.5427 for SN(k) versus 0.2178 : 0.4978 : 0.2844 for SX(k) at k = 0, i.e. neutron diffraction is more sensitive to the oxygen atom correlations as compared to x-ray diffraction.
The measured SN(k) [35] and SX(k) functions are shown in figure 10 at pressures up to 17.5 GPa and 50.6 GPa, respectively. The neutron diffraction work employed the diffractometer D4c for the pressure range from ambient to 8.2(5) GPa and the diffractometer PEARL at higher pressures. The results from PEARL show that the experimental approach of section 4.2 overcomes the major difficulties found in previous in situ high-pressure neutron diffraction work on SiO2 glass [166]. The x-ray diffraction patterns were measured by using no pressure apparatus [167], a cubic-type multi-anvil press [159], or a diamond anvil cell [163, 164]. At ambient pressure, SN(k) and SX(k) both have an FSDP at a position of 1.50(1) or 1.53(1) Å−1, respectively, whereas SN(k) has a principal peak at 2.92(1) Å−1 that is absent from SX(k). The absence of this peak can be attributed to the different weighting factors of the partial structure factors in neutron versus x-ray diffraction experiments such that, in the latter, the principal peaks in SSiSi(k) and SOO(k) cancel with the principal trough in SSiO(k) [168]. An analogous situation is also found for GeO2 glass [40]. With pressure increasing to ∼20 GPa, the FSDPs in SN(k) and SX(k) move to higher kFSDP values as the glass network compacts, while the principal peak becomes an increasingly sharp feature in SN(k) and manifests itself as a discernable feature in SX(k). At higher pressures, the FSDP in SX(k) continues its movement to higher kFSDP values whilst the principal peak becomes a more prominent feature on its high-k side.

Figure 10. The pressure dependence of the (a) neutron total structure factor SN(k) and (b) x-ray total structure factor SX(k) for SiO2 glass. In (a) the broken (blue) curve (P = 8.5 GPa) and solid (black) curves (all other pressures) show spline fits to the data sets measured by Zeidler et al [35] as given by the points with vertical error bars. For the pressure range 8.5–17.5 GPa, the region k ⩽ 1.55 Å−1 was not accessible in the experiments and the curves in this region correspond to fitted Lorentzian functions (section 4.2). In (b) the experimental results are from Inamura et al [159] (solid light (red) curves at ambient, 8.0 and 20.0 GPa); Kohara et al [167] (solid (black) curve at ambient); Benmore et al [163] (solid (black) curves at high pressure); and Sato and Funamori [164] (broken (blue) curves). In (a) and (b) the experimental results are compared to those obtained at the same or comparable pressures from TSM molecular dynamics simulations (solid light (green) curves) [35]. The high-pressure data sets have been displaced vertically for clarity of presentation.
Download figure:
Standard image High-resolution imageThe pressure dependence of the neutron and x-ray total pair-distribution functions is shown in figure 11. The first peak in GN(r) or GX(r) arises from the Si–O partial pair-distribution function gSiO(r). At ambient pressure, the peak position gives a mean Si–O bond distance
 , and the mean Si–O coordination number
 . The neutron and x-ray diffraction results from [35, 158, 163] indicate a small decrease in the Si–O distance to give
 at 17.5 GPa, followed by an increase in this distance at higher pressures (figure 12(a)). This behaviour is not mirrored by the x-ray diffraction results of Sato and Funamori [164] which give systematically larger
 values. The reason for this discrepancy is not fully understood, but may arise from radiation induced annealing in the Sato and Funamori experiments [164]. The neutron and x-ray diffraction experiments all appear to give a self-consistent picture for the pressure dependence of the Si–O coordination number which starts to increase above
 at a pressure ≳14.5 GPa, and which approaches a value
 at a pressure ≳35 GPa (figure 12(b)). The initial increase in the Si–O coordination number above its ambient pressure value is not accompanied by an increase in the mean Si–O bond length as measured by the first peak position in GN(r) or GX(r) [35, 163]. Instead, the first peak broadens asymmetrically via the appearance of a shoulder on its high-r side, as indicated by the highest pressure GN(r) functions shown in figure 11(a).

Figure 11. The pressure dependence of the (a) neutron total pair-distribution function GN(r) and (b) x-ray total pair-distribution function GX(r) for SiO2 glass. In (a) the broken (blue) curve (P = 8.5 GPa) and solid (black) curves (all other pressures) show the Fourier transforms of the spline fitted measured SN(k) functions given in figure 10(a), except at r-values smaller than the distance of closest approach between two atoms where they show the calculated GN(r → 0) = 0 limiting values. The chained (red) curves show the Fourier transform artifacts in this small-r region. In (b) the solid (black) curves show the Fourier transforms of the SX(k) functions measured by Kohara et al [167] and Benmore et al [163] with a cutoff kmax = 15 Å−1 (and also with a Lorch [77] modification function for the data from [163]), except at r-values smaller than the distance of closest approach between two atoms where they show the calculated GX(r → 0) = 0 limiting values. The chained (red) curves show the Fourier transform artifacts in this small-r region. The broken (blue) curves are the measured GX(r) functions from Sato and Funamori [164]. In (a) and (b) the solid light (green) curves show the Fourier transforms of the TSM SN(k) and SX(k) functions given in figure 10 where the same transform procedures were used as in the experiments [35]. The high-pressure data sets have been shifted vertically for clarity of presentation.
Download figure:
Standard image High-resolution image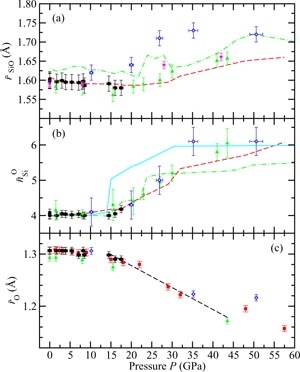
Figure 12. The pressure dependence at room temperature of (a) the mean Si–O bond distance
, (b) the mean Si–O coordination number
and (c) the mean oxygen atom radius
 for SiO2 glass under cold compression. In (a) and (b) the data sets are from (i) the neutron diffraction experiment of Zeidler et al [35] ((black) •) and (ii) the x-ray diffraction experiments of Benmore et al [163] ((green) ▴) and Sato and Funamori [164] ((blue) ◊). In (a) an additional data set is from the x-ray diffraction experiment of Meade et al [158] ((magenta) ▾). The results are compared to those obtained by molecular dynamics simulations using (i) the TSM (broken (red) curves) [35] and Beest–Kramer–Santen model (solid (cyan) curve) [172, 173] and (ii) first-principles methods (chained (green) curves) [174]. In (c)
is (i) calculated from the Si–O bond length measured in the diffraction experiments of Zeidler et al [35] ((black) •), Benmore et al [163] ((green) ▴) and Sato and Funamori [164] ((blue) ◊) by assuming regular SiO4 tetrahedra at low pressures when Si is fourfold coordinated or regular SiO6 octahedra at high pressures when Si is sixfold coordinated (section 8); and (ii) taken from
for SiO2 glass under cold compression. In (a) and (b) the data sets are from (i) the neutron diffraction experiment of Zeidler et al [35] ((black) •) and (ii) the x-ray diffraction experiments of Benmore et al [163] ((green) ▴) and Sato and Funamori [164] ((blue) ◊). In (a) an additional data set is from the x-ray diffraction experiment of Meade et al [158] ((magenta) ▾). The results are compared to those obtained by molecular dynamics simulations using (i) the TSM (broken (red) curves) [35] and Beest–Kramer–Santen model (solid (cyan) curve) [172, 173] and (ii) first-principles methods (chained (green) curves) [174]. In (c)
is (i) calculated from the Si–O bond length measured in the diffraction experiments of Zeidler et al [35] ((black) •), Benmore et al [163] ((green) ▴) and Sato and Funamori [164] ((blue) ◊) by assuming regular SiO4 tetrahedra at low pressures when Si is fourfold coordinated or regular SiO6 octahedra at high pressures when Si is sixfold coordinated (section 8); and (ii) taken from
 where
where
 is the position of the nearest-neighbour peak in gOO(r) from the TSM molecular dynamics simulations of Zeidler et al [35] ((red) ▪). The broken line shows the estimated dependence of
on pressure in the transformation from SiO4 tetrahedra to SiO6 octahedra, which starts at ≃14.5 GPa and ends between ≃35 GPa [164] and ≃43.5 GPa [163].
is the position of the nearest-neighbour peak in gOO(r) from the TSM molecular dynamics simulations of Zeidler et al [35] ((red) ▪). The broken line shows the estimated dependence of
on pressure in the transformation from SiO4 tetrahedra to SiO6 octahedra, which starts at ≃14.5 GPa and ends between ≃35 GPa [164] and ≃43.5 GPa [163].
Download figure:
Standard image High-resolution imageThe measured neutron and x-ray diffraction data are compared in figures 10 and 11 to the results obtained from molecular dynamics simulations by using the Tangney–Scandolo model (TSM) for the atomic interactions [169] which incorporates anion (dipole) polarization terms [170]. The molecular dynamics simulations [35] give a good account of the available diffraction data and also reproduce the measured pressure-density equation of state for SiO2 glass under compression [110, 160, 171]. Discrepancies between the simulation and diffraction results are comparable to those found between the measured data sets. The latter originate from the challenges associated with experiments under extreme conditions, e.g. from the difficulty in correcting for diamond anvil Compton scattering [175] and from radiation induced annealing [164]. In figure 12, the pressure dependence of the measured values for
and
is compared to molecular dynamics results using (i) the TSM [35] or Beest–Kramer–Santen model [172, 173] for the atomic interactions, and (ii) first-principles methods [174]. The TSM simulations give a good account of the density-driven changes to
and
as measured by neutron diffraction [35] and by x-ray diffraction in the work of Meade et al [158] and Benmore et al [163] at pressures up to 60 GPa. The exception is provided by the
values from Sato and Fumnamori [164] which are discussed above. The TSM simulations do not find an increase in
as taken from the position of the first peak in gSiO(r) when the Si–O coordination number first increases above
. Instead there is an asymmetrical broadening of the first peak in gSiO(r) as it develops a high-r tail, in keeping with the measured GN(r) functions [35].
The TSM molecular dynamics results for the pressure dependence of the fractions of Siα and Oα atoms is given in figure 13, where the notation Siα(α = 4, 5, 6 or 7) refers to an α-fold coordinated silicon atom and the notation Oα(α = 2, 3 or 4) refers to an α-fold coordinated oxygen atom. At pressures up to ∼10 GPa, the network is dominated by Si4 and O2 atoms and densification proceeds via a decrease in the Si–O–Si bond angle and an increase in the packing fraction of SiO4 tetrahedra. As the pressure increases, the Si–O–Si bond angle reaches a minimal value of ∼90° and
increases via the formation of higher coordinated Si atoms (figure 12(b)), where Si5 atoms dominate over the window P ∼ 25–32 GPa and Si6 atoms dominate when P ≳ 32 GPa (figure 13(a)). Fivefold coordinated Si atoms therefore play a key role in the transformation of silica from a low-pressure tetrahedral to a high-pressure octahedral glass. A small number of Si7 atoms form when P > 40 GPa. To maintain the glass stoichiometry, O2 atoms convert to higher coordinated oxygen atoms, with O3 atoms becoming dominant when P ≳ 30 GPa (figure 13(b)). X-ray Raman scattering (XRS) oxygen K-edge spectra show little change at pressures below 14 GPa and may be interpreted at higher pressures in terms of the formation of SiO5 units [174, 176]. The appearance of fivefold coordinated silicon atoms at pressures above 12 GPa has been suggested on the basis of XRS silicon L-edge spectra [177].

Figure 13. TSM molecular dynamics results for the pressure dependence in SiO2 glass of the fractions of (a) fourfold ((blue) ▴), fivefold ((magenta) ◂), sixfold ((black) ▾) and sevenfold ((orange) •) coordinated Si atoms, and (b) twofold ((red) □), threefold ((green) ◊) and fourfold ((blue) ▵) coordinated O atoms.
Download figure:
Standard image High-resolution image6.1. The 'zipper' model for ring closure events
Ring statistics offer a means for describing the network connectivity associated with the intermediate range order in network structures. In the case of SiO2 glass, the pressure dependence of the mean primitive ring size <n> ≡ ∑nℓn/∑ℓn as obtained from TSM molecular dynamics simulations is given in figure 14(a), where ℓn is the number of rings comprising a total number n of Si and O atoms. Primitive rings are those that cannot be decomposed into smaller rings [178]. The corresponding dependence of <n> on
is given in figure 14(b), and the results can be described by using a newly developed 'zipper' model for ring closure events [35] that gives

where <n0> is the mean primitive ring size at ambient pressure. The assumptions behind this model, which are supported by the TSM simulations, are (i) the network remains chemically ordered; (ii) the Si–O coordination number for each Si atom is ⩾4; (iii) a primitive ring closes to form two smaller primitive rings; and (iv) the Si–O coordination number for a given Si atom increases by unity with each ring closure event e.g. Si4 → Si5 or Si5 → Si6 but Si4 ↛ Si6 [35]. The last assumption implies that one ring closure event is necessary to convert a Si4 atom to a Si5 atom, and that two ring closure events are necessary to convert a Si4 atom to a Si6 atom.

Figure 14. (a) The pressure dependence in SiO2 glass of the mean primitive ring size <n> from cold compression (broken (red) curve with □ symbols) and quench-from-the-melt (solid (green) curve with ▵ symbols) TSM molecular dynamics simulations [35]. The inset (b) shows the same information but with
plotted against <n> where the P versus
relationship was taken from the simulations. In each panel the solid (black) curve gives the prediction of the ring closure model.
Download figure:
Standard image High-resolution imageFigure 15 illustrates two ring closure events in the zipper model. In (a) the starting point is provided by a ring made from corner-sharing Si4 atoms in a chemically ordered network. Each silicon atom is bound to four twofold coordinated oxygen atoms giving a Si:O ratio of 1 : 2 that is in keeping with the glass stoichiometry. In (b) the first ring closure event leads to the formation of a fivefold coordinated atom SiI that is bound to four twofold coordinated oxygen atoms and one threefold coordinated oxygen atom such that the SiI:O ratio changes to 1:(4/2 + 1/3) or 1 : 2.33. In (c) the second ring closure event leads to the formation of a second fivefold coordinated atom SiII such that SiI and SiII are each bound to three twofold coordinated oxygen atoms and two threefold coordinated oxygen atoms to give a SiI/II:O ratio of 1:(3/2 + 2/3) or 1 : 2.17. This zipping of the initial ring by a pairing of higher-coordinated Siα atoms is consistent with the TSM molecular dynamics simulations that found a preference, when higher-coordinated Siα atoms first appear, for Si5 or Si6 atoms to be linked via common oxygen atoms to other Si5 or Si5/Si6 atoms, respectively. This pairing of higher-coordinated Siα atoms acts in a direction that helps to preserve locally the glass stoichiometry. Since the silicon and oxygen atoms in the TSM are charged, this preservation of stoichiometry promotes charge neutrality at a local level.
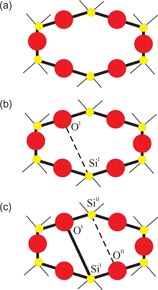
Figure 15. Schematic of a ring comprising 12 atoms (a) before a ring closure event, (b) after a single ring closure event, and (c) after two ring closure events. Within a ring, the small (yellow) circles represent Si atoms and the large (red) circles represent O atoms. At a given stage in the densification process, existing Si–O bonds within a ring are shown by solid thick lines and the new Si–O bond is shown by a broken line. The remainder of the Si–O bonds are indicated by solid thin lines.
Download figure:
Standard image High-resolution imageThe model represented by equation (17), in which rings are zipped by a pairing of higher-coordinated silicon atoms, also provides a rough guide to the dependence on
of the mean primitive ring size <n> from quench-from-the-melt TSM molecular dynamics simulations of SiO2 glass (figure 14(b)). This is unexpected given that in these simulations independent liquid state configuration are quenched at different high pressures so that the glass configurations are uncorrelated. By contrast, in the process of cold compression for which the zipper model was developed, a high-pressure glass configuration retains a memory of the lower-pressure glass configurations from which it was derived [35]. The zipper model will therefore act as a guide in the development of ring closure models for modified silicate networks as prepared by cold compression, and may also provide a useful reference for silicate materials formed by quench-from-the-melt processes.
7. Structure of GeO2 glass
Germania, or GeO2, is another classic example of a 'strong' network glass-forming material [154]. At ambient pressure, the glass network is based on corner-sharing GeO4 tetrahedra [40, 179], and with increasing pressure there is a transformation to an octahedral glass that occurs at a lower pressure by comparison with vitreous SiO2 [180–182]. This reduction makes it easier to follow the process of network collapse by using a variety of in situ high-pressure experimental probes, including x-ray diffraction [183–186], XAS [186–190], Raman spectroscopy [180, 181, 184] and inelastic x-ray scattering [191]. There is also a large contrast between the coherent scattering lengths of the Ge isotopes which has made it possible to measure the full set of partial structure factors for the glass at ambient conditions by using the method of neutron diffraction with isotope substitution [40, 179]. GeO2 glass has therefore been the target of in situ high-pressure neutron diffraction experiments, where the earliest investigation was made by Guthrie et al [183] using a Paris-Edinburgh press at pressures up to 5 GPa. It was, however, difficult to extract quantitative information from the measured diffraction patterns owing to problems associated with the counting statistics and background scattering. These issues have now been addressed by using the measurement and data analysis protocols described in sections 3 and 4 [36, 37]. Moreover, it has proved possible to apply the method of in situ high-pressure neutron diffraction with isotope substitution to obtain site-specific information on the structure of GeO2 glass at pressures up to 8 GPa [32].
The measured SN(k) [32, 37] and SX(k) [185] functions are shown in figure 16 at pressures up to 17.5 and 15.7 GPa, respectively. The neutron diffraction work employed the diffractometer D4c for the pressure range from ambient to 8.0(5) GPa and the diffractometer PEARL at higher pressures. The weighting factors for the Ge–Ge, Ge–O and O–O partial structure factors are 0.1710 : 0.4851 : 0.3439 for SN(k) (assuming Ge of natural isotopic abundance) versus 0.4444 : 0.4444 : 0.1111 for SX(k) at k = 0, i.e. neutron diffraction is more sensitive to the oxygen atom correlations as compared to x-ray diffraction. At ambient pressure, SN(k) and SX(k) both have an FSDP at a position of 1.53(2) or 1.56(1) Å−1, respectively, and a principal peak at ≃ 2.67 Å−1 that is sharper in the x-ray diffraction work. A breakdown of these ambient pressure total structure factors into their contributions from the measured partial structure factors is given in [40]. As the pressure is increased, the FSDP moves to a higher k-value while the principal peak becomes a sharper feature in SN(k) and merges with the FSDP in SX(k) [183, 184].
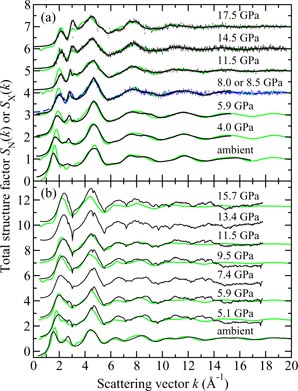
Figure 16. The pressure dependence of the (a) neutron total structure factor SN(k) and (b) x-ray total structure factor SX(k) for GeO2 glass. In (a) the broken (blue) curve (P = 8.5 GPa) and solid (black) curves (all other pressures) show spline fits to the data sets measured by Wezka et al [32] (ambient to 8.0 GPa) and Salmon et al [37] (8.5–17.5 GPa) as given by the points with vertical error bars. For the pressure range 8.5–17.5 GPa, the region k ⩽ 1.55 Å−1 was not accessible in the experiments and the curves in this region correspond to fitted Lorentzian functions (section 4.2). In (b) the solid (black) curves show the experimental results from Mei et al [185]. In (a) and (b) the experimental results are compared to those obtained from DIPPIM [196, 197] molecular dynamics simulations for the same or comparable densities (solid light (green) curves) [32, 37]. In (b) some of the discrepancy between experiment and simulation arises from residual slopes on the measured high-pressure data sets. In (a) and (b) the high-pressure data sets have been displaced vertically for clarity of presentation.
Download figure:
Standard image High-resolution imageThe pressure dependence of the neutron and x-ray total pair-distribution functions is shown in figure 17. The first peak in GN(r) or GX(r) arises from the Ge–O partial pair-distribution function gGeO(r). At ambient pressure, the peak position gives a mean Ge–O bond distance
 , and the mean Ge–O coordination number
 . The pressure dependence of
 and
and
 is shown in figures 18(a) and (b), where the results from neutron diffraction [36, 37] and x-ray diffraction [183, 185, 186] are compared to the distances obtained from EXAFS spectroscopy [188–190] and the coordination numbers obtained from inelastic x-ray scattering [191]. There is little change to either
or
until a pressure of ≃5 GPa is attained. The Ge–O bond distance then increases so that germanium can incorporate a larger number of oxygen nearest-neighbours, and the material transforms from a tetrahedral to an octahedral glass. This process is not abrupt as reported in the early EXAFS work of Itié et al [187]. The pressure at which the glass becomes fully octahedral is uncertain. The EXAFS experiments of Baldini et al [189] give Ge–O bond lengths that indicate a pressure of around 30 GPa. In comparison, the EXAFS work of Hong et al [190] indicates a pressure of 20 GPa where the Ge–O bond length for the glass reaches its maximum value and matches that found for the rutile-type crystalline phase of GeO2 in which germanium is sixfold coordinated [192]. The discrepancy between these EXAFS results may arise from different ways of treating glitches in the measured spectra that arise from Bragg scattering from the diamond anvil cells used for the experiments, and from access to different k-ranges (where k denotes the magnitude of the photo-electron wave vector) in these experiments [190].
is shown in figures 18(a) and (b), where the results from neutron diffraction [36, 37] and x-ray diffraction [183, 185, 186] are compared to the distances obtained from EXAFS spectroscopy [188–190] and the coordination numbers obtained from inelastic x-ray scattering [191]. There is little change to either
or
until a pressure of ≃5 GPa is attained. The Ge–O bond distance then increases so that germanium can incorporate a larger number of oxygen nearest-neighbours, and the material transforms from a tetrahedral to an octahedral glass. This process is not abrupt as reported in the early EXAFS work of Itié et al [187]. The pressure at which the glass becomes fully octahedral is uncertain. The EXAFS experiments of Baldini et al [189] give Ge–O bond lengths that indicate a pressure of around 30 GPa. In comparison, the EXAFS work of Hong et al [190] indicates a pressure of 20 GPa where the Ge–O bond length for the glass reaches its maximum value and matches that found for the rutile-type crystalline phase of GeO2 in which germanium is sixfold coordinated [192]. The discrepancy between these EXAFS results may arise from different ways of treating glitches in the measured spectra that arise from Bragg scattering from the diamond anvil cells used for the experiments, and from access to different k-ranges (where k denotes the magnitude of the photo-electron wave vector) in these experiments [190].
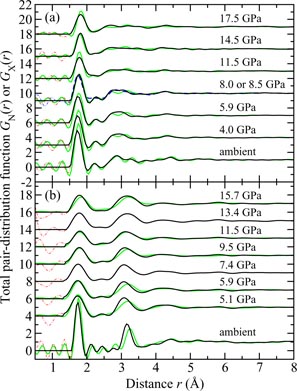
Figure 17. The pressure dependence of the (a) neutron total pair-distribution function GN(r) [32, 37] and (b) x-ray total pair-distribution function GX(r) [185] for GeO2 glass. The solid (black) curves show the Fourier transforms of the measured SN(k) and SX(k) functions given by the solid (black) curves in figure 16, except at r values smaller than the distance of closest approach between two atoms where they show the calculated GN(r → 0) = 0 or GX(r → 0) = 0 limiting values. The chained (red) curves give the Fourier transform artifacts in this small-r region. In (a) the broken (blue) curve shows the Fourier transform of the measured SN(k) at 8.5 GPa given by the broken (blue) curve in figure 16(a). In (a) the data sets correspond to cutoff values of kmax = 16.85 Å−1 (ambient pressure), kmax = 15.3 Å−1 (4.0–8.0 GPa) and kmax = 19.6 Å−1 (8.5–17.5 GPa). In (b) the data sets correspond to a cutoff kmax = 19.94 Å−1 for ambient pressure, and to a cutoff kmax = 14.2 Å−1 with a Lorch [77] modification function for all other pressures. In (a) and (b) the solid light (green) curves show the Fourier transforms of the DIPPIM SN(k) and SX(k) functions given in figure 16 where the same transform procedures were used as for the experiments [32, 37]. The high-pressure data sets have been shifted vertically for clarity of presentation.
Download figure:
Standard image High-resolution image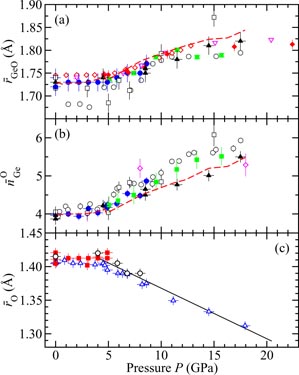
Figure 18. The pressure dependence at room temperature of (a) the mean Ge–O bond length
, (b) the mean Ge–O coordination number
, and (c) the mean oxygen atom radius
for GeO2 glass under cold compression. In (a) and (b) the data sets are from (i) the neutron diffraction experiments of Drewitt et al [36] ((blue) •) and Salmon et al [37] (▴), and (ii) the x-ray diffraction experiments of Guthrie et al [183] (□), Mei et al [185] ((green) ▪) and Hong et al [186] (∘). In (a) additional data sets are from (iii) the EXAFS experiments of Vaccari et al [188] ((red) ◊), Baldini et al [189] ((red) ⧫) and Hong et al [190] ((magenta) ▿), and in (b) an additional data set is from (iv) the inelastic x-ray scattering experiments of Lelong et al [191] ((magenta) ◊). In (a) and (b) the broken (red) curves show the DIPPIM molecular dynamics results for the weighted peak position <rGeO> = ∫dr r gGeO(r)/∫dr gGeO(r) and the Ge–O coordination number
as obtained by integrating over the first peak in gGeO(r) to the first minimum. In (c)
is (i) calculated from the Ge–O bond length measured in the diffraction experiments of Guthrie et al [183], Drewitt et al [36] and Wezka et al [32] by assuming regular GeO4 tetrahedra (section 8) ((red) ▪); (ii) taken from
where
is the position of the nearest-neighbour peak in gOO(r) as measured in the neutron diffraction work of Wezka et al [32] ((black) ∘) (figure 21(a)); and (iii) taken from
where
is the position of the nearest-neighbour peak in gOO(r) from DIPPIM molecular dynamics simulations ((blue) ▵) [32, 37]. The straight line shows the estimated dependence of
on pressure in the transformation from GeO4 tetrahedra to GeO6 octahedra.
Download figure:
Standard image High-resolution imageAt ambient pressure, there is overlap in the region of the second peak in GN(r) or GX(r) between the first peaks in gOO(r) and gGeGe(r) at 2.83(1) Å and 3.16(1) Å, respectively, and there is also a small contribution from gGeO(r) [40]. The ratio of the Ge–Ge:O–O partial pair-distribution function weighting factors is 1 : 2.011 for SN(k) and 4 : 1 for SX(k) at k = 0. Thus, the second peak in GN(r) is expected to have a large contribution from both Ge–Ge and O–O correlations while the second peak in GX(r) is expected to have a large contribution from Ge–Ge correlations. It is therefore possible to use the x-ray diffraction results to estimate the nearest-neighbour Ge–Ge distance
 and hence the pressure dependence of the Ge–O–Ge bond angle (see section 7.1).
We note that in the recent work of Lin et al [112] a measured pressure-volume equation of state for glassy GeO2 was fitted by using a second order Birch–Murnaghan equation of state at pressures up to 10 GPa. On this basis, it was suggested that a tetrahedral network can be maintained in GeO2 glass at pressures up to 10 GPa. However, all of the data sets shown in figure 18(b) indicate an increase in the Ge–O coordination number above four at ≃5 GPa and a value
 at 10 GPa. It does not therefore appear that an equation of state fit can be used to correctly infer the persistence to high pressures of the network connectivity of an ambient-pressure glass.
7.1. High-pressure neutron diffraction with isotope substitution
It is desirable to have additional information on the structure of GeO2 glass at distances larger than the nearest-neighbour distance in order to follow in more detail the mechanisms of pressure-driven network collapse, and thereby test the veracity of the various models that have been proposed. One way forward is to employ the method of in situ high-pressure neutron diffraction with isotope substitution as developed by Wezka et al [32].
Let neutron diffraction experiments be made on two samples of GeO2 glass that are identical in every respect, except for their Ge isotope enrichments. If the samples are 70GeO2 and 73GeO2 then the measured total structure factors can be denoted by 70F(k) and 73F(k), respectively. The contribution to the diffraction patterns from the O–O partial structure factor can be eliminated by forming the first-difference function

where
 and
and
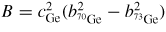 . Alternatively, the contribution to the diffraction patterns from the Ge–Ge partial structure factor can be eliminated by forming the first-difference function

where
 and
and
 . The corresponding real-space functions are denoted by ΔGGe(r) and ΔGO(r), and are obtained by substituting gαβ(r) for Sαβ(k) in equations (18) and (19), respectively. Thus, ΔGGe(r) comprises a weighted sum of gGeO(r) and gGeGe(r) and thereby gives site-specific information on the Ge atom correlations, whereas ΔGO(r) comprises a weighted sum of gGeO(r) and gOO(r) and thereby gives site-specific information on the O atom correlations.
For the in situ high-pressure neutron diffraction with isotope substitution experiments performed by Wezka et al [32], the gaskets used for the different samples were matched along with the sample sizes in order to help reproduce the same conditions at each pressure point. At several pressures, the sensitivity of the results to the applied load was investigated by measuring diffraction patterns at loads corresponding to (i) the target pressure less ∼0.3 GPa, (ii) the target pressure, and (iii) the target pressure plus ∼0.3 GPa. This variation by ±0.3 GPa did not, however, cause a notable change to a measured diffraction pattern at the target pressure within the counting statistics. Furthermore, the reliability of the measured difference functions was tested by measuring an additional set of diffraction patterns at the same pressures but for a sample of natGeO2 where nat denotes the natural isotopic abundance. The measured total structure factors natF(k) were then combined with 73F(k) to form a second set of ΔFGe(k) and ΔFO(k) difference functions. The parameters extracted from this second set of difference functions were found to be in agreement with those obtained from the first set of difference functions within the experimental error.
The difference functions ΔFGe(k) and ΔFO(k) constructed from 70F(k) and 73F(k) at pressures up to 8 GPa are shown in figure 19. The weighting factors are A = 0.124(3) barn and B = 0.081(2) barn for ΔFGe(k), and C = 0.0875(5) barn and D = 0.1497(2) barn for ΔFO(k). The corresponding real-space functions ΔGGe(r) and ΔGO(r) are illustrated in figure 20. The first peak is attributable to Ge–O correlations and gives
and
values that are in agreement with those obtained in the previous neutron diffraction work of Drewitt et al [36] (figure 21). Importantly, the NDIS method allows for the nearest-neighbour Ge–Ge and O–O correlations to be resolved, as indicated by the second peaks in ΔGGe(r) and ΔGO(r), respectively. The pressure dependence of the corresponding peak positions
and
is shown in figure 21(a), where the
values are compared to those obtained from the second peak position in the GX(r) functions measured by Mei et al [185] and Hong et al [186]. These estimates of
are not expected to be identical because the second peak in ΔGGe(r) will also have a contribution from gGeO(r) that appears towards its high-r side at ambient pressure [40], while the second peak in GX(r) will also have contributions from gGeO(r) and gOO(r) where the latter appears towards its small-r side at ambient pressure [40]. Nevertheless, the different sets of
values reported in figure 21(a) are similar, with relative shifts that are consistent with the ambient pressure observations. The pressure dependence of the O–O coordination number
 , as obtained by integrating over the second peak in ΔGO(r) and assuming minimal overlap between the O–O and Ge–O correlations as observed at ambient pressure [40], is shown in figure 21(b).
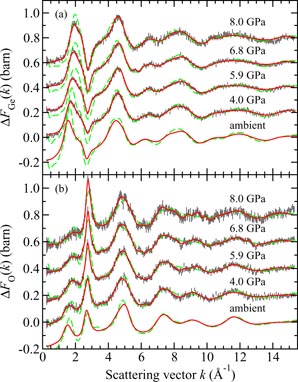
Figure 19. The pressure dependence of the first-difference functions (a) ΔFGe(k) and (b) ΔFO(k) for GeO2 glass at ambient temperature [32]. The vertical bars give the statistical errors on the measured data points, the solid (red) curves give the back Fourier transforms of the corresponding real-space functions shown in figure 20, and the broken (green) curves give the DIPPIM molecular dynamics results. The high-pressure data sets have been shifted vertically for clarity of presentation. The figure is adapted from Wezka et al [32].
Download figure:
Standard image High-resolution image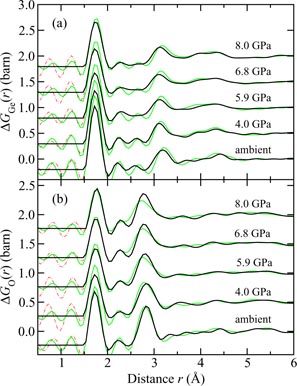
Figure 20. The pressure dependence of the first-difference functions (a) ΔGGe(r) and (b) ΔGO(r) for GeO2 glass. The solid (black) curves show the Fourier transforms of the (spline fitted) measured ΔFGe(k) and ΔFO(k) functions shown in figure 19, except at r values smaller than the distance of closest approach between two atoms where they show the calculated ΔGGe(r → 0) or ΔGO(r → 0) limiting values. The chained (red) curves give the Fourier transform artifacts in this small-r region. The light solid (green) curves show the Fourier transforms of the DIPPIM ΔFGe(k) and ΔFO(k) functions shown in figure 19 where the same cutoff kmax was used as for the neutron diffraction data. The high-pressure data sets have been shifted vertically for clarity of presentation. The figure is adapted from Wezka et al [32].
Download figure:
Standard image High-resolution image
Figure 21. The pressure dependence in GeO2 glass of the mean nearest-neighbour (a) Ge–O, O–O and Ge–Ge distances and (b) Ge–O and O–O coordination numbers. The results from neutron diffraction with isotope substitution experiments (▪) are compared to those obtained from DIPPIM molecular dynamics simulations (broken (red) curves) [32]. The results for
and
are compared to those obtained in the neutron diffraction work of Drewitt et al [36] ((green) •) and Salmon et al [37] ((blue) ▴), and the results for
are compared to those obtained in the x-ray diffraction work of Mei et al [185] ((magenta) ◊) and Hong et al [186] (∘). A more complete picture of the measured pressure-dependence of
and
is given in figure 18.
Download figure:
Standard image High-resolution imageThe pressure dependence of the mean intra-polyhedral O–Ge–O and inter-polyhedral Ge–O–Ge bond angles was estimated from the nearest-neighbour distances obtained from the measured first-difference functions by using the cosine rule such that
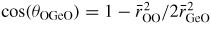 and
and
 . The pressure dependence of the Ge–O–Ge bond angle was also estimated from the first and second peak positions in the GX(r) functions measured by Mei et al [185] and Hong et al [186]. These bond angles are compared in figure 22 to those measured for the α-quartz polymorph of crystalline GeO2 [193–195], where the results are plotted as a function of the reduced density ρ/ρ0 and ρ0 is the value of the number density ρ at ambient pressure. Since the α-quartz polymorph is ∼18% more dense than the glass at ambient pressure, this choice of abscissa enables a ready comparison to be made between the glass and crystal structures. The reduced density is also used because it enables a direct comparison to be made with the results obtained from molecular dynamics work (section 7.2). For the glass, the pressure-to-density conversion was made using the equation of state measured by Hong et al [184] for the neutron diffraction and several of the x-ray diffraction results [186], or the equation of state measured by Mei et al [185] for the x-ray diffraction results measured by these authors.
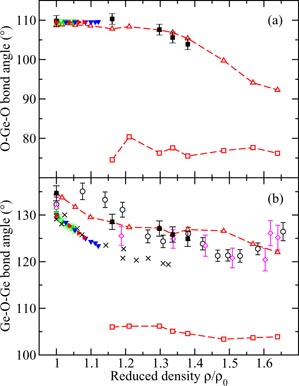
Figure 22. The reduced density ρ/ρ0 dependence of the (a) O–Ge–O and (b) Ge–O–Ge bond angles as measured for GeO2 glass in the neutron diffraction work of Wezka et al [32] (▪) and for the α-quartz polymorph of crystalline GeO2 in the work of Jorgensen [193] ((green) ▴), Yamanaka and Ogata [194] ((red) ▸) and Glinnemann et al [195] ((blue) ▾). In (b) the Ge–O–Ge bond angles estimated from the x-ray diffraction work of Mei et al [185] ((magenta) ◊) and Hong et al [186] (∘) are also shown, together with the Ge–O–Ge bond angles estimated by combining x-ray diffraction and EXAFS results (×) [186] (section 7.1). In (a) and (b) the experimental results are compared to the peak positions obtained in the O–Ge–O and Ge–O–Ge bond-angle distributions from DIPPIM molecular dynamics simulations of the glass. The first branches that appear at the smallest densities originate from intra-tetrahedral O–Ge–O and inter-tetrahedral Ge–O–Ge connections [(red) ▵)]. The second branches that appear at higher densities correspond to the development of an additional peak or shoulder in the O–Ge–O and Ge–O–Ge bond-angle distributions, and originate from the replacement of GeO4 tetrahedra by GeO5 and GeO6 polyhedra ((red) □).
Download figure:
Standard image High-resolution imageFor the glass, the various diffraction results give a self-consistent picture for the density dependence of the estimated Ge–O–Ge bond angle within the experimental error (figure 22). A similar density dependence for the Ge–O–Ge bond angle is obtained by calculating this angle using the
distances from EXAFS spectroscopy and the
distances from x-ray diffraction [186] (figure 22). The latter gives, however, a reduced bond angle for a given pressure such that the results map onto those found for the α-quartz polymorph of GeO2. Such agreement is not, however, expected: at ambient pressure the Ge–O–Ge bond angle is larger for the glass (132(2)° [40]) than for the α-quartz polymorph (130.0(1)–130.5(8)° [193–195]), in accordance with a less-dense more-open amorphous structure.
7.2. Competing models for the density-driven network collapse of GeO2 glass
The measured neutron and x-ray diffraction and EXAFS results are compared in figures 16–22 to those obtained from molecular dynamics simulations using a DIPole-Polarisable Ion Model (DIPPIM) where the ions carry full ionic charges and their interaction potentials include dipole-polarisation effects [196, 197]. The model was parametrised by using first principles electronic structure calculations, as opposed to experimental results, with the aim of developing an accurate and transferrable description of the atomic interactions. The DIPPIM is the only model currently available that gives, for a single set of parameters, a good account of both the structural and vibrational properties of glassy GeO2 at ambient pressure, along with the dynamical properties of liquid GeO2 at elevated temperatures [196]. It does not, however, reproduce the measured pressure-density equation of state [110, 112, 184, 185, 199]. The DIPPIM molecular dynamics simulations were therefore performed using number densities that are the same or similar to those used in the neutron and x-ray diffraction work. To facilitate a comparison with the parameters measured from other techniques, these densities were sometimes converted to pressure using the equation of state measured by Hong et al [184]. In the simulations, an ambient pressure glass was first obtained by a quench-from-the-melt procedure. High-pressure configurations were then generated by a cold compression procedure in which the cell lengths and particle positions were re-scaled for each new density [198].
The DIPPIM molecular dynamics results reproduce all of the main features in the measured neutron and x-ray total structure factors (figure 16) and total pair-distribution functions (figure 17), although there is a shift of the second peak in GX(r) to higher r-values that is more pronounced at low pressures. This indicates a discrepancy between the measured and simulated gGeGe(r) functions, which was confirmed at ambient pressure by comparing the simulation results with the measured partial pair-distribution functions [40]. Nevertheless, the pressure dependence of the simulated Ge–O bond lengths and coordination numbers is in accord with many of the experimental results shown in figure 18. The simulations also indicate that when
increases above four, the first peak in gGeO(r) becomes asymmetric through the development of a high-r tail [32]. The same type of asymmetrical broadening is also found from the AIM simulations of B2O3 glass (section 5) and from the TSM simulations of SiO2 glass (section 6) when
and
first increase above their ambient pressure values, i.e. the first peaks in gBO(r) and gSiO(r) both develop a high-r tail.
As shown in figures 19 and 20, the DIPPIM simulations also give a good account of the measured first-difference functions in both reciprocal and real space, an agreement that extends to the pressure dependence of the associated Ge–Ge and O–O nearest-neighbour distances
and
(figure 21(a)), the O–O coordination number
(figure 21(b)), and the O–Ge–O and Ge–O–Ge bond angles (figure 22). In keeping with the comparison made between the measured and DIPPIM results for GX(r) (figure 17(b)), there is a shift in the second peak of ΔGGe(r) to a higher-r value for the simulations relative to experiment. A ring statistics analysis of the molecular dynamics configurations show an increase with pressure in the number of rings containing n = 6 (3 Ge and 3 O) atoms [32], which are attributed to the D2 band at ≃520 cm−1 in measured Raman spectra [200, 201]. This increase is consistent with the measured pressure-induced enhancement of the D2 band [180–182].
The DIPPIM molecular dynamics results for the pressure dependence of the fractions of Geα and Oα atoms is given in figure 23, where the notation Geα(α = 4, 5 or 6) refers to an α-fold coordinated germanium atom and the notation Oα(α = 2 or 3) refers to an α-fold coordinated oxygen atom [32, 197]. The simulations show that the transformation from a tetrahedral to an octahedral glass occurs via the formation of fivefold coordinated Ge atoms, in a process where chemical ordering is preserved and threefold coordinated oxygen atoms appear in order to maintain the glass stoichiometry. The majority of GeO5 units are distorted square pyramids where the vacancy at the base of these units anticipates the eventual formation of octahedral (i.e. square bipyramidal) units. At high densities, the predicted fractions of GeO4, GeO5 and GeO6 units are not in agreement with those found from inelastic x-ray scattering experiments [191]. This discrepancy may originate from an analysis of the measured inelastic x-ray scattering spectra using data from crystalline standards that contain trigonal bipyramidal GeO5 units, i.e. these units may not be the predominant species found in the glass. The mean Ge–O coordination number obtained from the inelastic x-ray scattering experiments at ∼8 GPa (ρ/ρ0 ∼ 1.4) is also large as compared to the measured neutron and x-ray diffraction
values (figure 18(b)). In this pressure regime the inelastic x-ray scattering data give, relative to DIPPIM molecular dynamics simulations, a much greater fraction of GeO6 polyhedra as compared to GeO4 and GeO5 polyhedra (figure 23(a)). The applicability of the 'zipper' model for ring closure events (section 6.1) in the cold-compression of glassy GeO2 is presently under investigation.

Figure 23. The DIPPIM molecular dynamics results for the reduced density dependence in GeO2 glass of the fractions of (a) fourfold (•), fivefold ((red) ▪) and sixfold ((blue) ▴) coordinated Ge atoms, and (b) twofold (•) and threefold ((red) ▪) coordinated oxygen atoms [32]. In (a) the density dependence of the fraction of Geα species from inelastic x-ray scattering experiments is also given where α = 4 (∘), 5 ((red) □) or 6 ((blue) ▵) [191].
Download figure:
Standard image High-resolution imageFigure 24 compares the pressure dependence of
and
as measured by neutron diffraction to the predictions obtained from various molecular dynamics simulations. Several of these simulations [202–207] used the Oeffner–Elliott [208] pair-potentials with partial charges, which were initially employed to model the α-quartz and rutile-type phases of GeO2, and the phase transition between the α- and β-quartz phases of this material. First principles molecular dynamics methods have also been employed [209]. In comparison with these approaches, the DIPPIM model gives a good account of the pressure induced structural changes in GeO2 glass.
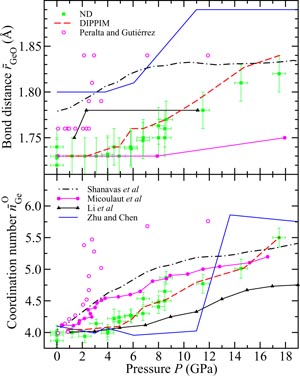
Figure 24. The pressure dependence of the mean nearest-neighbour Ge–O bond distance
and coordination number
for GeO2 glass as obtained from neutron diffraction ((green) squares with error bars) [32, 36, 37] and from different molecular dynamics simulations. The predictions from the DIPPIM simulations (broken (red) curves) [32] are in agreement with the experimental data, in contrast to the predictions of Micoulaut et al [202, 203] (solid (magenta) curves with circles), Shanavas et al [204] (chained (black) curves), Li et al [206] (solid (black) curves with triangles) and Peralta and Gutiérrez [207] (open (magenta) circles) who used Oeffner–Elliott interaction potentials [208], and the predictions of Zhu and Chen [209] (solid (blue) curves) who used a first-principles molecular dynamics method.
Download figure:
Standard image High-resolution image8. The role played by oxygen packing in structural transformations
Oxygen-oxygen interactions are expected to manifest themselves in the structural transformations that occur in oxide materials with increasing pressure [210], but the role they play for glasses and liquids has been difficult to identify. This is, perhaps, unsurprising given the difficulty in solving the structures of disordered materials, and the paucity of experimental information at extreme conditions. The work reported in sections 5–7 has, however, contributed to the proposal that the oxygen-packing fraction ηO can be used to rationalise the changes that occur to the coordination number of network-forming motifs over a wide pressure and temperature range [21, 74, 211]. Network-forming motifs include the AO3 triangular units in borate materials and the AO4 tetrahedra in silicate and germanate materials, where A denotes an electropositive chemical species such as B, Si or Ge.
Zeidler et al [74] calculated ηO for those glassy and liquid oxides for which experimental information is available on the A–O bond length
 , coordination number
 and atomic number density ρ. For those materials in which the A atoms are threefold, fourfold or sixfold coordinated, regular polyhedra with touching oxygen atoms were assumed. The mean oxygen atom radius is then given by
 for planar AO3 triangles,
 for AO4 tetrahedra, and
 for AO6 octahedra. At ambient conditions, this approach gives
 for BO3 triangles,
 for SiO4 tetrahedra, and
 for GeO4 tetrahedra [74]. With increasing pressure, the oxygen radius was assumed to vary linearly in the transformation from BO3 to BO4 polyhedra in the case of glassy B2O3, or from AO4 to AO6 polyhedra in the cases of glassy SiO2 and GeO2. For B2O3, the start and end point values for the transformation were taken to be
at 6.3 GPa and
for GeO4 tetrahedra [74]. With increasing pressure, the oxygen radius was assumed to vary linearly in the transformation from BO3 to BO4 polyhedra in the case of glassy B2O3, or from AO4 to AO6 polyhedra in the cases of glassy SiO2 and GeO2. For B2O3, the start and end point values for the transformation were taken to be
at 6.3 GPa and
 at 25 GPa, where the latter were estimated from the data shown in figure 8. For SiO2 and GeO2, the
values are plotted in figures 12(c) and 18(c), respectively.
at 25 GPa, where the latter were estimated from the data shown in figure 8. For SiO2 and GeO2, the
values are plotted in figures 12(c) and 18(c), respectively.
For network-forming systems like B2O3, SiO2 and GeO2, ηO was calculated by assuming that A atoms fit into the interstitial vacancies formed by oxygen atoms. Let NO be the number of oxygen atoms and VO be the volume occupied by each of these atoms. Then, for a system containing a total of N atoms in a volume V, it follows that

where ρO = NO/V = cO ρ is the number density of oxygen atoms, cO = NO/N is the atomic fraction of oxygen atoms, and ρ = N/V is the atomic number density. The oxygen atoms were assumed to be spherical such that
 . For modified network-forming materials such as M–A–O, where M denotes a network modifying atom, the oxygen-packing fraction was calculated by first removing the volume occupied by M atoms because this space is not available to oxygen atoms. Then, if NM is the number of M-type atoms and VM is the volume occupied by each of these atoms, it follows that

provided that A atoms again occupy the interstitial vacancies between oxygen atoms. In equation (21), ρM = NM/V = cM ρ is the number density of each M-type atom, and cM = NM/N is the atomic fraction of M-type atoms. The modifying atoms were taken to be spheres of radius
 such that
 . The pressure dependence of VM was assumed to be relatively weak, and the
values were taken from Shannon [212].
. The pressure dependence of VM was assumed to be relatively weak, and the
values were taken from Shannon [212].
The ηO dependence of the measured A–O coordination number
is shown in figure 25 for those glassy and liquid network-forming materials under pressure for which sufficient experimental information is available to calculate ηO. The materials include glassy B2O3 [34, 145, 147], SiO2 [35, 163, 164] and GeO2 [32, 36, 37, 183, 185] under cold compression at pressures up to 22.5, 102 and 17.5 GPa, respectively; glassy (MgO)0.62(SiO2)0.38 under cold compression at pressures up to 8.6 GPa [222]; liquid CaSiO3 at P = 6 GPa and T = 2130 K [223]; and molten basalt (an aluminosilicate) under deep mantle conditions at pressures up to 60 GPa and temperatures in the range of 2273–3273 K [165]. For molten basalt, the pressure dependence of
in the regime where
 was taken from the straight line given in figure 12(c) and the Al atoms, which were assumed to be sixfold coordinated [165], were treated as network modifiers. In figure 25, the ηO versus
dependence is also shown for the room temperature polymorphs of crystalline B2O3, SiO2 and GeO2 [74].
was taken from the straight line given in figure 12(c) and the Al atoms, which were assumed to be sixfold coordinated [165], were treated as network modifiers. In figure 25, the ηO versus
dependence is also shown for the room temperature polymorphs of crystalline B2O3, SiO2 and GeO2 [74].
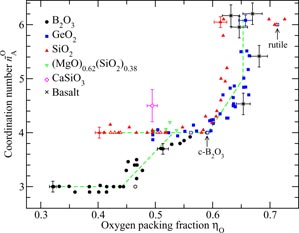
Figure 25. The dependence of the mean A–O coordination number
on the oxygen-packing fraction ηO for several materials under high pressure conditions. Results are given for glassy B2O3 (•) [34, 145, 147], SiO2 ((red) ▴) [35, 163, 164], and GeO2 ((blue) ▪) [32, 36, 37, 183, 185]; glassy (MgO)0.62(SiO2)0.38 [222] ((green ▿); liquid CaSiO3 [223] ((magenta) ◊); and molten basalt at deep mantle conditions (×) [165]. Results are also given for the room-temperature polymorphs of crystalline B2O3 (∘), SiO2 ((red) ▵), and GeO2 ((blue) □) where one of the data points for B2O3 (marked by a vertical arrow) lies beneath that for GeO2 [74]. The horizontal and vertical bars on several of the data points give representative uncertainties for ηO and
, respectively, where the former were estimated by using typical measurement errors of ±0.5% for
and ±1% for ρ. Three of the data points for SiO2 glass from [164] correspond to
 with packing fractions comparable to the value ηO = 0.719 for the rutile-type structure of crystalline SiO2. The broken green lines are drawn as guides for the eye. The plot is adapted from Zeidler et al [74], but the ηO values corresponding to [163–165] are different in the pressure range for which
because
was taken from a single curve for this range (figure 12(c)). The ηO values for B2O3 in the pressure range for which
with packing fractions comparable to the value ηO = 0.719 for the rutile-type structure of crystalline SiO2. The broken green lines are drawn as guides for the eye. The plot is adapted from Zeidler et al [74], but the ηO values corresponding to [163–165] are different in the pressure range for which
because
was taken from a single curve for this range (figure 12(c)). The ηO values for B2O3 in the pressure range for which
 have also been amended.
Download figure:
Standard image High-resolution imageFigure 25 shows a plateau of stability for BO3 triangles that ends at ηO ≃ 0.44, and a plateau of stability for AO4 tetrahedra (A = Si or Ge) that ends at ηO ≃ 0.59. The latter falls within the range of packing fractions found for a random loose packing of hard spheres, i.e. ηRLP = 0.55–0.60 [213–216]. The majority of data sets point to a maximum ηO value that is near to that expected for a random close packing of hard spheres, i.e. ηRCP = 0.64 [213–216]. There is also an indication at the highest pressures [164] of octahedral SiO2 glass structures with ηO ≃ 0.719 as for the rutile-type crystalline phase. There may therefore be another stability plateau for AO6 octahedra at high-densities. It is notable that in the case of crystalline SiO2, the high-pressure transformation from the cristobalite to the stishovite polymorph is thought to proceed via a two-stage mechanism in which (i) a compact lattice of oxide ions is formed and (ii) the cations then redistribute onto the newly created interstices of this lattice, thus changing the Si–O coordination number from four to six [217].
Figure 25 forms part of a more extensive structural map for predicting the likely regimes of stability for various types of A-centered motifs, and the regions of transformation between them, for a wide range of glassy and liquid silicate, aluminate, aluminosilicate, borate, borosilicate, boroaluminate and germanate materials under different state conditions [74]. Network-forming motifs govern the topological ordering on which the physico-chemical characteristics of a material (e.g. its compressibility and transport properties) depend. The structural map should therefore offer valuable information for making new glassy materials under high-pressure conditions by following the principles of rational design [218–221]. Figure 25 can also be used to forecast when changes may occur to the properties of fluids in planetary interiors. For example, in the case of molten basalt at deep mantle conditions the map offers an account as to where and how the transitions from SiO4 to SiO6 units occur: The upper limit of stability for tetrahedral motifs is ηO > 0.56, and the transformation to octahedral motifs occurs rapidly as ηO → ηRCP = 0.64.
9. Structure of glassy GeSe2
The glass forming regions of binary chalcogenide materials (i.e. those containing S, Se or Te) cover much wider ranges of composition as compared to their binary oxide counterparts [224], where glasses generally form only at stoichiometric compositions and the materials investigated in sections 5–7 are classic examples. This observation points to flexibility in character of the network-forming motifs in chalcogenide glasses, i.e. to enhanced structural variability [225, 226]. The mechanisms of pressure-driven network collapse are therefore anticipated to be different for chalcogenide as compared to oxide glasses.
A prototype material is provided by GeSe2 where at ambient conditions the glass network contains both corner-sharing and edge-sharing GeSe4 tetrahedra, together with a significant number of Ge–Ge and Se–Se homopolar bonds [41, 42, 227–235]. Although the existence of these bonds can be debated [21], like-atom contacts have been found from both diffraction and spectroscopic experiments, and their presence is consistent with the law of mass action. An accurate modelling of these features necessitates an approach based on first-principles molecular dynamics (FPMD), rather than an approach based on interatomic potentials [236]. The response of glassy GeSe2 to pressure is not clear. At pressures up to ∼9 GPa, a continuous structural transition [237, 238] and a discontinuous semiconductor-glass to metal-crystalline transition [239, 240] have both been reported.
Unlike the oxide materials considered in sections 5–7, conventional neutron and x-ray diffraction experiments on GeSe2 glass yield essentially the same information. The weighting factors for the Ge–Ge, Ge–Se and Se–Se partial structure factors are 0.1151 : 0.4483 : 0.4366 for neutron diffraction (assuming a sample of natGenatSe2 where nat denotes the natural isotopic abundance) versus 0.1024 : 0.4352 : 0.4624 for x-ray diffraction at k = 0. This similarity follows from the fact that the neutron scattering lengths for Ge and Se of natural isotopic abundance are similar at
 and
and
 [93], and the atomic numbers for Ge and Se are also similar so that fGe(k) ≃ fSe(k). It follows from section 2 that
 , i.e. neither the neutron nor the x-ray diffraction patterns contain much information on the chemical ordering in GeSe2 glass [21]. It also follows that
 . The pressure-volume equation of state for GeSe2 glass under cold compression has been measured by Mei et al [238].
The measured SN(k) functions are shown in figure 26 where the diffractometer D4c was employed for the pressure range from ambient to 4.7(5) GPa and the diffractometer PEARL was employed at higher pressures [33]. The measured SX(k) functions are also shown in figure 26 where an unphysical slope on the functions presented in [238] has been removed by using a back Fourier transform procedure, and the data sets have been renormalised to ensure agreement between each slope-corrected SX(k) function and the back Fourier transform of the corresponding GX(r) function after the unphysical low-r oscillations have been set to the calculated GX(r → 0) = 0 limit. The diffraction results show that the FSDP in
, which takes a position kFSDP ≃ 1.00(2) Å−1 under ambient conditions, moves to a larger k-value with increasing pressure and is almost eliminated by 9.3 GPa. The position of the principal peak at ≃2.05(3) Å−1 also moves to a larger k-value with increasing pressure but its height increases. Similar behaviour is found for the pressure dependence of the measured
functions for GeO2 glass [21]. These changes indicate a competition between the intermediate-range ordering that is associated with the FSDP and the extended-range ordering that is associated with the principal peak [78, 241, 242]. This competition is won by the extended-range ordering with increasing pressure, consistent with the transformation from a 'strong' low-density to a more 'fragile' high-density glass [21, 179]. The extended-range ordering can persist to nanometer distances in real-space [78, 241, 242].
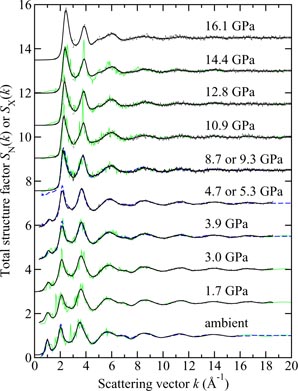
Figure 26. The pressure dependence of the neutron total structure factor SN(k) and x-ray total structure factor SX(k) for natGenatSe2 glass, where
. The solid (black) curves show spline fits to the SN(k) data sets measured by Petri et al [41, 42] (ambient) and Wezka et al [33] (1.7, 3.0, 3.9, 4.7, 8.7, 10.9, 12.8, 14.4 and 16.1 GPa) as given by the points with vertical error bars. For the pressure range 8.7–16.1 GPa, the region k ⩽ 1.55 Å−1 was not accessible in the experiments and the curves in this region correspond to fitted Lorentzian functions (section 4.2). The broken (blue) curves show the SX(k) functions measured by Mei et al [238] at ambient pressure and at 3.9, 5.3 and 9.3 GPa after the data sets have been corrected for a residual slope (section 9). The solid light (green) curves show FPMD results for the same or comparable densities and correspond to ambient pressure and to pressures of 2.15, 3.4, 4.88, 9.87, 11.56, 13.82 and 15.27 GPa [33]. The high-pressure data sets have been displaced vertically for clarity of presentation.
Download figure:
Standard image High-resolution imageThe pressure dependence of the neutron and x-ray total pair-distribution functions is shown in figure 27. For the neutron diffraction data at pressures ⩾8.7 GPa, GN(r) was obtained by Fourier transforming the SN(k) functions shown in figure 26 before and after the application of a Lorch [77] modification function. The data obtained from the first procedure were then joined smoothly to the data obtained from the second procedure at a point just beyond the first peak in real space. At ambient conditions, the first peak in GN(r) or GX(r) will have a contribution from all three of the Ge–Se, Ge–Ge and Se–Se partial pair-distribution functions as shown by experiments using neutron diffraction with isotope substitution, and the nearest-neighbour Ge–Se, Ge–Ge and Se–Se bond distances are all similar at 2.36(2), 2.42(2) and 2.32(2) Å, respectively [41, 42]. Thus, it is not possible to extract reliable coordination numbers
 (α, β = Ge, Se) from the first peak in the r-space functions. However, the coordination number averaged over all types of chemical species is given by

and can be evaluated because the neutron and x-ray diffraction results both give
to a good level of approximation [232]. If the '8-N' rule is obeyed, Ge and Se atoms will be fourfold and twofold coordinated, respectively, such that
 for the GeSe2 composition.

Figure 27. The pressure dependence of the neutron total pair-distribution function GN(r) [33] and the x-ray total pair-distribution function GX(r) [238] for natGenatSe2 glass, where
. The solid (black) curves show the Fourier transforms of the measured SN(k) functions given by the solid (black) curves in figure 26, except at r values smaller than the distance of closest approach between two atoms where they show the calculated GN(r → 0) = 0 limiting values. The chained (red) curves give the Fourier transform artifacts in this small-r region. The broken (blue) curves show the Fourier transforms of the measured SX(k) functions given by the broken (blue) curves in figure 26. The solid light (green) curves show the Fourier transforms of the FPMD SN(k) and SX(k) functions given in figure 26 where the same kmax values were used as for the experimental data [33]. The high-pressure data sets have been shifted vertically for clarity of presentation.
Download figure:
Standard image High-resolution imageMean nearest-neighbour bond distances
 were taken from the first peak positions in GN(r) and GX(r), and
 values were obtained by integrating over the first peaks in these functions. The results are plotted in figures 28(a) and (b) as a function of the reduced density ρ/ρ0 to help facilitate a comparison with FPMD results (section 9.2). The results show a gradual decrease in
with increasing density up to ρ/ρ0 ≃ 1.60 (P ≃ 12.8 GPa), a range for which
within the experimental error. At higher densities,
then increases with
as the first coordination shell expands to accommodate a larger number of nearest-neighbours.
values were obtained by integrating over the first peaks in these functions. The results are plotted in figures 28(a) and (b) as a function of the reduced density ρ/ρ0 to help facilitate a comparison with FPMD results (section 9.2). The results show a gradual decrease in
with increasing density up to ρ/ρ0 ≃ 1.60 (P ≃ 12.8 GPa), a range for which
within the experimental error. At higher densities,
then increases with
as the first coordination shell expands to accommodate a larger number of nearest-neighbours.
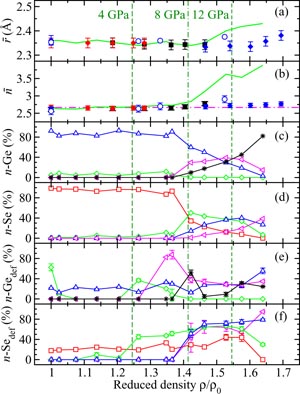
Figure 28. The ρ/ρ0 dependence in GeSe2 glass of the mean nearest-neighbour (a) bond distance
and (b) coordination number
as obtained from (i) neutron diffraction using a sample of natGenatSe2 on either the D4c ((red) ⧫) or PEARL ((blue) ⧫) diffractometer [33]; (ii) neutron diffraction using samples of 70GenatSe2 and 73Ge76Se2 on D4c and averaging the results (section 9.1) ((black) ▪) [33]; (iii) x-ray diffraction [238] ((blue) ∘); and (iv) FPMD where
was found from the simulated
values by using a cutoff distance specified by the first minimum in GN(r) or GX(r) (solid (green) curves) [33]. In (b) the horizontal chained line gives the '8-N' rule expectation of
= 2.67 [232]. Also given are the FPMD results for the fractions of n-fold coordinated (c) Ge and (d) Se atoms, along with the fractions of these n-fold coordinated (e) Ge and (f) Se atoms that have homopolar bonds. In (c)–(f) the symbols denote 2-fold ((red) □), 3-fold ((green) ◊), 4-fold ((blue) ▵), 5-fold ((magenta) ⊲) or 6-fold ((black) *) coordinated atoms, and the error bars (usually smaller than the symbol size) were calculated according to [233]. The vertical broken lines correspond to pressures of ∼4, 8 and 12 GPa. The figure is adapted from [33].
Download figure:
Standard image High-resolution image9.1. High-pressure neutron diffraction with isotope substitution
To obtain information on the chemical ordering in GeSe2 glass at pressure, the method of neutron diffraction with isotope substitution was applied by Wezka et al [33]. Let neutron diffraction experiments be made on two samples of GeSe2 glass that are identical in every respect, except for their isotopic enrichments. If the samples are 70GenatSe2 and 73Ge76Se2 then the measured total structure factors can be denoted by
 and
and
 , respectively. The contribution to the diffraction patterns from the Se–Se partial structure factor can be eliminated by forming the first-difference function

where
 and
and
 . Alternatively, the contribution to the diffraction patterns from the Ge–Ge partial structure factor can be eliminated by forming the first-difference function

where
 and
and
 . The corresponding real-space functions are denoted by ΔGGe(r) and ΔGSe(r), and are obtained by substituting gαβ(r) for Sαβ(k) in equations (23) and (24), respectively. Thus, ΔGGe(r) comprises a weighted sum of gGeSe(r) and gGeGe(r) and thereby gives site-specific information on the Ge atom correlations, whereas ΔGSe(r) comprises a weighted sum of gGeSe(r) and gSeSe(r) and thereby gives site-specific information on the Se atom correlations.
The measured difference functions ΔFGe(k) and ΔFSe(k) at pressures up to 8 GPa are shown in figure 29. The experiments used samples for which the neutron scattering lengths were
,
 ,
,
 ,
,
 and
and
 , taking into account the isotopic enrichments [41, 42]. Thus, the weighting factors are A = 0.236(4) barn and B = 0.099(2) barn for ΔFGe(k), and C = 0.184(3) barn and D = 0.588(11) barn for ΔFSe(k). The corresponding real-space functions ΔGGe(r) and ΔGSe(r) are illustrated in figure 30.
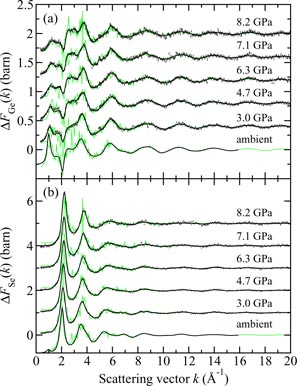
Figure 29. The pressure dependence of the first-difference functions (a) ΔFGe(k) and (b) ΔFSe(k) for GeSe2 glass at ambient temperature [33]. The vertical bars give the statistical errors on the measured data points, the solid dark (black) curves give the back Fourier transforms of the corresponding real-space functions shown in figure 30, and the light solid (green) curves give the FPMD results. The high-pressure data sets have been shifted vertically for clarity of presentation. The figure is taken from Wezka et al [33].
Download figure:
Standard image High-resolution image
Figure 30. The pressure dependence of the first-difference functions (a) ΔGGe(r) and (b) ΔGSe(r) for GeSe2 glass. The solid (black) curves show the Fourier transforms of the measured ΔFGe(k) and ΔFSe(k) functions shown in figure 29, except at r values smaller than the distance of closest approach between two atoms where they show the calculated ΔGGe(r → 0) or ΔGSe(r → 0) limiting values. The chained (red) curves give the Fourier transform artifacts in this small-r region. The light solid (green) curves show the Fourier transforms of the FPMD ΔFGe(k) and ΔFSe(k) functions shown in figure 29 where the same cutoff kmax was used as for the neutron diffraction data. The high-pressure data sets have been shifted vertically for clarity of presentation. The figure is adapted from Wezka et al [33].
Download figure:
Standard image High-resolution imageThe reduced density dependence of
, as obtained by averaging the first peak positions in the ΔGGe(r) and ΔGSe(r) first-difference functions and in the GN(r) functions for the 70GenatSe2 and 73Ge76Se2 samples, is given in figure 28(a). The mean coordination number
was estimated by fitting Gaussian functions to the first peak in the total pair-distribution function rGN(r) for both the 70GenatSe2 and 73Ge76Se2 samples using the method outlined in [243, 244]. The starting point was provided by the full set of partial pair-distribution functions as measured at ambient pressure by Petri et al [41, 42]. A procedure was adopted in which the fit obtained for a low pressure point was used as the starting point for a fit to the next highest pressure, a process that was repeated to cover the entire pressure range. The
values obtained at a given pressure point were then averaged, and the results were found to be consistent with the '8-N' rule expectation of
at pressures up to 8 GPa (figure 28(b)).
9.2. First principles molecular dynamics simulations (FPMD)
FPMD simulations of the pressure-induced structural changes in GeSe2 glass were made using the Becke–Lee–Yang–Parr (BLYP) functional to describe the electron exchange and correlation [245, 246]. The simulations were initiated from ambient pressure and temperature configurations with vanishing stress-tensor values [235] that gave best agreement with the measured partial structure factors [41, 42]. The simulation for each new pressure started from a configuration taken from the previous (lower) pressure after the density was increased by decreasing the volume. The system was then taken on a five-step thermal cycle, which involved a high temperature anneal at T = 900 K, to ensure that no memory was kept of an initial configuration, i.e. the glasses produced under pressure were statistically uncorrelated. Full details of the FPMD simulations are given in [33]. The modelled equation of state was found to be in accord with experiment [238] within the measurement error. The FPMD results are compared to the diffraction results in figures 26–30, where the data sets are matched according to their number densities in order to account for the fact that the measured and simulated equations of state were not identical.
In the pressure range up to 8.2(5) GPa, the simulations account for all of the main features in the measured diffraction patterns, and they also give
and
values that are in agreement with experiment within the measurement error (figures 28(a) and (b)). The simulations also give a good account of the reduced density dependence of the measured intra-polyhedral Se–Ge–Se bond angle (figure 31). In this comparison, the FPMD values were obtained from the simulated bond-angle distributions P(θ) (as normalised by sin (θ) to remove the effect of a finite sampling volume [247]) by using the expression <θ> = ∫dθ θ P(θ)/∫dθ P(θ) with a high-angle integration cutoff of 140°. The experimental values were obtained from the measured Ge–Se and Se–Se distances
 and
and
 by using the cosine rule, namely
 . The distance
was taken from the mean of the first peak positions in (i) the total pair-distribution function GN(r) for the 70GenatSe2 and 73Ge76Se2 samples and (ii) the first-difference functions ΔGGe(r) and ΔGSe(r). The distance
was taken from the second peak in ΔGSe(r) which is dominated by gSeSe(r): The ratio of the Se–Se to Ge–Se partial pair-distribution function weighting factors D:C is 1 : 0.3129. The FPMD results do not, however, give as good an account of the reduced density dependence of the measured inter-polyhedral Ge–Se–Ge bond angle (figure 31). Here, the FPMD <θ> values were obtained as above, and the experimental values were obtained from the measured Ge–Se and Ge–Ge distances
and
by using the cosine rule, namely
. The distance
was taken from the mean of the first peak positions in (i) the total pair-distribution function GN(r) for the 70GenatSe2 and 73Ge76Se2 samples and (ii) the first-difference functions ΔGGe(r) and ΔGSe(r). The distance
was taken from the second peak in ΔGSe(r) which is dominated by gSeSe(r): The ratio of the Se–Se to Ge–Se partial pair-distribution function weighting factors D:C is 1 : 0.3129. The FPMD results do not, however, give as good an account of the reduced density dependence of the measured inter-polyhedral Ge–Se–Ge bond angle (figure 31). Here, the FPMD <θ> values were obtained as above, and the experimental values were obtained from the measured Ge–Se and Ge–Ge distances
and
by using the cosine rule, namely
 . The same
distances were used as in the calculation of the Se–Ge–Se bond angles, and the
distances were estimated from the second peak position in the measured ΔGGe(r) functions, for which the ratio of the Ge–Ge to Ge–Se partial pair-distribution function weighting factors B:A is 1 : 2.3838. The relatively weak contribution of gGeGe(r) to the second peak in ΔGGe(r) most likely accounts for the discrepancy with the FPMD results.
. The same
distances were used as in the calculation of the Se–Ge–Se bond angles, and the
distances were estimated from the second peak position in the measured ΔGGe(r) functions, for which the ratio of the Ge–Ge to Ge–Se partial pair-distribution function weighting factors B:A is 1 : 2.3838. The relatively weak contribution of gGeGe(r) to the second peak in ΔGGe(r) most likely accounts for the discrepancy with the FPMD results.
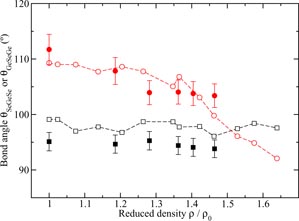
Figure 31. The ρ/ρ0 dependence in GeSe2 glass of the mean intra-polyhedral Se–Ge–Se [(red) • with vertical error bars] and inter-polyhedral Ge–Se–Ge ((black) ▪ with vertical error bars) bond angles as estimated from the measured Ge–Se, Ge–Ge and Se–Se distances (section 9.2). The experimental results are compared to the mean values <θSeGeSe> (broken (red) curve with ∘ symbols) and <θGeSeGe> (broken (black) curve with □ symbols) taken from FPMD simulations. The figure is taken from Wezka et al [33].
Download figure:
Standard image High-resolution imageAs shown in figures 28(a) and (b), at pressures >8.2 GPa the measured and simulated results both show an increase in
as the first coordination shell expands to incorporate a larger number of neighbours. This process starts, however, at ∼8.5 GPa from FPMD (ρ/ρ0 ∼ 1.42) as compared to ∼12 GPa (ρ/ρ0 ∼ 1.55) from experiment. The FPMD results for
indicate a bonding scheme that takes an increased metallic character with increasing pressure, whereas the diffraction results are consistent with the retention of semi-conducting behaviour.
In the pressure range up to 8.2(5) GPa where the diffraction and FPMD results are in accord, the simulations give a ratio of corner-sharing to edge-sharing tetrahedra that increases from 1.3 to 1.7 in the interval ρ/ρ0 ∼ 1.07–1.20 (P ∼ 1.29–3.55 GPa) (figure 32), which is consistent with the trend found from Raman spectroscopy experiments [248]. The results do not, however, support the model of Antao et al [249] where an increase of
was invoked to explain a minimum in the network rigidity at ≃4 GPa (ρ/ρ0 ≃ 1.25). The prevalence of edge-sharing units contrasts to the crystalline phase where transitions are observed from an ambient pressure two-dimensional structure, which contains equal numbers of edge-sharing and corner-sharing tetrahedra [250], to three-dimensional structures of densely-packed corner-sharing tetrahedra [251, 252]. High temperatures are usually required, however, to facilitate these transitions [251–254]. The presence of edge-sharing motifs in a pressure range where the chemical species retain their ambient pressure coordination numbers is in contrast to common oxide glasses such as B2O3, SiO2 and GeO2 where corner-sharing motifs dominate (sections 5–7).
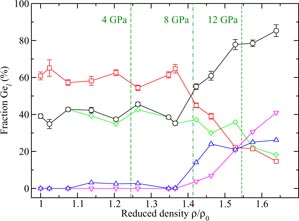
Figure 32. FPMD results showing the ρ/ρ0 dependence in GeSe2 glass of the fractions of corner-sharing Ge atoms (denoted by Ge0) (□) and edge-sharing Ge atoms (∘). The latter is broken down into its contributions from Geℓ centered polyhedra, where ℓ indicates the number of edge-sharing connections to other polyhedra and ℓ = 1 (◊), ℓ = 2 (▵) or ℓ = 3 or 4 (▿). The error bars (usually smaller than the symbol size) were calculated according to [233], and the vertical broken lines correspond to pressures of ∼4, 8 and 12 GPa. The figure is adapted from Wezka et al [33].
Download figure:
Standard image High-resolution image
At higher pressures, as the density is increased beyond ρ/ρ0 ∼ 1.42,
increases with
although there is a discrepancy between the rate of change found from diffraction and FPMD. In the latter, fourfold coordinated germanium atoms make way for fivefold and sixfold coordinated germanium atoms (figure 28(c)), twofold coordinated selenium atoms make way for higher coordinated selenium atoms (figure 28(d)), and there is a monotonic reduction in the corner-sharing to edge-sharing ratio (figure 32). On initial formation, large proportions of the higher coordinated germanium and selenium atoms have homopolar bonds (figures 28(e) and (f)), i.e. these defects mediate in the density-driven structural transformations. This feature is in contrast to oxide glasses where chemical ordering is preferred at all pressures (see sections 5–7).
The discrepancy between the neutron diffraction and FPMD results at high-pressure can be attributed to the presence of an energy barrier to structural rearrangement, that can be accessed via the high-temperature annealing stage in the simulations but cannot be explored in the cold-compression diffraction experiments [33]. In other words, a single valley in the energy landscape at pressures up to ∼8.5 GPa (ρ/ρ0 ∼ 1.42) bifurcates at higher pressures to give two valleys separated by an energy barrier that can be surmounted by heating to a temperature of T ∼ 900 K. It is a moot point as to whether structural relaxation at high-temperature in the simulations is enabling access to crystalline-like configurations: A discontinuous semiconductor-glass to metal-crystalline transition has been reported for GeSe2 at P ≃ 7 GPa [239, 240].
10. Other in situ high-pressure neutron diffraction studies of glassy and liquid materials
In all of the high-pressure work described above, an emphasis has been on the provision of fully corrected SN(k) functions that can be Fourier transformed to give direct information on the real-space structure of amorphous materials. There have been comparatively few other investigations of this type, where exceptions include work on glassy GeS2 [76], the modified silicate glass (MgO)0.62(SiO2)0.38 [222], and liquid ammonia [255]. All of this work employed a Paris-Edinburgh press.
As part of a joint x-ray and neutron diffraction study on the structure of the GeS2 system at high pressures and temperatures, Zeidler et al [76] investigated the structure of GeS2 glass under cold compression at pressures up to 4.9(5) GPa using the diffractometer D4c. The neutron diffraction experiments followed the procedures described in section 4.1. The high-pressure results did not show a notable change to the mean nearest-neighbour Ge–S bond distance or coordination number from their ambient pressure values of
 and
and
 , respectively.
Wilding et al [222] used the diffractometer PEARL, along with the data collection and analysis protocols described in section 4.2, to measure the structure of (MgO)0.62(SiO2)0.38 glass under cold compression at pressures up to 8.6 GPa. The data sets were interpreted with the aid of reverse Monte Carlo modelling [256, 257]. The results showed no change to the mean Si–O coordination number from its ambient pressure value of
 , but did show an increase in the mean Mg–O coordination number from
 at ambient pressure to
 at 8.6 GPa. The dependence of
on the oxygen-packing fraction is given in figure 25.
at 8.6 GPa. The dependence of
on the oxygen-packing fraction is given in figure 25.
Guthrie et al [255] used the diffractometer SNAP at the Spallation Neutron Source (SNS) to measure the ambient temperature structure of deuterated liquid ammonia (ND3) at pressures up to 2.1 GPa. The experiments used an in-plane scattering geometry, and the data sets were treated by using the vanadium normalisation method outlined in section 4.1. Deuterium was used instead of light hydrogen because of the large incoherent neutron scattering cross-section of H as compared to D [93]. The measured GN(r) functions indicated an N···D hydrogen bond distance of ∼2.5 Å, and showed pressure-dependent extended-range ordering with a correlation length that increases with pressure.
For the in situ high-pressure diffraction work to be described in the remainder of this section, a Paris-Edinburgh press was also employed but not with the data collection and analysis protocols described in section 4. The reciprocal space data sets were not transformed into r-space. Instead, the measured diffraction patterns were compared to the predictions of atomistic models as constructed by using the method of empirical potential structure refinement (EPSR) [258] or molecular dynamics simulations. Diffraction patterns have also been used to characterise the structural changes that occur in amorphous ice as the pressure and temperature are varied, using the position and width of the principal peak as fingerprints [259].
The structure of high-density amorphous (HDA) ice was investigated at 100 K using a sample of D2O and the diffractometer PEARL at pressures up to 2.2 GPa [260, 261]. The results were interpreted using the EPSR method, which modelled the full set of partial pair-distribution functions. The oxygen–oxygen partial pair-distribution function gOO(r) was found to be the most sensitive to pressure, showing a pressure-induced contraction of the second shell of nearest-neighbour water molecules. At ambient pressure the first and second peaks in gOO(r) appear at 2.8 and 3.7 Å, respectively, and with increasing pressure the second peak moves to smaller r-values to become a high-r shoulder on the first peak at 2.2 GPa. The transformation between the low density amorphous (LDA) and HDA forms of ice under a pressure of ∼0.3 GPa at 130 K was also investigated by using PEARL [262]. The profile of the principal peak during the transformation could be reconstructed by using a linear combination of the principal peaks measured for the pure LDA and HDA forms. This observation was interpreted in terms of two-phase coexistence, in support of a classical first-order transition, although this viewpoint has proved controversial e.g. the principal peak is only a single feature in the measured diffraction patterns [263, 264]. Nelmes et al [259] used PEARL to investigate the structure of amorphous deuterated ice over a more extensive pressure and temperature regime, and prepared a different variety of HDA ice by annealing at pressures near to 0.2 GPa.
The metastable phase diagram of LiCl:6D2O was investigated by using the diffractometer PEARL at high pressures and low temperatures [265]. The samples were isotopically enriched with 7Li to avoid the large neutron absorption cross-section of 6Li. By monitoring changes to the measured diffraction patterns, an abrupt reversible transition was observed at 120 K and 2 GPa from an HDA structure to a very high-density amorphous (VDHA) structure. Amorphous LiCl:6D2O can also be used as a route for incorporating substantial amounts of LiCl into the ice VII structure, leading to a modified material with structural properties that are significantly different to those of the host material [266].
The structure of liquid heavy water (D2O) was investigated by Strässle et al [267] using the diffractometer PEARL at pressures up to 6.5 GPa and temperatures up to 670 K. The results were interpreted using the EPSR method. The modelled oxygen–oxygen partial pair-distribution function gOO(r) was found to take a more simple-liquid like character as the pressure and temperature were increased, but a hydrogen bonded network was maintained. This general behaviour for the oxygen–oxygen pair-correlation functions has been confirmed by x-ray diffraction [268, 269]. We note that the translational and rotational diffusion coefficients of light water (H2O) along the 400 K isotherm at pressures up to 3 GPa have also been investigated by using quasi-elastic neutron scattering [270], employing a Paris-Edinburgh press with an annular gasket designed to reduce multiple scattering [271]. With increasing pressure, the translational diffusion coefficient was found to decrease markedly but the rotational diffusion coefficient showed little change.
11. Summary and future perspectives
This review has reported on recent progress in applying the method of in situ high pressure neutron diffraction to glassy and liquid materials. The information gained is, in general, complementary to that obtained from other in situ experimental techniques, as emphasised by considering the case examples of glassy B2O3 (section 5), SiO2 (section 6) and GeO2 (section 7). It has also been possible to apply the method of neutron diffraction with isotope substitution to gain site-specific information on the structures of glassy GeO2 and GeSe2 at pressures up to 8 GPa [32, 33]. In the case of GeSe2, this application was particularly important because conventional neutron and x-ray diffraction experiments yield essentially the same information (section 9). The role played by the oxygen-packing fraction in the structural transformations of glassy and liquid oxide materials under extreme conditions was discussed in section 8.
All of this information is enabling a more complete characterisation by experiment of the pressure-induced structural transformations in disordered materials. It is also allowing for a more severe test of the various models that have been proposed for these transformations, which often originate from an application of molecular dynamics methods. An approach using classical molecular dynamics is given in sections 5–7 where the aim is to develop transferrable interatomic potentials that can be used to predict the composition and pressure/temperature dependence of a material's properties. Another approach, using first-principles molecular dynamics, is described in section 9. Once an appropriate theoretical scheme has been found to describe the atomic interactions, the simulations can be used to give a more detailed appreciation of the mechanisms for pressure-induced network collapse and the accompanying changes to a material's physico-chemical properties.
One future development in the application of in situ high-pressure neutron diffraction to glassy and liquid materials will be the employment of heated anvil set-ups to access temperatures up to ≃550 K [272]. Access to higher temperatures requires an arrangement in which a heater is placed within the gasket of a pressure cell [31, 273]. An application of the latter to neutron diffraction work on disordered materials will, however, prove challenging because heater scattering will contribute to the measured diffraction patterns. The pressure range in neutron diffraction work can be extended to ≳90 GPa by using large-volume diamond anvil cells [274], although the volumes (∼0.02 mm3) are probably too small for their successful application to glasses and liquids. Notwithstanding, the continuing development of high-pressure instrumentation at central neutron scattering facilities will enable new opportunities for using neutrons as a structural probe of disordered materials under extreme conditions.
Acknowledgments
It is a pleasure to thank everyone who has contributed towards the in situ high-pressure neutron diffraction programme of research that has led to many of the results presented in this review, especially J W E Drewitt, D A J Whittaker, K Wezka, K J Pizzey, R F Rowlands and A Polidori in Bath; S Klotz in Paris; H E Fischer at the Institut Laue-Langevin (ILL); C L Bull and M G Tucker at ISIS; M Guthrie at the European Spallation Source (ESS); A C Barnes in Bristol; and M C Wilding in Aberystwyth. We gratefully acknowledge useful discussions with B Annighöfer at the Laboratoire Léon-Brillouin (LLB) about the properties of Ti-Zr, and W A Crichton at the European Synchrotron Radiation Facility (ESRF) for providing his x-ray diffraction work on Ti-Zr gaskets. We thank all of our molecular dynamics colleagues, including A Baroni, G Ferlat, M Micoulaut and M Salanne in Paris; Mark Wilson in Oxford; D Marrocchelli in Boston; and M Boero, A Bouzid, S Le Roux and C Massobrio in Strasbourg. We are also grateful to Liping Huang (Troy, New York) for pointing out [217]. The ILL is thanked for its support via long term proposal LTP-6-1 to develop high-pressure neutron diffraction methods on D4c, and the EPSRC is thanked for financial support via grant numbers EP/G008795/1 and EP/J009741/1.