

Abstract
In recent years, there have been several advances in the development of high-speed atomic force microscopes (HSAFMs) to obtain images with nanometre vertical and lateral resolution at frame rates in excess of 1 fps. To date, these instruments are lacking in metrology for their lateral scan axes; however, by imaging a series of two-dimensional lateral calibration standards, it has been possible to obtain information about the errors associated with these HSAFM scan axes. Results from initial measurements are presented in this paper and show that the scan speed needs to be taken into account when performing a calibration as it can lead to positioning errors of up to 3%.
Export citation and abstract BibTeX RIS
Introduction
National metrology institutes have directed considerable effort towards the characterization of conventional, commercial atomic force microscopes (AFMs) and the development of metrological AFMs (Danzebrink et al 2006). Independent from these activities, several groups around the world have concentrated on the development of high-speed atomic force microscope (HSAFM) where samples are imaged at multiple frames per second (fps), leading to so-called video rate AFM or HSAFM systems (Yacoot and Koenders 2011). A recent review by Ando (2012) showed some of the current developments in this area. These systems are particularly useful for biologists since they offer an unparalleled opportunity to examine real-time processes at the nanoscale, such as lipid bilayer formation or protein self-assembly, see Ando (2012) and references therein.
Dimensional metrology issues associated with HSAFMs have not been addressed since effort has been directed towards obtaining video rate images of predominantly biological samples where the interest has been concentrated on imaging live activities. However, if there is to be more widespread take-up of HSAFM from industry for the potential range of measurements that could be done with HSAFM (e.g. rapid measurement of surface topography), an understanding of the issues associated with obtaining quantitative data from HSAFM is necessary. Generally, HSAFMs are designed to be compact and light so as to raise the fundamental resonance frequency of each axis of the scanning stage as high as possible. This limits the range of nanometrology tools that can be integrated with HSAFM to improve measurement accuracy. Optical interferometers are one of the most tenable options; however, using interferometry for measurements of HSAFM stages raises issues of high bandwidth data acquisition (several tens of MHz) and as has been shown earlier from the development of metrological AFMs is a non-trivial issue (Haycocks and Jackson 2005). Alternative approaches need to be used that are more typically applied for providing traceability to commercial SPMs.
A very comprehensive characterization of the scan axes of a conventional, commercial AFM can be performed using two-dimensional (2D) gratings (Xu et al 2008). However, the effort required to perform this is probably beyond the scope of most users. Instead, a simpler set of routines can be used that provide a less rigorous albeit adequate characterization (Klapetek et al 2011). If the gratings are tilted, then information about the vertical axis can also be obtained. In this work, images of both 100 and 300 nm pitched gratings were obtained using the HSAFM at the University of Bristol in order to assess the performance of the HSAFM scan stage.
Instrumentation
There are different classes of HSAFM systems reported in the literature. First of all, most commercial AFM producers claim to have a high-speed system; however, their systems are usually not intended to produce more than 1 fps (of reasonable scan size and resolution). Special systems have been developed by different groups, including systems using fast z feedback with very stiff cantilevers and systems using contact mode deflection measurements with very soft and flexible cantilevers. The latter type was used in this study.
The contact mode HSAFM developed by Picco et al (2006) comprises a custom-built high-speed scan stage integrated into a Dimension 3100 AFM (Bruker, Germany). In this way, the Dimension 3100 provides the optical beam deflection detection system for the cantilever force sensor (Meyer and Amer 1988) and the vertical motion of the cantilever with respect to the sample. The original custom scanning stage is a one-dimensional (1D) design (Picco et al 2006), responsible for producing the fast scan oscillations, and requires the Dimension 3100 AFM head to produce the complementary slow scan motion necessary to create a high-speed raster scan pattern. Since that first report, the design of the high-speed scan stage has undergone several iterations to improve frequency response, vertical stability and scan range (Picco et al 2008, Pyne et al 2009). Figure 1 illustrates the alignment of the new, optimized 2D high-speed scan stage recently developed at Bristol. The key feature of the custom scan stage shown in figure 1 are the pairs of piezoceramic stack actuators, with a 15 µm range (P855.51, Physik Instrumente, Germany), used to scan the sample. Within each pair, the two piezos are operated 180° out of phase with one another. This results in a 'push–pull' motion on the sample located in the centre of the stage between both pairs of piezos. The fast and slow scan frequencies used during HSAFM are typically between 1–10 kHz and 1–30 Hz, respectively, enabling the collection of multiple frames per second in open-loop mode. The contact mode HSAFM maps topography using the deflection signal of the cantilever, while a z feedback loop operates at a 'per frame' rate to maintain a constant average load from frame to frame. The absence of a per pixel z feedback loop enables the contact mode HSAFM to achieve pixel rates up to 50 megapixels per second (Picco et al 2006).
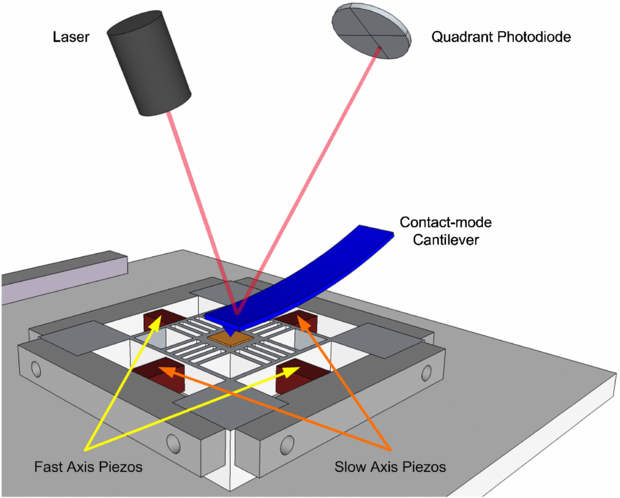
Figure 1. Schematic of the open-loop high-speed scan stage used in the Bristol HSAFM. The metal flexures restrict motion of the stage in the vertical direction, reducing unwanted z noise during scanning. The sample size is limited to a maximum of 2 cm.
Download figure:
Standard imageA common problem faced when attempting to increase the frame rate of AFM and HSAFM is the excitation of resonant modes of the scan stage due to higher harmonic components of the triangular drive signal (Schitter et al 2008). Even with a custom-built scan stage, it is still possible for unwanted resonances to occur while using triangular waveforms. Schitter et al (2008) overcome this limitation by employing input shaping techniques to remove these higher harmonic components from their drive signals directly. The open-loop high-speed scan stage used in the Bristol HSAFM avoids exciting these vibrations by driving the fast and slow scan axes with sinusoids rather than triangular waveforms. Cantilever deflection data are collected continuously, meaning that the sinusoidal waveforms result in a nonlinear distribution of data across the scan area, with greater pixel density towards the edges of the frame. This pixel distribution is linearized for display to the user as a standard contact mode image. To produce accurate trace and retrace images with the open-loop HSAFM scan stage, the user is required to set the phase of both fast and slow drive signals such that they synchronize with the continuous collection of the cantilever deflection signal correctly. In cases where there are significant and recognizable surface features in both trace and retrace line scans, this step can be performed with an automatic correlation routine.
Measurements
To assess the metrological performance of the system, we have obtained images of 2D 100 and 300 nm pitched gratings (nanosensors) and compared them to images and data obtained from a standard, calibrated AFM system (Bruker Dimension Icon calibrated at Czech Metrology Institute). The HSAFM system was used in two configurations: firstly, the original HSAFM configuration where the fast axis is actuated by the high-speed scanner and the slow axis supplied by the Dimension 3100 AFM (referred to as the 1D stage); and secondly, in the most recent configuration, where both fast and slow axes are actuated by the high-speed scanner (referred to as the 2D stage). Both were tested in order to quantify any advantages of the new 2D stage over the older 1D stage arrangement. A standard contact mode MSNL (Bruker, USA) cantilever chip was used and the cantilever selected for imaging was the 310 µm long triangle which has its first resonance at 7 kHz and a spring constant of 0.01 N m−1. The effect of different speeds (frame rates) on measured data was investigated. Data were collected on the contact mode HSAFM system at a bandwidth of 2 MHz.
Each calibration grating consists of a region with a well-defined set of periodic structures. Around these periodic features, there is a larger array of isotropically etched holes that act as a 'Find me' structure. Since the substrate is a silicon (1 0 0) surface, the etched holes are square with internal (1 1 1) faces having an angle of 54.735° with respect to the (1 0 0) surface. The angles obtained from the AFM data were compared with this predicted value. Both the grating itself and the surrounding 'Find me' structures were used in this investigation.
Data processing was performed using Gwyddion open source software (http://gwyddion.net) (Nečas and Klapetek 2012). The data from the HSAFM are obtained continuously in an open loop, and hence are not synchronized with the stage motion. The data loading and initial processing accounts for this using the following steps.
- –Data are loaded while adjusting the fast and slow axis offsets (phase) to get the trace/retrace and forward/backward scans in the same position—this ensures a basic synchronization.
- –One-dimensional FFT filtering is performed to remove signal contributions from the second and third eigenmodes of the cantilever vibration from the data. The benefits and justification for this process are reported elsewhere (Payton et al 2012b).
- –As data are scanned using a sinusoidal scanner motion instead of a sawtooth or triangular waveform, they are next fitted to equidistant positions along the fast axis (1D stage) or both axes (2D stage).
- –Data were calibrated in all three directions using the known grating pitch and slope angle of the pits.
A discussion of the potential influence of the above-mentioned data processing steps on metrological properties is given in the next section. Loaded and processed data were evaluated using extracted profiles along the fast axis (for slope determination) and by correlation with a single pit image (for pit position determination).
Results
Figure 2 shows the conventional and HSAFM images of a single etch pit from the 'Find me' structure. The high-speed image was obtained in 100 ms (corresponding to a frame rate of 10 fps). Periodic distortions can be observed in the high-speed image even after 1D FFT filtering of the HSAFM data because the large height variations encountered when imaging this 'Find me' structure excite eigenmodes higher than the third (which are not filtered from the image). The filtering introduces a recognizable image artefact in the form of a ghosting of surface features in the direction the tip is travelling (for example, as seen in figures 2(B) and 3(B)). However, despite this artefact of the notch filtering process, the overall shape of pit is well represented when compared with a conventional AFM image of the same feature collected with the same cantilever. In table 1, the slope values, as obtained from five different frames, are listed. Note that the 4 fps forward scan left slope was used for scanner calibration in the z-direction and therefore its value is accurate by definition. We can see that the measured angle is not dependent on scanning speed. On the other hand, for both forward and reverse directions, when the tip goes downwards (measuring the first facet of the pit it reaches on its way), the angle is, in all but one case, smaller than when going upwards (the second facet of the pit it reaches on its way). Detailed measurements by Payton et al (2012a, 2012b) using vibrometric measurements on the cantilever whilst imaging at high speed over similar surface features have shown that the tip remains in contact with the surface throughout HSAFM scanning. This suggests that tip asymmetry or the geometry between the tip and sample is responsible for the discrepancy in the measured slope between forward and reverse line scans, rather than any parachuting effect.
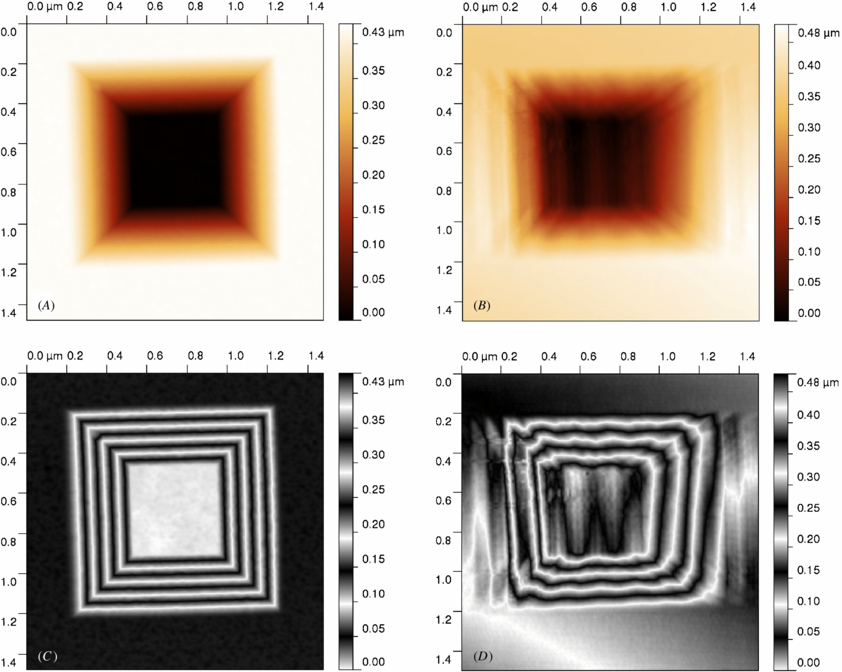
Figure 2. (A, C) Standard AFM (Dimension icon) and (B, D) 1D stage HSAFM measurement of a single pit forming 'Find me' structure on 300 nm grating. Two different false colour scales (A, B and C, D) for the same data are shown for illustration purposes.
Download figure:
Standard image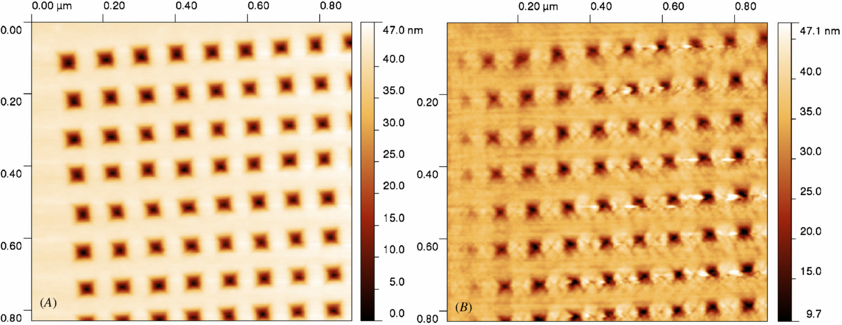
Figure 3. (A) Standard AFM (Dimension 3100) and (B) 1D stage HSAFM measurement (frames 0 and 40) of the same part of 100 nm grating. Note that the irregularities can be seen on both (best seen in the top left hand corner).
Download figure:
Standard imageTable 1. Grating pit slope values for forward and backward scans and three different speeds. The downward tip direction for every scan direction is marked in bold.
| 4 fps forward Left slope | 4 fps reverse Right slope | |
|---|---|---|
| 4 fps/forward | 54.7 ± 0.5 | 57.5 ± 0.3 |
| 4 fps/reverse | 57.9 ± 0.5 | 51.2 ± 0.6 |
| 10 fps/forward | 54.0 ± 0.2 | 53.7 ± 0.6 |
| 10 fps/reverse | 56.9 ± 0.6 | 51.0 ± 0.3 |
| 20 fps/forward | 54.7 ± 0.8 | 57.9 ± 0.7 |
| 20 fps/reverse | 58.8 ± 1.6 | 56.7 ± 1.2 |
In figure 3, a comparison of images of the corner of a grating is shown as measured using both conventional AFM and HSAFM. The normal AFM scan rate was set at three lines per second with typical PID feedback values, while the HSAFM used a frame rate of 10 fps and no pixel-by-pixel feedback. Note that there are significant irregularities seen on the grating, observable in both the classical and high-speed images. Some of these, such as the misalignment of the first square in the second row, can be associated with the grating, while the apparent curvature in the image taken with the normal speed AFM is more likely to be due to scanner bow. These local errors in the grating mean that in practice when working with the uncompensated piezos present in both the Dimension 3100 and the HSAFM, this sample can be used for calibration only if the same area is measured using a metrological AFM prior to imaging on a high-speed system.
From the point of view of a lateral calibration, it is important to discuss how the measured grating topography is affected by speed, i.e. by different scan stages, any dependence of tip–sample interaction on scanning speed and how the measured grating topography is stable in time if multiple frames are acquired. Figure 4 demonstrates that the dependence on scan speed is quite weak, showing HSAFM images of the calibration grating collected at 4, 10 and 20 fps. The fixed 1 MS s−1 sampling rate meant that the scan size in figure 4(C) was reduced in order to maintain a minimum lateral pixel resolution of better than 1 pixel per 10 nm even while scanning at 20 fps.

Figure 4. Two-dimensional stage HSAFM measurement of a 100 nm grating, three different frame rates: (A) 4 fps, (B) 10 fps, (C) 20 fps. Note the different magnification for different frame rates.
Download figure:
Standard imageTo see how the grating pit positions vary with time, we have evaluated pit positions for 20 sequential frames obtained at three different velocities: 4, 10 and 20 fps. The data, showing only pit centres accumulated over all the frames, are shown in figure 5. We can see that the variance is very small, corresponding to the grating pitch variance of about 3%. This gives us an estimate of how precise the high-speed scanner could be if it were calibrated. The results also show that a calibration needs to be performed for every speed at which the AFM will be operated.

Figure 5. Grating pit positions evolution in time for 2D HSAFM stage, three different velocities: (A) 4 fps, (B) 10 fps, (C) 20 fps. Grating pit positions of 20 successive frames are shown always together in single image.
Download figure:
Standard imageFor all three velocities, we found that the scanning system is stable. If the presented grating-based approach was to be used for system calibration, it would be expected that the calibration parameter uncertainty due to time variation of the performance of the stage would be below 1%. This is a much smaller value than we would expect from other sources discussed below.
Discussion
The measurements have highlighted a number of issues associated with the fast scanning system.
To make the system traceable in the x- and y-axes (as would be required for e.g. critical dimension measurements), it is necessary to first determine the long-term dependence of scanning range on the driving system values. At present, lateral range values are unknown in the tested HSAFM setup and the system magnification is controlled only by the amplitude of the sinusoidal driving signal. The sinusoidal signal used to drive the piezos is treated as 'ideal', assuming the high-voltage amplifiers are powerful enough to drive the piezo actuators without any distortion of the sine waves. However, due to both the mechanical and electrical properties of the complete setup, it cannot be expected that the same amplitude of driving signal will result in the same magnification of the HSAFM image across a range of scan frequencies. If the system was calibrated on the basis of many measurements of the calibration grating at different scanning speeds, it would be possible to determine the reproducibility of the scanning stage, both in terms of position and errors on a day-to-day basis. In theory, adding interferometers to the scanning system for position monitoring or to make the system closed loop would help address this issue. This would, however, raise high-speed synchronization and data acquisition issues with additional technical challenges of their own.
Regarding the z-axis, the cantilever bending versus displacement needs to be determined if height values are to be obtained. When using a cantilever deflection detection system of the Dimension 3100 (which has a measurement bandwidth of 2 MHz), this is, in principle, not easy because both the cantilever and the quadrant photodiode are nonlinear, and not always aligned in the same way. The complexity of obtaining quantitative data from beam deflection systems rather than just using them as a null sensor has been discussed by Beaulieu et al (2007) and Xu et al (2009). Filtering of the HSAFM data to remove higher eigenmode contributions to the deflection signal can significantly affect height data when using a beam deflection system. The higher eigenmodes of the cantilever are excited during HSAFM, as reported by Payton et al (2012a, 2011) and notch filters applied at the resonance of the second and third eigenmode frequencies remove their contribution to the deflection signal data. Without these filters, or a detection system which measures the vertical displacement of the cantilever tip directly (Payton et al 2012a), the contributions to the deflection data from these higher eigenmodes can obscure the real topographic information.
Another problem that affects x, y and z calibrations is the possible tip and sample damage as shown in figure 6 where the regions of the calibration grid that were examined using the HSAFM are visibly marked and areas of aggregated debris can be observed at the periphery of the scans. However, it is unclear how much of the debris was due to removal of contamination on the substrate and how much was due to substrate material being removed. Since it is likely to be material dependent, this is a much more complex issue that cannot be fully addressed here because a set of measurements under many different imaging conditions would be needed.

Figure 6. A standard AFM (Dimension icon) image of a 300 nm grating corner region after performing multiple HSAFM measurements. Note the visible surface changes and a debris at the periphery of scans.
Download figure:
Standard imageFinally, when processing data, it is necessary to manually adjust the phase offset between the forward and reverse images until trace and retrace lines of the same features line up. This can fail as the forward/reverse images are in principle not the same due to torsional bending and ringing artefacts at the end of a scan line. Moreover, if the phase matching fails, it leads to significant distortion of data because a compensation to a nonlinear function (the sinusoidal drive signal) is performed to linearize the data. This phase adjustment is a subjective process that could potentially be automated if the sine signal used to drive the piezos for the fast axes was also recorded. The control software has subsequently been modified to do this which should help processing of future data.
Conclusions
It has been shown that using a two-dimensional calibration standard, it is possible to obtain information about the performance of the scanning system in an open-loop HSAFM. The distortion of the grating is to some extent dependent on the scanning speed, but the reproducibility of the measurements made at a particular scanning speed is high. It is necessary to perform a calibration at each speed at which the HSAFM will be operated as variations in the position of pits on the grating of up to 3% were observed when making measurements at different speeds. The system would be improved if the stage could be operated in closed loop and work is in progress to realize this goal.
Disclaimer
The naming of any manufacturer or supplier by CMI, NPL or The University of Bristol in this scientific journal shall not be taken to be either CMI's, NPL's or The University of Bristol's endorsement of specific samples of products of the said manufacturer, or recommendation of the said supplier. Furthermore, CMI, NPL and The University of Bristol cannot be held responsible for the use of, or inability to use, any products mentioned herein that have been used by them.
Acknowledgments
PK would like to thank NPL for funding from the NPL International office for his secondment to the UK. AY and PK thank the University of Bristol for support from the open access grant for high-speed AFMs. PK also would like to thank project of Ministry of Industry and Trade of the Czech Republic under contract FR-TI 1/241. ©2012 Crown copyright.