
Abstract
Analysis of nanoparticles is often challenging especially when they are embedded in a matrix. Hence, we have used laser-assisted atom probe tomography (APT) to analyze the Au nanoclusters synthesized in situ using ion-beam implantation in a single crystal MgO matrix. APT analysis along with scanning transmission electron microscopy and energy dispersive spectroscopy (STEM-EDX) indicated that the nanoparticles have an average size ∼ 8–12 nm. While it is difficult to analyze the composition of individual nanoparticles using STEM, APT analysis can give three-dimensional compositions of the same. It was shown that the maximum Au concentration in the nanoparticles increases with increasing particle size, with a maximum Au concentration of up to 50%.
Export citation and abstract BibTeX RIS
With the increasing interest in utilizing the fascinating properties of nanoscale materials, especially in particulate form, in a variety of fields including energy, environment and biomedical applications, the need for their precise characterization is also gaining importance. However, the characterization of nanomaterials is more challenging relative to their coarse counterparts [1, 2] because of their sensitivity to the environment. In the case of nanoparticles, significantly higher surface energy and reactivity often result in chemically transformed (through reactions with the environment) and physically agglomerated structures. This might often result in a significant reduction of properties available under the nanoscale. To mitigate this behavior, it is a common practice to use a capping layer to separate the nanoparticles from the environment by either functionalizing them with organic molecules or embedding them in inorganic shells [1]. In order to successfully exploit the beneficial characteristics of such nanoparticles, it is highly desirable to obtain as much information as possible, including their size, shape and composition with high spatial and chemical resolutions. In situ spectroscopy and imaging capabilities have proven to be effective in providing such information. However, it is often challenging to obtain sub-nanoscale spatial resolutions with such capabilities while correlating the results with the structure. Although progress in aberration-corrected scanning transmission electron microscopy (STEM) could partially fill this gap [2], there is an increasing need for a combination of multiple techniques to obtain a comprehensive analysis of the material of interest. The development of laser-assisted, three-dimensional atom probe tomography (APT) is promising for tackling such characterization challenges. Further, combination of APT with high-resolution TEM/STEM will provide the much desired structural and chemical analysis of nanoparticles with sub-nanoscale resolution and parts per million chemical sensitivity [3–6].
Evolving from the well-known field ion microscopy concept [6], APT is in principle a combination of point-projection microscopy and time-of-flight mass spectrometry. Several research groups have reviewed the progress of the technology along with the finer details of data processing, data acquisition and 3D reconstruction in the recent past [5, 7–13]. A simplified APT process flow diagram is provided in figure 1.

Figure 1. APT process flow diagram.
Download figure:
Standard imageThe chemical identity of the samples can be effectively determined with atomic-scale spatial resolution with a field-of-view on the order of 100 × 100 × 100 nm3 in APT experiments. The dual-beam focus ion beam lift-out technique (FIB-LO) is widely used to prepare a sharp tip with approximately 100 nm diameter and a uniform shank angle which is welded to a preformed Si-post (specific to the LEAP® system) using Pt [14]. The sharpened tips are introduced into the main-analysis chamber of the APT system under UHV conditions. A 542 nm laser pulse is applied, using the LEAP 3000 X HRTM system, under a standing voltage, and the evaporating ions are analyzed with the help of a reflectron-type detector system for improved mass resolution. The data obtained from the experiment is reconstructed to obtain a 3D chemical image. The reconstructed three-dimensional structures obtained can be further analyzed in detail for the composition and size of various features of interest in a given sample with the help of various analysis methods. It is worth mentioning here that due diligence is required from the analyst while interpreting the data. In order to ensure that the reconstructed data is artifact free, it is desirable to use complimentary microscopy analyses when possible, in particular HRTEM and STEM, to aid in the selection of accurate reconstruction parameters for APT.
This paper summarizes the initial results from the APT analysis of Au nanoparticles embedded in a MgO matrix. These nanoparticles are synthesized in situ by ion-beam implantation at elevated temperatures, followed by high temperature annealing [15, 16]. The results clearly demonstrate that the dimensions of the particles obtained from APT 3D reconstructions are equivalent to those obtained from TEM and STEM analyses. APT results also indicate that the composition of the Au nanoparticles is size dependent and the amount of Au increases with increasing particle size. We utilize the results here to emphasize the potential of APT to provide 3D chemical images and compositional profiles of the nanoparticles with sub-nanometer resolution.
1. Experimental work
Single crystal MgO(100) substrates were cleaned in acetone/methanol in an ultrasonic bath prior to placement in the implantation chamber. Implantation was carried out using 2 MeV Au2+ ions using a 3.0 MV tandem accelerator located in the EMSL at the Pacific Northwest National Laboratory (PNNL). The Au2+ ions were implanted at 7° to the normal at a dose in the range of 7 × 10¹⁶–1.4 × 10¹⁷ Au2+ cm−2 at a substrate temperature of 975 K and, subsequently, the samples were annealed in a tubular furnace for 10 h at 1275 K followed by furnace cooling. The samples for APT and STEM analysis were prepared using a standard lift-out method in a dual-beam FIB system (FEI Helios Nanolab). Annular milling was used to obtain the APT tips and a low-kV clean up step towards the end was used to ensure minimal Ga impurities, if any. The details of sample preparation are beyond the scope of this paper and the readers are recommended to follow Thompson et al [14]. The tips are mounted on a pre-sharpened silicon micro-tip array, which is further introduced into the LEAP 3000X HR system. This system utilizes a green laser with a femtosecond pulse and the analysis chamber is maintained under UHV conditions. The experiments are typically carried out at ∼ 50 K specimen temperature and the voltage is increased to continuously achieve a constant evaporation rate of about 0.5%. Initial experiments were carried out to optimize the laser pulse energy to provide artifact free images. The laser pulse energies were systematically varied from 0.3 to 0.8 nJ, at 0.1 nJ increments. Five million data points were collected at each pulse energy and the data is reconstructed to verify features such as matrix stoichiometry, the peak shapes and distribution. It was observed that the data obtained at 0.3 nJ yields stoichiometric MgO and hence could be optimum within the experimental range. The reconstructed data was analyzed to get the composition of the individual Au nanoparticles within the MgO matrix, and the distribution of Au, Mg, and O was studied as a function of particle size. Scanning transmission electron microscopy analysis was carried out at FEI Company, Hillsboro, OR. on a representative atom probe sample and the elemental profiles have been obtained for Mg, Au and O using energy dispersive x-ray spectroscopy (EDX). The size of the nanoparticles from the TEM analysis was compared with that from APT.
2. Results and discussion
The implantation conditions have been optimized previously [15, 16], to ensure in situ nanocluster formation with the help of HRTEM analysis. One of the key observations was the need to carry out implantation at elevated temperature and post-implantation annealing at 1000°C to obtain well-defined nanoparticles, in situ. This was also required to ensure that the radiation damage due to the high-energy implantation was reduced significantly. Wang et al [15] have discussed the formation of quantum anti-dots as a result of vacancy clustering in Au–MgO systems. Diffraction analysis was also carried out to understand the crystallographic relationship between the Au clusters and the MgO matrix; however, the authors have not presented any compositional analysis in these studies. As the chemistry of these clusters often controls the final properties, we have analyzed the Au-implanted MgO samples with APT.

Figure 2. 3d atom maps, 230 × 220 × 400 nm3 reconstructed volume, representing Au nanoparticles (red color) in MgO obtained through APT analysis.
Download figure:
Standard imageA representative 3D reconstructed image, 230 × 220 × 400 nm3, of the Au–MgO sample is shown in figure 2. The iso-concentration surface analysis revealed pronounced clustering behavior for the Au ions, as shown by the red colored particles, whereas the same was not observed in the case of Mg or O species. It is apparent from the figure that the Au clusters were not present in the top 200 nm under the surface of the MgO. Under the given implantation conditions, the Au concentration is supposed to follow a broad Gaussian profile, with a peak around 300–400 nm. Since the tips were made to include the unimplanted region between the surface and implanted region we did not observe any Au evaporation in the initial stages during APT analysis of these tips. The number density of Au particles was found to increase towards the peak Au concentration in the implanted region as did the average cluster size. STEM-EDX maps from a similar, representative, APT tip are presented in figure 3. Both APT and STEM-EDX results clearly demonstrate that the dimensions of the Au nanoparticles are similar at ∼ 8–12 nm.
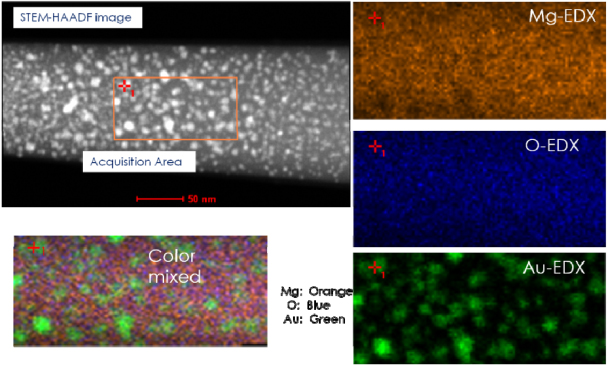
Figure 3. STEM dark-field image and EDX atom maps corresponding to Mg, O and Au indicating nanocluster formation inside the MgO matrix.
Download figure:
Standard imageWhile STEM-EDX analysis is powerful, the very nature of the TEM hinders the precise chemical analysis of the Au nanoclusters, as a result of shadowing effects through the sample thickness. The complications increase further in attempting to obtain tomographic images of such small features in TEM. However, layer-by-layer evaporation during APT analysis enables the observation of clearly resolved Au nanoparticles under appropriate evaporation conditions. The 2D projection of 3D APT reconstruction is provided in figure 4(a), only 10% Au-iso-concentration surfaces are shown here for reasons of clarity. Each individual iso-concentration surface chemically identifies the nanoparticle and composition variations are analyzed with the help of proximity histograms and 1D concentration profiles. Iso-concentration surfaces are user-defined envelopes corresponding to a specific concentration threshold within the concentration space and hence could be treated, more than just as graphical objects, as real features in the sample for further analysis. The proximity histogram represents the concentration of various species as a function or proximity from a chosen interface and hence is extremely sensitive to interfacial segregation and intermixing at phase boundaries [17]. Often the proximity histograms are obtained for a selected isosurface. The 1D concentration profile takes all ions within a chosen region of interest (ROI) and displays the % composition at a calculated distance in the direction of the axis of the ROI [17, 18]. While the iso-concentration surfaces help us identify the nanoparticles within the matrix, 1D concentration profiles are utilized to analyze the composition of the nanoparticles. 10% Au-iso-concentration surfaces have been outlined to represent the nanoparticles. The 1D concentration profiles of the individual nanoparticles are obtained by choosing a cylindrical ROI (1 × 1 × 25 nm3) passing through the center of each nanoparticle. Selected profiles from nanoparticles with small, medium and larger dimensions are provided in figure 4(b). It should be noted that the sizes of the clusters are identified in 'nm3'(i.e. volume) as not all of them have the same shape. It is immediately evident from the figure that the amount of Au increases with increasing particle size, with a peak Au concentration for the largest particle at ∼ 50%. It can also be observed from the plots that the concentration of Au gradually increases and hits the peak, resulting in a plateau at ∼ 50%. It is also clear from the plot that the size of the Au particles increased with increasing Au concentration in the MgO matrix, i.e. the size of the particles also follows a Gaussian, similar to the Au2+ dose.

Figure 4. (a) 10% Au-iso-concentration surfaces representing the nanoparticles obtained through APT reconstruction. (b) Concentration profiles obtained from nanoparticles of different sizes, indicating the gradual increase in the maximum Au concentration with increasing nanoparticle size. The concentration profiles are obtained with the help of cylindrical ROI passing through the center of the iso-concentration surfaces.
Download figure:
Standard imageWith the advent of laser pulsing in atom probe tomography, there has been an increasing interest in analyzing semiconductor and oxide materials [19–21]. While a sizable number of studies are available on semiconducting materials, the reports on oxides are relatively sparse [22]. Mazumder and Tsukada [23, 24] have reported the evaporation characteristics of MgO in thin film and bulk crystal forms. They have suggested a possibility of more than just thermal effects from the laser pulse for the evaporation of atoms during atom probe experiments. It is proposed that the accumulation of holes near the tip apex can significantly reduce the field evaporation barrier. In the present work, we have seen a significant influence of the laser pulse energy on the stoichiometry of MgO. While 0.3 nJ pulse energy resulted in almost stoichiometric MgO (Mg:O—52.36:46.56 at.%), the experiments carried out at higher pulse energies resulted in unusual, complex MgxOy species and their clustering. Hence, most of the analysis is focused on the data set collected at 0.3 nJ. All the Mg isotopes have been clearly identified with a full-width half-maximum mass resolving power of 770 and a full-width tenth-maximum mass resolving power of 350, indicating that the compositions obtained are reliable (mass spectrum not shown here). As the focus of the present study is to understand the ability of APT to analyze embedded nanoparticles, the details of MgO evaporation characteristics are not discussed here.
Embedded nanoparticle analysis is not completely new to the APT community as one of the most widely studied systems using APT is the oxide dispersion strengthened (ODS) steels, where oxide nanoparticles are dispersed in a steel matrix [25]. Researchers have often used APT data to obtain the chemistry of the nanoscale oxide precipitates in the case of ODS steels. One of the major challenges in the case of ODS systems is the ability to precisely determine the composition of the ultra-small oxide particles while still ensuring that there is no influence of the matrix overlapping effects. The presence of matrix elements in these nanoparticles was often ascribed to the overlap of the trajectories of the various evaporating elements from the atom probe specimen. After diligent efforts by different groups, it was noted that some of the trajectory overlap related artifacts may not influence the core of clusters of size more than 4 nm [22]. We utilize this information to explain the observed intermixing of Au, Mg and O in the nanoparticles reported in this manuscript.
As the majority of Au nanoparticles analyzed in the present work are larger than 4 nm, it is logical to accept the composition of the nanoparticles obtained using APT analysis. Further, we have also optimized experimental parameters such as laser pulse energy to obtain a stoichiometric matrix (MgO) composition. However, it is premature to propose an exact field evaporation mechanism without further studies. Although the laser pulse energy of 0.3 nJ suggests mixing of Au and MgO in the particles, the characterization using pulse energies lower than 0.3 nJ could not be established because of the lower limit achievable with the green laser. Studies are currently in progress to carry out both APT analysis using significantly lower laser pulse energies with a UV laser and HRSTEM on the same tip to understand whether there is intermixing of Au and MgO in the particles. It will be interesting to compare the results from the present study, using a green laser, with those obtained from UV-laser pulsing. This will help decipher plausible mechanisms of field evaporation in the case where conducting nanoparticles are present inside a dielectric matrix and also clarify the reasons, if any, for the presence of Mg and O in the nanoparticles. At this point, it is logical to propose that the laser-assisted atom probe tomography analysis has the capability to analyze embedded nanoparticles and provide three-dimensional chemical images with unprecedented spatial resolution and chemical sensitivity. We also emphasize that there exists a need for detailed experiments to establish the right parametric space and to include complementary analytical techniques such as, primarily, HRTEM and STEM.
Acknowledgments
A portion of the research was performed using EMSL, a National Scientific User Facility sponsored by the Department of Energy's Office of Biological and Environmental Research and located at Pacific Northwest National Laboratory (PNNL). Funding support was provided by the Chemical Imaging Initiative at PNNL. The authors would like to acknowledge help from M Nandasiri and R Sanghavi during the course of this project.