
Abstract
Especially for ageing aircraft the development of fatigue cracks at fastener holes due to stress concentration and varying loading conditions constitutes a significant maintenance problem. High frequency guided waves offer a potential compromise between the capabilities of local bulk ultrasonic measurements with proven defect detection sensitivity and the large area coverage of lower frequency guided ultrasonic waves. High frequency guided waves have energy distributed through all layers of the specimen thickness, allowing in principle hidden (2nd layer) fatigue damage monitoring. For the integration into structural health monitoring systems the sensitivity for the detection of hidden fatigue damage in inaccessible locations of the multi-layered components from a stand-off distance has to be ascertained. The multi-layered model structure investigated consists of two aluminium plate-strips with an epoxy sealant layer. During cyclic loading fatigue crack growth at a fastener hole was monitored. Specific guided wave modes (combination of fundamental A0 and S0 Lamb modes) were selectively excited above the cut-off frequencies of higher modes using a standard ultrasonic wedge transducer. Non-contact laser measurements close to the defect were performed to qualify the influence of a fatigue crack in one aluminium layer on the guided wave scattering. Fatigue crack growth monitoring using laser interferometry showed good sensitivity and repeatability for the reliable detection of small, quarter-elliptical cracks. Standard ultrasonic pulse-echo equipment was employed to monitor hidden fatigue damage from a stand-off distance without access to the damaged specimen layer. Sufficient sensitivity for the detection of fatigue cracks located in the inaccessible aluminium layer was verified, allowing in principle practical in situ ultrasonic monitoring of fatigue crack growth.
Export citation and abstract BibTeX RIS

Content from this work may be used under the terms of the Creative Commons Attribution 3.0 licence. Any further distribution of this work must maintain attribution to the author(s) and the title of the work, journal citation and DOI.
1. Introduction
Structural health monitoring (SHM) systems have the potential to improve safety and reliability for aircraft in a cost-effective way, integrating non-destructive testing (NDT) and embedded sensors in the structural materials [1]. Especially for ageing aircraft the development of widespread fatigue damage at fasteners due to stress concentration and varying loading conditions represents an important problem [2, 3]. A range of NDT methods has been developed for the detection and monitoring of fatigue cracks [4]. The detection sensitivity of different NDT techniques depends both on the methodology and access to the fatigue damage location, as well as the geometry of the structure. Good sensitivity for small fatigue cracks has been reported [5], e.g., using ultrasonic through transmission [6]. However, typically aircraft skins consist of adhesively bonded structures where local lack of sealant between the metallic layers and the complexity of the received ultrasonic signals can lead to reduced damage detection sensitivity [7, 8]. For defects in the 2nd layer with access restricted to the outside of a multi-layer aircraft structure, the detection of fatigue cracks and notches with lengths above 1 mm has been reported. In a study comparing different sensor systems for subsurface cracks in lap joints (cited in [4]) a threshold value of 3.8 mm was reported. The sensitivity and probability of detection for subsurface cracks in multi-layered structures needs to be improved [4]. For a whole-life approach reliable detection, sizing and monitoring would be required. Not all methods fulfil the requirements for integration into a SHM system [1], as they either require local access (e.g., within the fastener hole [4, 8]) or have very limited range.
Guided ultrasonic waves have been proposed for SHM systems, as with suitable mode and transducer selection, they can propagate over long distances in thin structures and thus offer the large area coverage envisaged [9]. The fundamental modes (A0 and S0) below the cut-off frequencies have been investigated [10, 11], as they offer simpler transduction [12], signal processing, and typically lower attenuation [13]. The interactions with damage as well as the appropriate damage monitoring strategy were investigated [14]. The guided wave scattering at fatigue damage at holes has been investigated [15]. Ultrasonic guided wave transducers working at low frequency were used to monitor a series of through holes with multiple crack initiation sites [16]. The automated detection of fatigue cracks in metallic materials based on the definition and evaluation of a damage vector has been demonstrated [17]. Numerical and experimental studies were performed to predict the sensitivity for damage detection in aerospace components [18]. For multi-layered structures the range due to attenuation [13] and the sensitivity for hidden fatigue cracks has been studied [19], and found to be sufficient for the detection and monitoring of large cracks as the employed wavelengths are typically large. Guided ultrasonic waves have been investigated for the monitoring of adhesively bonded structures. The stiffness and thickness of the adhesive layer influence the dispersion relations of different modes to different extents [20]. It has been shown that the viscoelastic adhesives contribute to the dampening of the higher modes which exist in multi-layered plate structures [21]. The existence of coupled Rayleigh-like waves in adhesively bonded lap and stringer joints as a result of mode conversions from an incident S0 mode has been noted [13].
As for aerospace structures the areas of high stress concentration are typically known, higher frequency guided waves offer a potential trade-off between smaller monitoring range and improved sensitivity for small defects. Surface acoustic waves have been used for the online monitoring of fatigue cracks [22]. High frequency guided waves have been employed to detect corrosion in aircraft panels [23], defects in plates [24], as well as fatigue cracks in single metallic layers [25]. Good sensitivity for the detection and monitoring during cyclic loading has been reported [25], employing a combination of the fundamental guided wave modes at a frequency thickness product of 6.75 MHz mm [26]. In this frequency range, the wavenumbers of the fundamental modes are asymptotic to that of the Rayleigh wave [27]. The interference between the wave modes causes a recurrent shift of the distribution of energy across the specimen thickness and thus influences the effectiveness for flaw detection [26]. It has been proposed to utilize this characteristic for the inspection of inner surfaces of pipelines for corrosion [28]. Suitable modes for the inspection of different layers of multi-layered structures can be found employing a mode-tuning technique [29]. For multi-layered aircraft structures high frequency guided wave modes have been shown to be sensitive for the detection of manufactured notches [30, 31], but a proper understanding of the wave propagation characteristics is required.
In this contribution high frequency guided wave modes were employed for the detection and monitoring of fatigue crack growth during cyclic loading in a laboratory environment. The fundamental Lamb modes were excited at about 6.25 MHz mm using a standard piezoelectric wedge transducer placed at a stand-off distance from the fastener hole. The guided wave signal was monitored both using a noncontact laser interferometer close to the defect for improved sensitivity and using standard pulse-echo signals from a stand-off distance for the detection of hidden fatigue cracks without access to the damage.
2. Experiments
2.1. Multi-layered tensile specimens
Eleven multi-layered tensile specimens were fatigued during cyclic loading (two different sets of five specimens for the monitoring measurements shown in sections 4 and 5, one specimen for the measurements shown in section 3). The specimens consist of two adhesively bonded aluminium plates with a length of 600 mm and a width of 70 mm to fit into the employed servo-hydraulic testing machine (figure 1). The material of the 3 mm thick plates is the aerospace grade aluminium alloy 2014 T6 (Young's modulus: 73.1 GPa, density: 2800 kg m−3, Poisson's ratio: 0.33, fatigue strength: 124 MPa (completely reversed stress, R = −1), tensile yield strength: 414 MPa). The sealant is the two-part structural paste adhesive Hysol EA 9394 (Young's modulus: 4.237 GPa, density: 1360 kg m−3, Poisson's ratio: 0.45). Approximately 4% volume fraction of spacer glass beads (maximum diameter: 0.249 mm) were added to the adhesive paste to control the thickness of the sealant layer. The specimens were clamped by a mechanical jig over 24 h for the adhesive to cure at room temperature according to the manufacturer instructions. The sealant thickness was measured along the centre line using a digital micrometre and found to have a standard deviation of less than 6% relative to the nominal thickness of 0.25 mm (range: 0.22–0.26 mm). The fastener hole with ¼ inch diameter (6.35 mm) was drilled 200 mm from one end of the specimen on the specimen centre line as shown in figure 1.

Figure 1. Schematic of experimental setup and multilayer specimen.
Download figure:
Standard image High-resolution image2.2. Fatigue crack growth during cyclic loading
The specimens were subjected to cyclic tensile loading in a servo-hydraulic testing machine with the loading axis parallel to the specimen length. For the specimen geometry the stress concentration factor at the side of the through-thickness hole is approximately 2.75 (compared to average stress level). Therefore a maximum load of 54 kN was selected so that the maximum stress in the aluminium plates at the side of the hole was just below the yield strength of the material, to avoid plastic deformation on the undamaged side. The cyclic loading was performed with a stress ratio R = 0.1 and a cycling frequency of 7 Hz. A small triangular notch (45° to specimen back surface and hole) of approximately 0.4 mm length and depth (range: 0.32–0.54 mm) was introduced using a very fine file at 90° to the axis of tensile loading to prescribe the location of fatigue crack initiation. The stress level at the side of the hole (and starter notch) was well above the fatigue strength of the material. The cyclic loading was interrupted every 1000 cycles, holding the specimen under maximum tensile load to avoid crack closure during the ultrasonic measurements. Further measurements should investigate the relevance of the load (and the resulting crack opening) on the ultrasonic signals and thus detection sensitivity for fatigue cracks. The crack size was measured optically on the damaged specimen surface (crack length) and through the hole thickness (crack depth) by means of an optical microscope. Typical photographs of the observed fatigue crack growth are shown in figure 2 for one specimen.
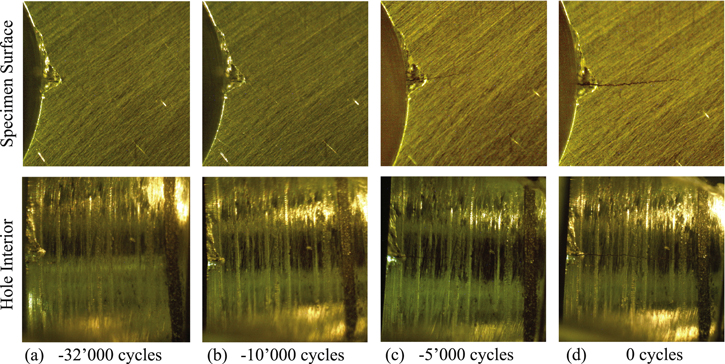
Figure 2. Microscopy photographs taken during fatigue cycling on specimen surface and within fastener hole: (a) −32 000 cycles (baseline measurement), no crack; (b) −10 000 cycles, crack length 0.77 mm, crack depth 0.85 mm; (c) −5000 cycles, crack length 1.32 mm, crack depth 1.53 mm; (d) zero cycles, crack length 2.49 mm, crack depth 3.00 mm (through aluminium layer).
Download figure:
Standard image High-resolution imageThe number of cycles has been normalized so that zero cycles represents the measurement when the crack was observed to have grown through the damaged aluminium layer (depth = 3 mm). This allowed a better comparison of the crack growth for the different specimens as the growth rate was found to be repeatable [25], while crack initiation was found to vary between specimens. During fatigue testing the crack grew quarter-elliptically from the starter notch position to a depth (and approximate length) of 3 mm, corresponding to the thickness of one of the aluminium plates. No cracking of the other aluminium plate was observed with the crack depth not increasing beyond the sealant layer (figure 2). The crack length on the specimen surface continued to grow and for the calculation of the crack area it was assumed that the crack had grown through the thickness of one aluminium plate with uniform length through the thickness. The measured crack length, depth, and area for the same specimen as in figure 2 are shown in figure 3. The crack was first optically observed at −11 000 cycles with a length of 0.51 mm and a depth of 0.62 mm.
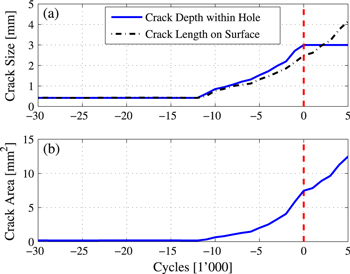
Figure 3. Typical optically measured crack growth during fatigue cycling; (a) crack length (dashed–dotted, black) on specimen surface and crack depth (solid, blue) within fastener hole; (b) crack area; zero cycles (dashed, red) indicates crack through damaged aluminium layer.
Download figure:
Standard image High-resolution image2.3. High frequency guided ultrasonic wave measurements
Three different types of ultrasonic experiments were performed to measure the influence of a fatigue crack on the scattered wave field, to monitor fatigue crack growth using a non-contact laser measurement close to the defect location, and to perform a standard pulse-echo measurement for the monitoring of hidden fatigue crack growth from a stand-off distance. For all measurements the excitation transducer was a half inch piezoelectric transducer with 1 MHz centre frequency (KB Aerotech), mounted on a 90° angle beam perspex wedge for steel. The wedge angle was 4° smaller than the optimal angle for Rayleigh wave excitation in the aluminium material of the multi-layered tensile specimens. Using a bracket, the wedge was clamped (Propylene glycol couplant) to the centre line of the specimen on the surface opposite the starter notch at a distance of 225 mm from the fastener hole, so that the main wave propagation line crosses the centre of the hole (figure 1). It had been found previously [31] that this transducer configuration excited both the fundamental anti-symmetric and symmetric modes A0 and S0, as well as the higher A1 mode. For the multi-layer specimen the A0 mode shape consists of an individual bending of the two aluminium adherents (in-phase), while the S0 mode shape is characterized by elongation and compression in the in-plane direction. Both modes have a significant displacement gradient in the weaker sealant layer. The higher A1 mode has a more complicated mode shape, lower group velocity, and is dispersive in the frequency range of interest, i.e., it spreads in time and it amplitude reduces significantly. The fundamental modes A0 and S0 were found to show low dispersive behaviour with a small difference in both the phase and group velocities and can propagate over medium distances with a strong pulse [31]. Due to the small difference in the phase velocities an interference (beating) between the modes occurs, leading to an amplitude variation along the propagation path. The stand-off distance of 225 mm was chosen as approximately 1.5 times the beatlength at 1 MHz for the specimen thickness [31], so that the energy of the incident wave is optimized on the damaged aluminium plate at the expected crack location (starter notch). For different stand-off distances the guided wave energy distribution through the specimen thickness and thus sensitivity for defect detection varies depending on the depth profile.
For the first two sets of experiments the excitation signal was generated using an arbitrary function generator (Agilent 33220A) as a ten cycle tone burst with a centre frequency of 1 MHz in a Hanning window. The signal was amplified using a power amplifier (T&C AG 1006) to achieve a strong wave excitation with a narrow frequency bandwidth. The velocity of the out-of-plane displacement component on the specimen surface containing the fatigue crack was measured using a heterodyne laser interferometer (Polytec OFV-505/OFV-5000). For the measurement of the scattered wave field the laser head was moved parallel to the specimen surface on a radial grid using a scanning rig. Measurements were made to cover an area from 3.5 to 9.5 mm radius around the fastener hole (hole radius 3.175 mm) with a radial step size of 0.5 mm and an angular increment of 5°. For the non-contact fatigue crack monitoring, the laser beam measurement spot was placed on the damaged specimen surface at a point approximately 1 mm behind the expected crack location and 1 mm from the hole boundary, as indicated in figure 1. The guided ultrasonic wave signals were bandpass filtered (KH 3945) from 0.75 to 1.25 MHz and averaged (50 averages) using a digital storage oscilloscope (LeCroy 9304A). For the monitoring of hidden fatigue crack growth from a stand-off distance (225 mm), standard pulse-echo measurements were performed using an ultrasonic pulser-receiver (Olympus 5900 PR). The signals received from the 1 MHz wedge transducer were band pass filtered (100KHz–10 MHz) and averaged as above.
3. Fatigue crack influence on scattered wave field
For one fatigued tensile specimen the scattered guided ultrasonic wave field around the fastener hole was measured for different lengths of the fatigue crack as shown in figure 4. The ultrasonic signal on the specimen surface containing the fatigue crack was measured using the laser interferometer on a radial grid as described above. For each measurement point the time trace was time gated to isolate the relevant wave pulse from reflections at the specimen sides and higher wave modes propagating at a slower group velocity. Using fast Fourier transform (FFT) the corresponding amplitude at 1 MHz was extracted and displayed colour-coded in figure 4. The amplitude was normalized such that the amplitude of the incident wave at the hole centre corresponds to unity. The incident wave propagates from bottom to top and is scattered at the hole. The radially scattered wave interacts with the incident wave depending on the relative phase angle and results in high and low amplitudes around the fastener hole [15]. In figure 4(a) a clear and symmetric pattern around the undamaged hole can be observed with an area of low amplitude behind the hole as a large part of the incident wave is blocked.
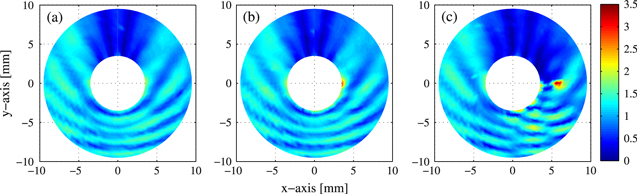
Figure 4. Scattered wave field around fastener hole measured using laser interferometer, incident wave propagating bottom to top; (a) no damage; (b) part-thickness fatigue crack at right-hand side, length 0.88 mm, depth 0.61 mm; (c) fatigue crack through aluminium layer, length 3.04 mm, depth 3.00 mm.
Download figure:
Standard image High-resolution imageFor a small, quarter-elliptical part-thickness fatigue crack no significant change of the overall scattering pattern can be seen in figure 4(b). Only close to the damage location on the right-hand side of the hole (x = 3.5 mm, y = 0 mm) a local increase in amplitude and a small shift of the scattered wave field was observed. Once the fatigue crack had grown through the thickness of one of the aluminium layers a significantly larger change of the scattered wave field was observed (figure 4(c)). The fatigue crack blocks part of the incident guided wave pulse and an area with reduced amplitude was seen behind the damage location. Locally at the crack high amplitude due to the scattering was observed as well as a change in the scattering pattern on the right-hand side with additional guided wave interference. This indicates a significant additional wave back-scattered from the fatigue crack. Based on these results it was decided to initially monitor the wave amplitude at a location just behind the fatigue crack location where optimum sensitivity is expected.
4. Noncontact laser monitoring of fatigue crack growth
Fatigue crack growth during cyclic loading was monitored in five specimens using noncontact laser measurements as described in section 2. Typical time traces are shown in figure 5 for the same specimen and crack lengths as in figures 2 and 3.
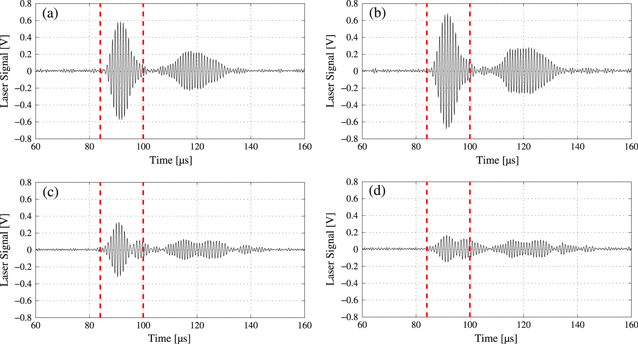
Figure 5. Time traces measured using laser interferometer at location close to fatigue crack; (a) −32 000 cycles (baseline measurement), no crack; (b) −10 000 cycles, crack length 0.77 mm, crack depth 0.85 mm; (c) −5000 cycles, crack length 1.32 mm, crack depth 1.53 mm; (d) zero cycles, crack length 2.49 mm, crack depth 3.00 mm (through aluminium layer); employed time window 85–100 μs indicated (dashed lines).
Download figure:
Standard image High-resolution imageThe strong, initial wave pulse starting at about 85 μs in figure 5(a) consists of the fundamental A0 and S0 modes and the arrival time matches the theoretical prediction based on their group velocities. The second pulse at about 110 μs matches the arrival time of the A1 mode, but might contain a reflection of the first wave pulse at the side of the specimen. For the purpose of this study a time gate from 85 to 100 μs (indicated as dashed lines in figure 5) was used to analyze only the main, initial pulse. The times were calculated based on the wave propagation and the group velocities of the fundamental modes, accounting for the wave propagation time within the wedge. The observed time traces stayed reasonably unchanged during the cyclic loading before a fatigue crack was observed visually. Coinciding with the observation of a small, quarter-elliptical fatigue crack at the side of the hole, an increase in amplitude was observed for all specimens, as shown in figure 5(b). With increasing size of the quarter-elliptical crack in the aluminium layer, a subsequent drop in amplitude was observed (figure 5(c)). The amplitude drop continued until shortly before the crack grew through the bottom aluminium layer (figure 5(d)), after which some further variation was observed (especially for one specimen).
In order to quantify the changes in the guided wave pulse due to the scattering at the growing fatigue crack, a parameter proportional to the energy of the time-gated first pulse was defined as

where t is time and xn(t) is the measured ultrasonic time signal (in Volts) at fatigue cycle n [25]. For better comparison between the five specimens the energy ratio RL was obtained by normalizing the energy parameter En with the baseline energy parameter E0 for each specimen

with

where x0(t) is the baseline signal (averaged from the first ten measurements) at the start of the cyclic loading. The energy ratios against the number of cycles for the five specimens are plotted in figure 6(a), with zero cycles representing the crack having grown through the damaged aluminium layer (depth = 3 mm) for each specimen. The largest variation observed until −15 000 cycles, when no macroscopic crack was optically visible for any specimen, was just under 12% (dashed line in figure 6(a)). Other evaluation criteria such as maximum amplitude of the signal envelope and amplitude at 1 MHz from FFT were investigated. In line with previous findings for fatigue cracks in a single metallic layer [25], overall a similar behaviour for all criteria was observed. The amplitude criteria showed smaller variations of about 6%, but showed a smaller influence of the fatigue crack growth and it was thus decided to employ the energy ratio criteria. For all specimens an initial increase in guided wave pulse energy was observed with the growth of a small, quarter-elliptical fatigue crack. At −10 000 cycles four out of the five specimens showed an increase of at least 40% for a maximum crack area of 0.89 mm2. For one of the specimens (blue line in figure 6(a)) an increase of 26% at −10 000 cycles was observed, corresponding to a crack area of 0.59 mm2. The increase in amplitude for a small quarter-elliptical crack is in line with the observations from the scattered wave field (figure 4(b)) but different to what has been reported for single metallic layers where no amplitude increase was observed [25]. Different phenomena could explain this initial increase in amplitude very close to the quarter-elliptical fatigue crack. The part-thickness crack leads to a local decrease of the bending stiffness of the multi-layered specimen and thus a larger out-of-plane displacement. Another possible interpretation is a localized boundary layer at the fatigue crack due to the ultrasonic wave scattering. Simulations of the high frequency guided wave interference and scattering (e.g., using finite elements) would help to understand this phenomenon better. With the growth of the quarter-elliptical crack in the aluminium layer all specimens showed a subsequent decrease in energy ratio as shown for the time trace in figure 5(c). At −5000 cycles for four out of the five specimens a drop in the energy ratio of at least 60% was observed (fifth specimen (black line): 12% drop) with a largest crack area of 2.53 mm2. At zero cycles, when the crack had grown through the damaged aluminium layer for all specimens a drop in energy ratio of at least 80% was observed. The energy ratio curve (against cycles) for one specimen (black line in figure 6(a)) appeared to lag behind. The data was double-checked but no obvious cause or difference in the crack growth pattern was found. The visually observed fatigue crack growth rates for all specimens were reasonably repeatable, with only small differences in crack area before the crack had grown through the aluminium layer (zero cycles in figure 6(b)). In order to allow an easier comparison of the changes in energy ratio with crack area these were plotted against each other in figure 7. The pattern discussed above with an initial variation of up to 12% (dashed line), increase in energy for a quarter-elliptical crack of about 1 mm2 and subsequent drop with increasing crack area can be observed in figure 7. Taking a safe criterion to reliably call a fatigue crack, a minimum drop in amplitude of 25% was specified (twice the observed variation).

Figure 6. (a) Energy ratio of guided wave pulse measured with laser interferometer at location behind fatigue crack close to hole for five specimens (solid lines); 12% amplitude variation shown (dashed); (b) optically measured crack area for five specimens; plotted against number of cycles before crack grown through thickness.
Download figure:
Standard image High-resolution image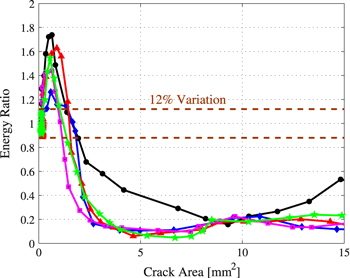
Figure 7. Energy ratio of guided wave pulse measured with laser interferometer at location behind fatigue crack close to hole for five specimens (solid lines); 12% amplitude variation shown (dashed); plotted against optically measured crack area.
Download figure:
Standard image High-resolution imageFor all specimens a larger drop than 25% was observed for a maximum crack area of 2.33 mm2, corresponding to a quarter-elliptical crack with 1.74 mm length and 1.34 mm depth. Compared to previous measurements for a single aluminium layer specimen at 2.25 MHz excitation frequency [25] a reduced sensitivity for the detection of small fatigue cracks was observed, due to the more complicated thickness layup and lower excitation frequency. In principle a shorter fatigue crack with an area of less than 0.6 mm2 could be called for the observed amplitude increase. However, only for four out five specimens an increase of significantly more than 25% was observed, with one specimen showing an increase by 26% (figure 7). Further measurements and a better understanding of the initially observed amplitude rise would be required to verify the probability of detection for small fatigue cracks in the multi-layered structure using the noncontact laser measurements.
5. Pulse-echo measurements for hidden fatigue crack growth monitoring
The sensitivity for the detection and monitoring of hidden fatigue cracks without local access to the fastener hole was studied to investigate the potential for the applicability for SHM applications. The P/E signal from the wedge transducer placed at a stand-off distance of 225 mm on the specimen surface opposite to the fatigue crack were recorded and evaluated. This was done for five tensile specimens (different to laser measurements) with typical time traces shown in figure 8 for one of the specimens. Significant internal reverberations within the transducer and wedge are visible until about 100 μs.
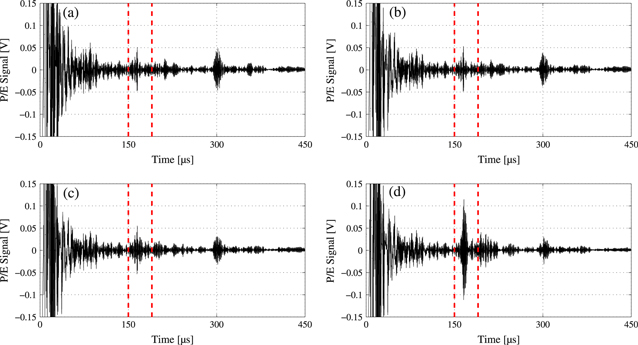
Figure 8 P/E time traces from 225 mm stand-off distance; (a) −53 000 cycles (baseline measurement), no crack; (b) −12 000 cycles, crack length 0.70 mm, crack depth 0.77 mm; (c) zero cycles, crack length 2.57 mm, crack depth 3.00 mm (through aluminium layer); (d) 10 000 cycles, crack length 6.02 mm, crack depth 3.00 mm (through aluminium layer); employed time window 150–190 μs indicated (dashed lines).
Download figure:
Standard image High-resolution imageThe reflection at the undamaged fastener hole (incl. starter notch) is visible in figure 8(a) at about 170 μs as a distinct pulse and the reflection at the end of the specimen at about 300 μs. The propagation time was calculated based on the combination of path lengths in the wedge and specimen and the highest and lowest group velocities for the fundamental guided wave modes. Based on this a time window from 150 to 190 μs as indicated by the red, dashed lines in figure 8 was selected to time gate the reflected pulse at the hole and fatigue crack. For a small quarter-elliptical fatigue crack no systematic change above the noise level of the reflected pulse is visible (compare figure 8(b) to the baseline signal in figure 8(a)). Approximately when the fatigue crack had just grown through the damaged aluminium layer a small increase in amplitude of the reflected pulse and change in shape was observed (figure 8(c)). With increasing length of the fatigue crack through the aluminium layer a significant increase in reflected amplitude can be seen in figure 8(d). This is in line with the observations of the influence of the fatigue crack on the scattered wave field, where only for larger fatigue cracks a significant back-scattered wave pulse was observed. For the five specimens there was more variation of the reflected wave pulse patterns than had been observed for the laser measurements reported above.
Depending on the exact location, shape and angle of the fatigue crack, the relative amplitude and phase of the different scattered wave pulses change, which can lead to different interference effects in the wave propagating back to the wedge transducer location. Similar to the laser measurements the energy ratio of the time gated signal containing the combined reflection at the hole and fatigue crack was calculated according to equations (1)–(3). A significantly larger variation than for the laser measurements (12%) of up to 60% can be seen in figure 9(a) before a fatigue crack was optically visible (−17 000 cycles). Apart from the noise level and effects described this might be due to the relatively small amplitude of the reflected wave pulse and interferences along the propagation path. Minor, localized plastic deformations around the fastener hole were observed during the cyclic loading, which could change the reflections at the fastener hole. Possible further influences include the contact of the wedge to the specimens, diminishing of ultrasonic couplant, and degradation of the sealant layer due to cyclic loading. Two of the specimens were opened after fatigue crack growth, but no damage of the sealant layer was observed. It should be noted that the variation is significantly larger for two of the five specimens (red and green line in figure 9), for the remaining three specimens a maximum variation of 22% until −17 000 cycles was observed. In line with the fatigue crack growth measurements for the previous five specimens the crack area measurements for the five specimens in figure 9(b) follow a reasonably similar pattern. For most of the specimens an initial increase of the energy ratio was noted at about −10 000 to −5000 cycles in figure 9(a). A second, sharper increase to an energy ratio of at least three was observed for all specimens by 4000 cycles, when the crack through the aluminium layer had grown to a length of at least 3.5 mm. The energy ratio versus crack area is shown in figure 10 for simpler interpretation. Up to 60% variation for two of the specimens and 22% variation for the other three specimens can be observed before the crack was detected optically. Especially one of the specimens (green line in figure 10) showed a significantly different behaviour compared to the other specimens. From a closer analysis of the observed crack growth, ultrasonic signals and specimen no reason for this could be discerned. Taking a similar criterion for crack detection as for the laser measurements a threshold of a 120% change in energy ratio was set. The largest crack area of 11.5 mm2 for this corresponds to a crack length of 3.83 mm through the aluminium layer and coincides with the observed sharp increase in energy ratio for all specimens. For individual specimens a smaller fatigue crack might be called, but in order to avoid false calls the current criterion provides a reasonable safety margin. The detectable length for a hidden fatigue crack from a stand-off distance without access to the damaged plate side is in line with a threshold value mentioned previously [4]. Further improvements might be possible once the repeatability of the proposed SHM methodology has been investigated in more detail and an improved understanding of the exact interaction of the high-frequency guided wave modes with the fastener hole and fatigue crack has been obtained.
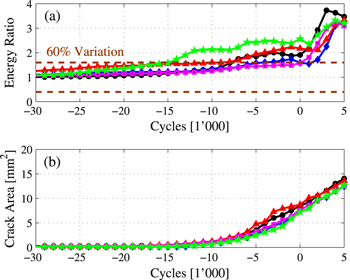
Figure 9. (a) Energy ratio of P/E pulse measured from 225 mm stand-off distance from hole for five specimens (solid lines); 60% amplitude variation shown (dashed); (b) optically measured crack area for five specimens; plotted against number of cycles before crack grown through thickness.
Download figure:
Standard image High-resolution image
Figure 10. Energy ratio of P/E pulse measured from 225 mm stand-off distance from hole for five specimens (solid lines); 60% amplitude variation shown (dashed); plotted against optically measured crack area.
Download figure:
Standard image High-resolution image
6. Conclusions
The potential of high-frequency guided ultrasonic waves for the detection and monitoring of fatigue cracks in multi-layered model aerospace structures has been investigated. Working at a higher frequency-thickness product than conventional guided wave systems, they offer a trade-off between reduced propagation range (monitoring area) and improved sensitivity for small defects. This methodology is in principle suitable for integration in a SHM system for critical areas with known large stress concentrations and thus susceptible for fatigue crack initiation and growth. Using standard 90° angle beam wedge transducers with single sided access to the structure strong, low-dispersive pulses containing the fundamental A0 and S0 modes can be excited and received. The considered uniform multi-layered component consists of two aluminium alloy plates with a sealant layer. Fatigue crack growth in one of the aluminium layers at a fastener hole was induced using tensile cyclic loading in a servo-hydraulic testing machine and the resulting crack area was measured optically. The influence of the fatigue crack on the scattered wave field was investigated. For small quarter-elliptical cracks a localized increase in amplitude and small change in the scattered field were observed. For larger fatigue cracks through one of the aluminium layers an area of significantly reduced amplitude behind the damage location and an additional, back-scattered wave were observed. Local, noncontact laser measurements close to the damage location confirmed the repeatability of the measured initial amplitude increase and subsequent drop in amplitude. Depending on the chosen criteria a quarter-elliptical crack partially through one of the metallic layers could be reliably detected. The possibility for the detection of hidden (2nd layer) fatigue cracks from a stand-off distance without access to the damaged specimen side was verified using standard ultrasonic pulse-echo equipment. Fatigue cracks that had grown through the thickness of the damaged aluminium layer could be reliably detected from the additional scattered guided wave pulse leading to a significant increase in reflected wave energy well above the measurement variations. In order to improve the understanding of the probability of detection threshold for fatigue damage both simulations and further measurements would be helpful. This could help to quantify both the maximum achievable stand-off distance and minimum detectable fatigue crack size for integration in future SHM systems for multi-layered aerospace applications. The variability of the guided wave reflection at the fastener hole and crack would need to be quantified to assess the potential for the detection of fatigue cracks during scheduled inspections without access to a baseline signal and to potentially improve the sensitivity for the detection of small defects.
Acknowledgments
This work was partially supported by the UK Engineering and Physical Sciences Research Council (EPSRC) [grant number EP/D065011/1].