
Abstract
This explorative study aims at characterizing the breath behavior of two prototypic volatile organic compounds, acetone and isoprene, during normal human sleep and to possibly relate changes in the respective concentration time courses to the underlying sleep architecture. For this purpose, six normal healthy volunteers (two females, four males, age 20–29 years) were monitored over two consecutive nights (the first one being an adaption night) by combining real-time proton-transfer-reaction mass spectrometry measurements from end-tidal exhalation segments with laboratory-based polysomnographic data. Breath acetone concentrations increased overnight in all measurements, with an average relative change by a factor of up to 4 (median 2.5). Nighttime concentration maxima were usually recorded 2–3 h before lights on. For breath isoprene, a nocturnal increase in baseline concentrations of about 74% was observed, with individual changes ranging from 36–110%. Isoprene profiles exhibited pronounced concentration peaks, which were highly specific for leg movements as scored by tibial electromyography. Furthermore, relative to a linear trend, baseline isoprene concentrations decreased during the transition from the NREM to the REM phase of a complete sleep cycle.
Export citation and abstract BibTeX RIS
Abbreviations
| EEG | electroencephalography |
| EMG | electromyography |
| EOG | electrooculography |
| GC-MS | gas chromatography mass spectrometry |
| PSG | polysomnography |
1. Introduction
In recent decades much progress has been made with respect to deepening the understanding of sleep-related physiology. Within this context, a particular focus has been given to the study of ventilatory, cardiovascular and endocrine factors, as well as to the identification of regulatory processes affecting these systems during distinct states of sleep and wakefulness. Knowledge of these relationships is of crucial importance, particularly due to the fact that abnormal interactions between vital functions and their underlying control mechanisms are well known to be the source of clinically relevant pathologies that might manifest themselves over the entire sleep–wake cycle (Kryger et al 2005).
Recent progress in breath gas research suggests that endogenous volatile organic compounds (VOCs) contained in exhaled breath can provide insights into the physiological state of sleeping individuals which are complementary to those obtained by means of the conventional methodological approaches indicated above. The detection and quantification of these trace gases are accessible to non-invasive investigation and have been put forward as a potentially versatile tool for medical diagnosis (Risby et al 1999, Schubert et al 2003, 2005, Amann et al 2004, 2007, 2010, 2011, Miekisch et al 2004, Gustafsson 2005, Wehinger et al 2007, Kushch et al 2008, Bajtarevic et al 2009, Filipiak et al 2010) and assessments of body burden in response to medication and environmental exposure (Rieder et al 2001, Erhart et al 2009, Pleil 2008, Pleil et al 2000). As a particular advantage, exhaled breath can nowadays be measured at breath-by-breath resolution and in real-time (using, e.g., proton transfer reaction mass spectrometry (PTR-MS) (Lindinger et al 1998, Herbig et al 2009, Schwarz et al 2009) or selected flow tube ion mass spectrometry (SIFT-MS) (Diskin et al 2003)). Such real-time measurements allow for the continuous extraction of physiological/metabolic information on the test subject under scrutiny. Due to the direct influence which specific biochemical pathways may exert on sleep patterns (Tafti et al 2003, Obal and Krueger 2003), we expect that such information will also contribute to further elucidating the metabolic component of sleep in general.
So far, very little is known about sleep-related variations of VOC levels in exhaled breath. While earlier studies have attempted to monitor specific VOC profiles overnight, the results remain doubtful due to the fact that the test subjects had to be woken up in order to provide a breath sample (Cailleux and Allain 1989). This can be a source of substantial measurement artifacts due to the drastic variations in ventilation and perfusion during the awakening phase (Karl et al 2001). Consequently, an experimental regime allowing for uninterrupted sleep and parallel assessments of blood and respiratory flow appears mandatory for arriving at reliable data. A preliminary PTR-MS setup designed for this purpose has been described by our group (Amann et al 2004, 2005, 2007). In this setup, however, only mixed expired rather than end-tidal air was collected and a simultaneous measurement of ventilation and cardiac output was not carried out.
This work is intended as a pilot study devoted to the investigation of end-tidal concentration profiles of two prototypic VOCs, isoprene and acetone, during normal sleep. More specifically, the primary objectives are to describe the long-term exhaled breath dynamics of these two trace gases and to possibly relate changes in the respective concentration time courses to the underlying sleep architecture.
Isoprene and acetone represent paradigmatic test compounds for a number of reasons. Both are primarily endogenous in origin and highly abundant in normal human breath, they have contrasting physical–chemical properties (isoprene is strongly lipophilic with low blood solubility, whereas acetone is hydrophilic and highly blood soluble) and both are reliably quantifiable by virtue of several distinct analytical techniques such as PTR-MS (Kushch et al 2008, Schwarz et al 2009), SIFT-MS and GC-MS (Mendis et al 1994). Furthermore, from the diurnal patterns of exhaled isoprene and the close links between acetone metabolism and lipolysis sleep-related modulations in breath output may be expected for both compounds (Cailleux and Allain 1989, DeMaster and Nagasawa 1978, Kalapos 2003). In particular, this study is also anticipated to provide reference datasets for future examinations of VOC profiles during sleep, potentially involving a wider range of VOCs (e.g. by using techniques largely obviating trade-offs between mass resolution and sampling frequency such as PTR-time-of-flight mass spectrometry, PTR-TOF (Herbig et al 2009)).
2. Methods
The study was approved by the Ethics Commission of Innsbruck Medical University and was carried out in conformity with the Declaration of Helsinki.
2.1. Experimental setup
Major parts of the setup have been adapted from a previous PTR-MS study centering on synchronized measurements of end-tidal isoprene and acetone as well as of a number of respiratory and hemodynamic parameters during moderate ergometer workload scenarios. Extensive details regarding the underlying PTR-MS settings, quantification and cross-validation of VOC profiles by means of independent GC-MS analyses are given elsewhere (King et al 2009, 2010b, Schwarz et al 2009). Briefly, the instrumentation comprises four central parts, cf figure 1.
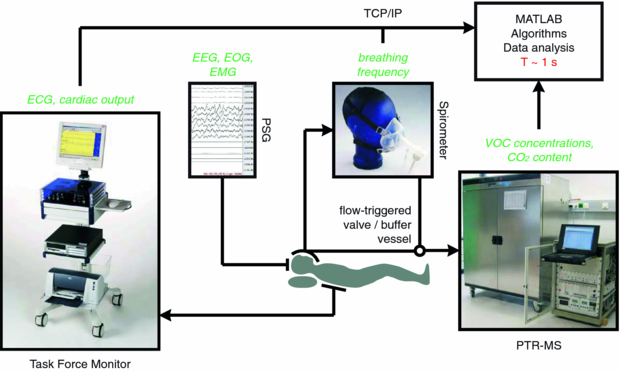
Figure 1. Overview of the complete study setup. Items in italic correspond to measured variables.
Download figure:
Standard image- (a)Polysomnography. PSG was performed by means of a Brainlab 4 system (Schwarzer, Munich, Germany). This device is widely used as a standard PSG monitoring solution and consists of an amplifier and a filter box connected via fiber optics to a PC running the Brainlab 4 software, version 4.0, patch pack 5. Within the PSG a six-channel EEG with the following derivations was recorded: F3-M2, F4-M1, C3-M2, C4-M1, O1-M2, O2-M1. Four channels were used for the horizontal and vertical EOG recordings. EMG was applied to the mental, submental and both anterior tibialis muscles. In addition, body position was recorded. Sleep stages were scored in 30 s periods according to standard AASM criteria (Iber et al 2007) in the sleep laboratory of the Department of Neurology at Innsbruck Medical University by a trained PSG technologist. Leg movements (LM) were obtained by bilateral anterior tibialis EMG. Additionally, transcutaneous hemoglobin oxygen saturation (SaO2) was recorded.
- (b)Respiratory monitoring. Respiratory flow was obtained by a SpiroStar USB differential pressure sensor (Medikro Oy, Kuopio, Finland). The test subject freely inhaled/exhaled through a flow transducer mouthpiece, which was connected to a silicone face mask covering mouth and nose (Hans Rudolph, Shawnee, KS, USA). The pressure sensor then delivered volumetric flow rates within the flow transducer at a sampling frequency of 100 Hz. Algorithmic processing of this signal subsequently allowed for the calculation of breathing frequency. In principle, the above setup also permits a simultaneous determination of tidal volume; however, the high sensitivity of the flow rate scaling factor with respect to movement artifacts during sleep (e.g. lying on the pressure tube of the spirometer) in some cases prevented us from arriving at reliable volume time courses over the whole night.
- (c)Breath gas sampling and analysis. The face mask was heated to body temperature using an isolated heating wire (TNI Medical, Freiburg, Germany) and insulating tape in order to dispense heat uniformly. This was done in order to prevent condensation of water vapor within the face mask. Condensed water droplets would attract hydrophilic VOCs, thereby depleting the sample and biasing the measurement results.Exhaled breath samples were directed from the flow transducer to a high-sensitivity PTR-MS (Ionicon Analytik GmbH, Innsbruck, Austria) via a 5 m long, 1/4'' Teflon sampling line, heated to a temperature of about 40 °C in the same way as the face mask. A flow-triggered valve installed along this sampling line guaranteed that breath was only available for analysis in predefined (e.g. end-tidal) exhalation segments. Thus, an automatic real-time standardization of the breath extraction procedure could be achieved. Furthermore, in order to avoid PTR-MS drift chamber pressure fluctuations due to the deflation of the sampling line during longer valve closing times (corresponding to phases of uneven breathing, e.g., in apnea), a Teflon buffer vessel with a volume of about 10 ml was installed. This vessel also acts as a mechanical low-pass filter for the VOC concentrations delivered by PTR-MS, resulting in a slight smoothing of the associated signal.End-tidal isoprene and acetone concentrations were determined in PTR-MS by monitoring their protonated forms at m/z = 69 (dwell time 200 ms) (Kushch et al 2008) and m/z = 59 (dwell time 200 ms) (Schwarz et al 2009), respectively. Additionally, for quantification purposes we routinely measure the mass-to-charge ratios m/z = 21 (isotopologue of the primary hydronium ions used for normalization; dwell time of 500 ms), m/z = 37 (first monohydrate cluster; dwell time of 2 ms) as well as the parasitic precursor ions NH4+ and O2+ (at m/z = 18 and m/z = 32, respectively, with dwell times of 10 ms each), thus resulting in a sampling time of about 1 s (King et al 2009, 2010b, Schwarz et al 2009). The carbon dioxide content of the breath sample was derived from a separate sensor (AirSense Model 400, Digital Control Systems, Portland, OR, USA).
- (d)Hemodynamic monitoring. Hemodynamic monitoring with beat-to-beat resolution was accomplished by means of a Task Force Monitor (TFM) system (CNSystems, Graz, Austria), involving standard ECG leads and transthoracic impedance cardiography (ICG) for the non-invasive determination of ejection (stroke) volume. For the continuous recording of ECG, heart rate and cardiac output the proprietary TFM software, version 2.2, was used.
2.2. Test subjects and protocol
For this study six volunteers, four males and two females between 20 and 29 years of age, agreed to spend two consecutive nights in the sleep laboratory. After informed consent had been obtained, all participants were examined clinically and were attested a good physical condition. Pittsburg sleep quality index (PSQI; a self-rated questionnaire which assesses sleep quality and disturbances (Buysse et al 1989)) scores ranged from 1 to 6, cf table 1. No test subject reported any prescribed medication or drug intake. Participants were mainly non-smokers, except volunteer 6 who reported smoking sporadically. Due to the negligible influence of age, BMI and smoking status on the breath levels of acetone and isoprene in adults no explicit control with respect to these covariates was enforced (Kushch et al 2008, Schwarz et al 2009, Euler et al 1996).
Table 1. General sleep-related and physiological data corresponding to the second night of each volunteer. Respiratory and hemodynamic data are given as mean (std).
| Volunteer | 1 | 2 | 3 | 4 | 5 | 6 |
|---|---|---|---|---|---|---|
| Gender | F | M | M | M | M | F |
| Age | 27 | 22 | 24 | 26 | 20 | 29 |
| Sleep-related data | ||||||
| PSQI score | 3 | 1 | 3 | 6 | 5 | 4 |
| Lights off | 11:40 pm | 10:07 pm | 10:08 pm | 10:38 pm | 10:34 pm | 10:22 pm |
| Lights on | 07:40 am | 06:07 am | 06:08 am | 06:38 am | 06:34 am | 06:22 am |
| Total sleep time | 7:30 | 6:10 | 6:54 | 6:35 | 7:35 | 7:34 |
| (h:min) | ||||||
| Sleep efficiency (%) | 94 | 77 | 86 | 82 | 95 | 95 |
| N1 sleep (%) | 4.6 | 10.5 | 4.9 | 7.9 | 7.7 | 5.8 |
| N2 sleep (%) | 56 | 28 | 52.5 | 47.3 | 53.4 | 55.4 |
| N3 sleep (%) | 14 | 20.9 | 15.7 | 19.5 | 16.9 | 18.4 |
| REM sleep (%) | 23.6 | 21.1 | 20.6 | 20.4 | 18.2 | 17.8 |
| Sleep latency (min) | 8 | 4 | 38 | 57 | 3 | 11 |
| REM latency (min) | 60 | 87 | 56 | 114 | 200 | 103 |
| Respiratory data | ||||||
| Mean SaO2 (%) | 97.1 (0.4) | 95.8 (1.1) | 95.3 (0.9) | 96.4 (0.8) | 95.9 (1) | 95.9 (0.8) |
| Min SaO2 (%) | 95 | 92 | 92 | 94 | 93 | 95 |
| End-tidal CO2 NREM | 5.5 (0.1) | 5.9 (0.4) | 6 (0.2) | 6.1 (0.2) | 6.2 (0.3) | 4.9 (0.2) |
| (%) | ||||||
| End-tidal CO2 REM | 5.5 (0.1) | 6.1 (0.2) | 6 (0.1) | 6.1 (0.1) | 6.2 (0.2) | 4.9 (0.2) |
| (%) | ||||||
| Frequency NREM | 11.2 (0.8) | 15.3 (2) | 12.4 (1.5) | 13.3 (1.1) | 12.7 (2.4) | 15.2 (0.9) |
| (tides/min) | ||||||
| Frequency REM | 12.6 (1.9) | 16.0 (2.4) | 11.7 (1.5) | 13.6 (1.3) | 15.5 (2.7) | 17.5 (2.4) |
| (tides/min) | ||||||
| Hemodynamic data | ||||||
| Cardiac output NREM | 3.7 (0.3) | 5.0 (0.6) | 4.4 (0.5) | 4.1 (0.4) | 5.1 (0.7) | 5.5 (0.5) |
| (l/min) | ||||||
| Cardiac output REM | 3.8 (0.3) | 5.0 (0.4) | 4.1 (0.4) | 4.2 (0.3) | 4.8 (0.3) | 5.6 (0.3) |
| (l/min) |
When spending the night in the sleep laboratory the participant had to arrive at 8 pm. Instrumentation started with a head measurement according to the international 10–20 system. After using abrasive peeling paste (Skin-Pure, Nihon Kohden, Tokyo, Japan) and surgical spirit for cleaning, gold electrodes were applied to the scalp. The electrodes were then covered with gauze and firmly fixed by blowing compressed air over them to stiffen the collodion. Electrodes for EOG, chin and tibial EMG were attached with self-adhesive fabric tape (Mefix, Mölnlycke Health Care, Vienna, Austria). All electrodes were injected with low impedance highly conductive gel (SignaGel, Parker Labs, Fairfield, NJ, USA).
Subsequently, the volunteer was set up with the TFM electrodes, five to obtain a four-channel ECG and three more for ICG. Following a final briefing, the face mask was fixed to the test subject's head by means of a hair cap. Special care was taken in order to avoid any leakage or discomfort in breathing. After bio-calibration of the PSG equipment the test subject was contacted one last time and then left alone to sleep. Lights off was usually recorded between 10–11 pm. Lights on was recorded exactly 8 h later, i.e., time in bed equaled 480 min for each volunteer.
3. Results
Since the first night in the sleep laboratory was primarily intended as an adaption night, the results given in the following exclusively refer to the second night of each volunteer. All hemodynamic, respiratory and concentration profiles were interpolated to a common timeframe with a sampling interval of 1 s and smoothed using a median filter with a window width of 30 s.
3.1. General sleep-related and physiological data
The experimental setup was well tolerated by all test subjects. Sleep efficiency (the ratio between total sleep time and time spent in bed) ranged from 77% to 95% (median 90%) and sleep stage distributions as obtained by PSG were comparable with the typical fractional shares corresponding to a 30 year old adult (Moser et al 2009), see table 1. Sleep and REM latency varied from 3 to 57 min (median 9.5 min) and from 56 to 200 min (median 95 min), respectively.
Hemodynamic and respiratory behavior closely followed the typical patterns for normal human sleep. Mean transcutaneous hemoglobin oxygen saturation (SaO2) over a 30 s period showed little variation throughout the night and remained above 92% for all volunteers. Similarly, exhaled breath CO2 content generally exhibited a very stable behavior and resembled normal end-tidal levels, thus reconfirming the capability of the sampling regime to selectively extract the last segment of exhaled breath. Values for breathing frequency and cardiac output were found to vary within the normal physiological ranges, indicating that the instrumentation did not induce drastic ventilatory and/or hemodynamic changes. While cardiac output remained relatively stable throughout all nights, breathing frequency showed a more segmented pattern, with highly regular breathing during NREM and an increased variability during REM sleep. Typical profiles associated with these quantities are displayed in figure 2.
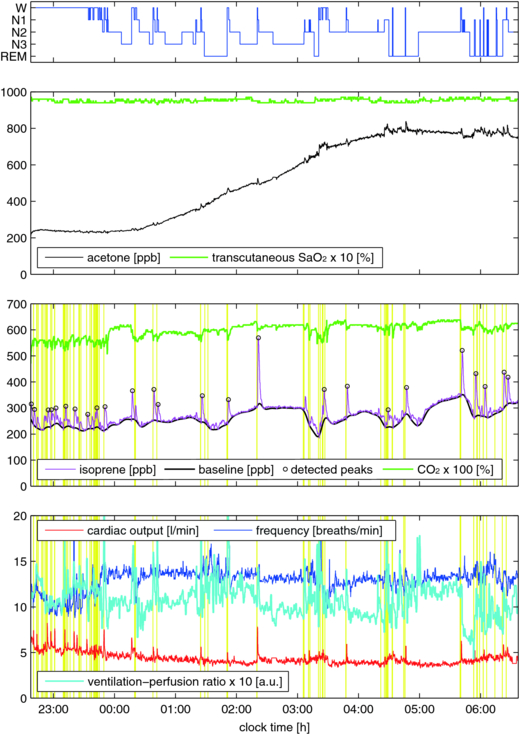
Figure 2. Representative measurements for a single test subject (volunteer 4) over a full night. The associated hypnogram is given in the first panel. End-exhaled acetone and isoprene concentrations are presented in comparison with transcutaneous hemoglobin oxygen saturation (SaO2) and end-exhaled CO2 content. Major respiratory and hemodynamic variables are shown in panel four. An average ventilation-perfusion ratio was derived by multiplying breathing frequency and approximate tidal volume profiles and by dividing the result by the observed cardiac output. Additionally, a median filter with a window width of 60 s was applied for this signal. Note that isoprene concentration peaks may arise in spite of increasing ventilation-perfusion ratios, which are expected to imply a decrease of VOC breath concentrations (as it is the case, e.g., for CO2). Vertical lines in panels three and four depict LM as measured by anterior tibialis EMG.
Download figure:
Standard image3.2. Acetone
Due to room air contamination (probably resulting from an extensive PTR-MS calibration procedure earlier on that day), the acetone profile corresponding to volunteer 6 had to be excluded from the following analysis. For the remaining datasets, background levels of acetone recorded while drawing room air through the breath sampling system just before lights off usually were around 10% of the mean acetone level throughout the measurement and never exceeded 25% of that value.
End-tidal acetone concentrations at the onset of sleep (Cstart; calculated as the median concentration over the first connected 5 min interval consisting of NREM phases only) varied from 234 to 580 ppb (parts per billion). Concentrations at the end of sleep (Cend; corresponding to the median concentration over the last connected 5 min interval before lights on consisting of NREM phases only) ranged from 575 to 1460 ppb. Breath acetone concentrations increased overnight in all measurements with individual relative changes Cend/Cstart ranging from 1.10 to 4.09 (median 2.52). For perspective, in the first night volunteer 6 also showed an increase in acetone concentrations from Cstart = 324 ppb to Cend = 646 ppb. A detailed overview of the derived concentration levels is given in table 2.
Table 2. Acetone characteristics for the study cohort under scrutiny. Concentrations refer to end-tidal levels. Time Cmax denotes the time before lights on when Cmax was recorded. Other abbreviations refer to quantities described in the text.
| Volunteer | 1 | 2 | 3 | 4 | 5 | 6 |
|---|---|---|---|---|---|---|
| Cstart (ppb) | 580 | 286 | 547 | 234 | 309 | – |
| Cmax (ppb)/sleep stage | 1529/W | 1392/N1 | 685/N1 | 838/REM | 716/W | – |
| Time Cmax (h:min) | 0:10 | 2:17 | 1:44 | 1:50 | 2:35 | – |
| Cend (ppb) | 1460 | 1169 | 602 | 750 | 575 | – |
| Cend/Cstart | 2.52 | 4.09 | 1.10 | 3.20 | 1.86 | – |
Breath acetone levels usually remained steady for up to 2 h of sleep and reached a nighttime maximum Cmax within the last 2–3 h before lights on. Within the remaining sleep period breath acetone either stabilized at this level or dropped slightly. In particular, the nighttime maximum did not show an obvious correlation to sleep stage. A representative profile is shown in the second panel of figure 2, while the entire ensemble of individual acetone profiles is depicted in figure 3.
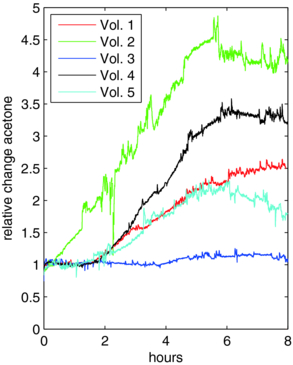
Figure 3. Relative changes in breath acetone between lights off and lights on for all volunteers described in table 2. Data were derived by normalizing the individual profiles with respect to the associated concentration Cstart at the onset of sleep. The distorted signal for volunteer 2 around 2 h can be explained by a temporary drop in PTR-MS drift chamber pressure (probably resulting from erroneous valve control due to mask displacement, cf section 2.1 (c)).
Download figure:
Standard image3.3. Isoprene
Background levels of isoprene were generally negligible, amounting to 2–6% of the mean value throughout the measurement.
In contrast to acetone, breath isoprene exhibited a high degree of short-term variability, showing characteristic concentration peaks throughout the night, cf figure 2. These peaks correspond to an abrupt increase of 100 ppb and more within a few minutes, followed by a phase of gradual decline back to baseline levels. In order to analyze long- and short-term variability separately, we hence decomposed the isoprene profiles into two parts.
- (a)Baseline trend. Baseline estimation was achieved by subjecting the individual isoprene data to an asymmetric least-squares smoothing algorithm (Eilers 2004), yielding an isoprene baseline profile Cb with all peaks removed, cf figure 2.End-tidal breath isoprene concentration levels at the onset of sleep (Cstart; calculated from Cb according to the same criteria as described in section 3.2) spread around a median value of 83 ppb (range 54–230 ppb). Isoprene concentrations at the end of sleep (Cend; calculated from Cb according to the same criteria as in section 3.2) showed typical values from 99 to 319 ppb. Baseline isoprene concentrations increased throughout the night in all measurements, the median of the individual relative changes Cend/Cstart being 1.74 (range 1.36 to 2.10). A detailed overview of the derived concentration levels is given in table 3.
Table 3. Isoprene characteristics for the study cohort under scrutiny. Concentrations refer to end-tidal baseline levels. Abbreviations refer to quantities described in the text. Peaks without shift in sleep stage refer to isoprene peaks in N1, N2, N3 or REM, which are preceded by movement but are not accompanied by any shift in sleep stage within a 2 min interval before the peak maximum. Peaks without awakening refer to isoprene peaks in N1, N2, N3 or REM, which are preceded by movement but lack an associated awakening within a 2 min interval before the peak maximum.
| Volunteer | 1 | 2 | 3 | 4 | 5 | 6 |
|---|---|---|---|---|---|---|
| Cstart (ppb) | 58 | 54 | 149 | 230 | 101 | 65 |
| Cend (ppb) | 122 | 99 | 250 | 319 | 137 | 117 |
| Cend/Cstart | 2.10 | 1.83 | 1.68 | 1.39 | 1.36 | 1.80 |
| Peaks detected | 29 | 30 | 35 | 25 | 42 | 23 |
| Peaks preceded by LM | 27 | 29 | 34 | 22 | 42 | 22 |
| Peaks w/o shift in sleep stage | 4 | 0 | 4 | 1 | 3 | 3 |
| Peaks w/o awakening | 11 | 1 | 7 | 3 | 21 | 12 |
| Peaks in NREM | 18 | 9 | 22 | 8 | 35 | 14 |
| Peaks in REM | 7 | 4 | 7 | 3 | 5 | 6 |
Further information can be extracted from the baseline signal by considering its behavior within single sleep cycles. For this purpose, in each sleep cycle i we decomposed the baseline isoprene concentration Cb calculated above as Cb (t) = αi + tβi + Cres,i (t) (i.e. we de-trended the baseline in each sleep cycle i by performing a standard linear regression with respect to time t, thereby yielding sleep cycle-dependent regression coefficients and residuals (αi,βi) and Cres,i, respectively) and computed the normalized difference zi = (CNREM,i − CREM,i)/Cstart of the residual means CNREM,i and CREM,i in the NREM and REM phase of the sleep cycle, respectively. For the ease of understanding, a graphical illustration of this procedure is given in the third panel of figure 4. Iterating this step for the second night of each volunteer and employing a non-parametric sign test for statistical analysis, we found that z is different from zero with a median value of 0.1 (p < 0.01). In other words, relative to a linear trend, the baseline isoprene concentrations across all subjects decreased by about 10% of the individual Cstart value during transitions from the NREM to the REM phase of a complete sleep cycle.

Figure 4. Isoprene characteristics during the last sleep cycle of volunteer 4, cf figure 2. REM segments are shaded in gray. The third panel shows the de-trended baseline signal Cres as well as the residual means CNREM and CREM in the NREM and REM phase of the sleep cycle, respectively (cf section 3.3 (a)). Note that isoprene decreases during the transition from NREM to REM sleep, despite the fact that breathing frequency as well as cardiac output stays relatively constant.
Download figure:
Standard image- (b)Peaks. In order to consistently identify concentration peaks within the individual isoprene concentration profiles we re-implemented a standard algorithm for detecting local extrema in physiological signals (Todd and Andrews 1999). Here, a threshold value of δ = 0.25Cstart was used, i.e. a peak essentially corresponds to a signal deviation that locally 'dominates' its surroundings by more than δ, cf figure 2, third panel. Peaks appear in both NREM and REM sleep (with similar frequency when scaled to the duration of the respective sleep phase). The chance that a detected peak is preceded by one or more scored LM falling within a 2 min interval before the peak maximum is over is 90% in most individuals, cf table 3. Additionally, after reviewing the PSG data we found that those isoprene peaks not accounted for by LM occurred shortly after movement-related artifacts over the EEG channels, which are usually seen in the case of large body movements. This observation indicates that movement is in fact a necessary condition for the appearance of breath isoprene peaks during sleep. Furthermore, it should be pointed out that while in many cases movements were closely tied to a shift in sleep stage or even an awakening, the latter events themselves do not appear sufficient for inducing an isoprene peak. Effectively, as shown in table 3 a number of peaks could be identified which were preceded by movement but lacked an associated shift in sleep stage or an awakening within a 2 min interval before the peak maximum.
4. Discussion
In this phenomenological study we intended to characterize the sleep-related behavior of two prototypic breath VOCs, acetone and isoprene, in a group of six normal healthy volunteers. Unlike end-tidal CO2 content, which showed little variation, both compounds displayed characteristic dynamics during sleep, with steadily increasing breath concentrations in the case of acetone and isolated but pronounced concentration peaks throughout the night in the case of isoprene.
Breath acetone levels at the onset of sleep were directly comparable with daytime measurements of healthy adults, spreading around a concentration of 500 ppb (Schwarz et al 2009). There was no obvious correspondence between acetone concentrations and specific events during sleep, although maximum values were usually recorded in sleep stages associated with more irregular breathing patterns (W, N1 and REM). This is in accordance with previous findings on highly soluble gas exchange during rest and exercise conditions, predicting that a major part of the breath-by-breath variability in acetone concentrations can be attributed to fluctuations in ventilatory flow (Anderson et al 2006, King et al 2011a, 2011b).
Biochemically, acetone represents a byproduct of fat catabolism (Kalapos 2003). It hence seems natural to assume that the steady rise of breath acetone levels commonly observed during the sleep is a reflection of increased overnight lipolysis (Hagström-Toft et al 1997). The onset of the latter has been reported to profoundly depend on the nocturnal release of growth hormone (Boyle et al 1992), which is maximal during the first few hours of sleep (Moller et al 1995, Van Cauter et al 1997). Based on this rationale we see breath acetone measurements during sleep as an interesting tool for continuously monitoring the nocturnal interplay between hormonal secretory rhythm, carbohydrate metabolism and lipolysis/ketogenesis over longer periods of time (Spiegel et al 2009, Leproult and Van Cauter 2010). However, additional studies controlling dietary factors and including parallel measurements of blood glucose levels and endocrine function will be required for further strengthening the links outlined above. In addition, it has been demonstrated that fat content of the diet has an impact on circadian rhythmicity such as cycle length (Kohsaka et al 2007). Furthermore, a genetic variant regulating CPT1B which is involved in fatty-acid β-oxydation has been linked to sleep regulation (Miyagawa et al 2008).
Contrary to acetone, breath isoprene exhibits a high degree of short-term variability during sleep. Specifically, the frequently occurring concentration peaks throughout the night closely resemble the exhalation kinetics of this compound at the onset of exercise. It has been demonstrated in a number of studies that even moderate ergometer challenges with workload levels around 50 W are sufficient for increasing the end-tidal isoprene concentrations by a factor of ∼3 to 4 within a delay time of 1–2 min after the start of pedaling, see, e.g., Karl et al (2001) and King et al (2009). In particular, these exercise-induced peaks emerge despite a parallel rise of the ventilation-perfusion ratio, which should lead to diminished breath concentrations of low blood soluble VOCs according to classical pulmonary inert gas elimination theory (Farhi 1967, Mochalski et al 2011). Similar observations can also be made during sleep, with isoprene peaks arising in spite of stable or temporarily increased ventilation-perfusion ratios, see figures 2 and 4.
In the case of exercise, this discrepancy has recently been explained by reference to a higher fractional perfusion of a peripheral isoprene buffer (probably representing skeletal muscle tissue) in response to physical activity (King et al 2010a, Koc et al 2011). The observation that almost all of the breath isoprene peaks during sleep follow scored LM as determined by anterior tibialis EMG (see table 3) appears to be consistent with this rationale. As noted in section 3.3 (b), movement can be seen as a necessary condition for the appearance of breath isoprene peaks during sleep, which renders breath isoprene as an interesting complementary index for monitoring sleep behavior. On the other hand, in terms of sensitivity it should be noted that not every EMG event implies the occurrence of an associated concentration peak. EMG events without isoprene increase are likely to correspond to movements of less intensity or with a smaller number of muscle groups involved; however, more precise assessments including accurate bio-calibration procedures and simultaneous video image recording will be required for corroborating this view.
At the onset of sleep, the individual isoprene levels in end-tidal breath for all test subjects conform to a concentration of about 100 ppb typical for adults under resting conditions (Kushch et al 2008, King et al 2009). In accordance with earlier findings, baseline isoprene concentrations tend to increase overnight (Cailleux and Allain 1989, Amann et al 2005, DeMaster and Nagasawa 1978). The reason for this is still unclear. While ventilation and perfusion (cardiac output) have been demonstrated to constitute major physiological determinants of breath isoprene output (Karl et al 2001, King et al 2010a), the apparently stable behavior of the ventilation-perfusion ratio during periods of long-term isoprene increase (i.e. extending over 30 min and more, see figure 4 for instance) suggests that other factors such as changes in endogenous production and/or systemic distribution may have to be taken into account for clarifying this behavior. The primary source of isoprene formation in man has been attributed to the mevalonate pathway of cholesterol biosynthesis (Deneris et al 1984), which indeed shows a circadian rhythm peaking during nighttime (Jones and Schoeller 1990, Parker et al 1982). However, whether this non-enzymatic pathway prevails in the endogenous production of isoprene under physiological conditions continues to be a matter of debate and the range of tissue groups contributing to the metabolic fate of isoprene remains to be settled.
It might be of interest in this context that the above-mentioned concentration increases appear to be associated mainly with the NREM phase of each sleep cycle, which is believed to be markedly anabolic in nature (Cardinali and Pandi-Perumal 2006). In contrast, when entering the subsequent REM phase a more or less pronounced drop of the baseline isoprene level can be observed, cf section 3.3 (a). The reason for this remains to be elucidated. While concentration decreases as mentioned above might typically be due to a rise in ventilatory flow, the fact that ventilation is generally at its lowest during REM sleep makes this an unlikely explanation (Douglas et al 1982). On the other hand, since it has proven difficult to reliably record long-term tidal volume profiles by means of our experimental setup (cf section 2.1 (b)), no definite conclusions can be provided. A useful strategy for future investigations in this context might be to replace differential pressure spirometry by flow measurement methods that are less prone to movement artifacts, e.g. ultrasound spirometry. Furthermore, it should be noted that even if the ventilation rate stays constant, VOC concentrations may decrease due to shifts in the ventilation-perfusion distribution, for instance in response to changes in body posture (e.g. if respiratory flow is mainly directed toward highly ventilated but low perfused alveoli). Additionally, by adopting the above-mentioned peripheral muscle source of isoprene as a working hypothesis, sleep stage specific factors such as muscle atonia or reduced muscle blood flow might play a role in the observed reduction of breath isoprene output during REM periods (Miki et al 2004).
5. Conclusions
Exhaled breath analysis is becoming increasingly recognized as an intriguing tool for gaining non-invasive information on the current physiological state of an individual. Major advantages of this methodology when compared to conventional test procedures include unlimited sampling as well as the possibility for a real-time analysis of endogenous events. This is of particular interest in sleep research where the continuous extraction of other biochemical probes such as blood or urine samples is both cumbersome and time-intensive.
Within this context, we have described a setup for consistently measuring overnight concentration profiles of acetone and isoprene, two of the most abundant endogenous trace gases in human breath. With the advent of novel mass spectrometric techniques offering full spectral information in each measurement cycle (such as PTR-TOF (Herbig et al 2009)) as well as compact substance-specific sensors drastically reducing instrumental burden we are confident that future investigations will rapidly extend this knowledge base and yield further insights into the links between breath VOCs and sleep-related physiology.
Acknowledgments
The research leading to these results has received funding from the European Community's Seventh Framework Programme (FP7/2007-13) under grant agreement no 217967. We appreciate funding from the Austrian Federal Ministry for Transport, Innovation and Technology (BMVIT/BMWA, project 818803, KIRAS). GT and JK acknowledge support from the Austrian Science Fund (FWF) under grant no Y330. We greatly appreciate the generous support (unrestricted grant) by the government of Vorarlberg, Austria. We thank Peter Hamm, Helmut Wiesenhofer and Maria Schmid for their excellent technical assistance. Furthermore, we are indebted to the reviewers for their constructive criticism of the manuscript.
All authors have neither personal nor financial disclosures in the subject matter of the paper, nor are they involved with organizations with financial interest in the subject matter of the paper.